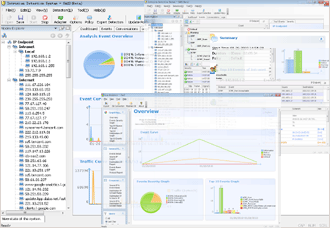
When dealing with extremely large capture files, you sometimes need to determine the distribution of protocols in the file—that is, what percentage of a capture is TCP, IP, DHCP, and so on. Rather than counting each packet and totaling the results, you can use Unicorn’s Protocol Hierarchy Statistics window, which is a great way to benchmark your network. For instance, if you know that 10 percent of your network traffic is usually made up of ARP traffic, and one day you take a capture that is 50 percent ARP traffic, then you know something might be wrong.
Start a new project and switch protocol tab, see figure below, Notice that not all totals add up to exactly 100 percent. Because many of the packets contain multiple protocols from various layers, the count of each protocol as compared to each packet may be off. Nevertheless, you will still get an accurate view of the distribution of protocols in the capture file.
Figure 5-7: The Protocol View shows the distribution of various protocols.
The Protocol Hierarchy Statistics window is often one of the first windows you look at when examining traffic. It really gives you a good snapshot of the type of activity occurring on a network. As you begin to look at more traffic, you will eventually be able to profile the users and devices on a network just by looking at the distribution of protocols in use. I’ve found that simply by looking at traffic from a network segment, I can often immediately identify the network segment as belonging to the IT department due to the presence of administrative protocols such as ICMP or SNMP, or to the order fulfillment department due to the high volume of SMTP traffic, or even to that pesky new intern in the corner with his World of Warcraft traffic!


