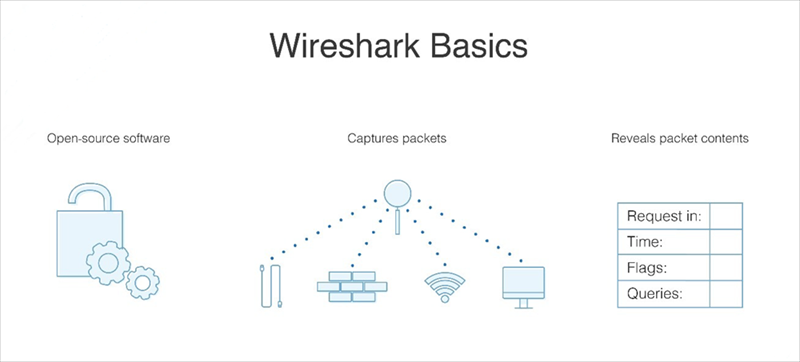
Few tools are as essential to IT professionals as Wireshark, the premier network packet capture tool. Wireshark empowers you to capture network packets and analyze them in-depth, providing insights into network performance and security. By dissecting packets at a granular level, Wireshark enables real-time and offline analysis, allowing you to uncover the root causes of network issues. Wireshark acts as a microscope for your network traffic, enabling you to filter, drill down, and zoom in on specific elements, facilitating effective network analysis and bolstering network security. How to use Wireshark for network analysis? In this comprehensive Wireshark network analysis tutorial, you’ll learn how to capture, interpret, filter, and inspect data packets to troubleshoot effectively.
What is Wireshark?
Wireshark stands out as a network protocol analyzer, acting as a vital tool for capturing packets from various network connections, whether it’s between your computer and your home office or across the vast expanse of the internet. In the realm of packet sniffers, Wireshark reigns supreme, serving as the go-to choice for countless users worldwide.
Wireshark excels in three primary functions:
- Packet Capture: Operating in real-time, Wireshark listens to network connections and captures entire streams of traffic, sometimes handling tens of thousands of packets simultaneously.
- Filtering: With its robust filtering capabilities, Wireshark allows users to slice and dice the live data, enabling them to extract specific information tailored to their needs.
- Visualization: Just like a skilled spelunker navigating through a cave, Wireshark users delve into the heart of network packets, visualizing entire conversations and network streams.
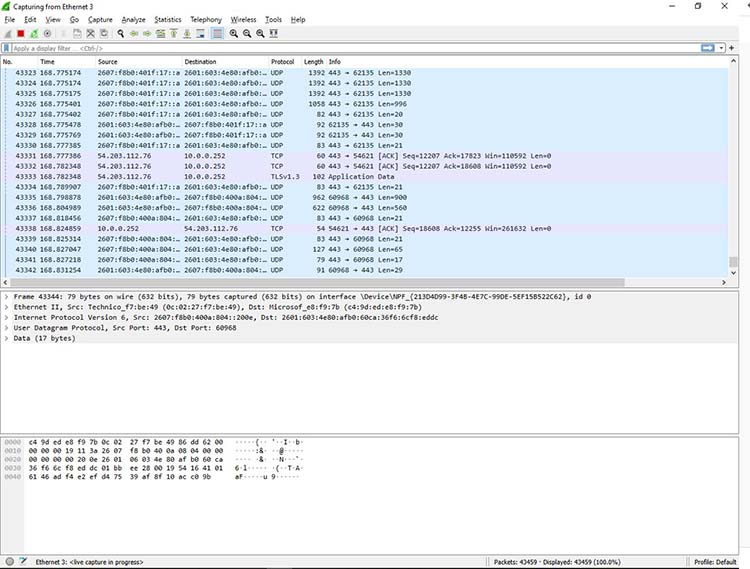
Figure 1: Viewing a packet capture in Wireshark
This comparison to spelunking is fitting – users of Wireshark traverse the intricate network pathways much like explorers wielding flashlights in dark caves, seeking out valuable insights. Whether you’re using Wireshark to analyze a network connection or a flashlight to explore a cave, you’re essentially using a tool to navigate through tunnels and tubes to discover what lies within.
What Is Wireshark Used For?
Wireshark serves various purposes, including diagnosing network performance issues. Cybersecurity experts often utilize Wireshark for connection tracing, analyzing suspicious network transactions, and identifying spikes in network traffic. It’s an indispensable component of any IT professional’s arsenal, assuming they possess the requisite expertise to leverage its capabilities effectively.
When Should Wireshark Be Used?
Wireshark is a trusted tool utilized by government agencies, educational institutions, corporations, small businesses, and nonprofits alike for troubleshooting network issues. Moreover, Wireshark serves as an invaluable educational resource.
Individuals new to information security can leverage Wireshark to grasp network traffic analysis, understand communication protocols, and pinpoint where issues arise. However, Wireshark has its limitations:
- Understanding of Network Protocols: Wireshark requires users to have a solid grasp of network protocols. Without this foundational knowledge, users may struggle to effectively utilize the tool. Understanding concepts such as the three-way TCP handshake and protocols like TCP, UDP, DHCP, and ICMP is essential.
- Limited Traffic Capture: Wireshark cannot capture traffic from all systems on a network under normal circumstances. In modern network setups with switches, Wireshark can only sniff traffic between the local computer and the remote system it communicates with.
- Lack of Intrusion Detection: While Wireshark can detect malformed packets and apply color coding, it does not function as an intrusion detection system (IDS) and does not provide alerts.
- Inability to Decrypt Encrypted Traffic: Wireshark cannot assist with decrypting encrypted traffic.
- Vulnerability to IP Spoofing: It is relatively easy to spoof IPv4 packets, and Wireshark cannot reliably determine if a captured IP address is legitimate without additional expertise and software.
In summary, while Wireshark is a powerful tool for network analysis, users must be aware of its limitations and possess the necessary knowledge to utilize it effectively.
Common Wireshark User Cases
Let’s explore a typical scenario where Wireshark proves instrumental in diagnosing a problem. In this instance, we encounter a home network experiencing sluggish internet connectivity.
Upon analysis, the Wireshark capture reveals that the router perceives a common destination as unreachable. This anomaly is unearthed by delving into the IPv6 Internet Message Control Protocol (ICMP) traffic, which is highlighted in black. In Wireshark, packets marked in black typically indicate some form of issue.
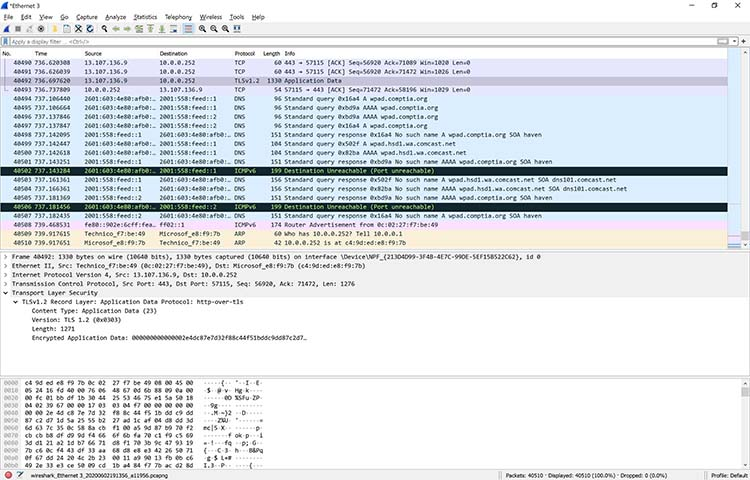
Figure 2: Drilling down into a packet to identify a network problem using Wireshark
In this particular scenario, Wireshark proved invaluable in pinpointing the root cause of the problem: the router’s malfunction causing difficulty in accessing YouTube. Fortunately, restarting the cable modem resolved the issue. While this specific problem may not have necessitated the use of Wireshark, it was satisfying to definitively resolve the issue.
Upon closer examination of Figure 2, a specific packet is highlighted, revealing the details of a TCP packet involved in a Transport Layer Security (TLS) conversation. This demonstrates how Wireshark allows users to drill down into captured packets, providing insight into network communications.
Although Wireshark cannot decrypt encrypted packet contents, it enables users to identify the TLS version utilized by the browser and YouTube for encryption. Interestingly, during the monitoring process, the encryption transitioned to TLS version 1.2.
Wireshark is frequently employed to address more complex network issues. For instance, excessive retransmissions can lead to congestion. With Wireshark, specific retransmission issues can be identified, as depicted in Figure 3.
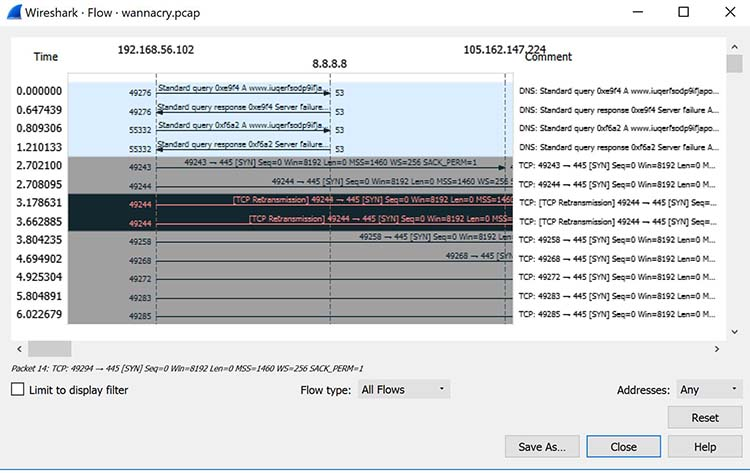
Figure 3: Viewing packet flow statistics using Wireshark to identify retransmissions
By confirming this type of issue, you can then reconfigure the router or switch to speed up traffic.
How to Use Wireshark for Network Analysis
You can download Wireshark for free at www.wireshark.org. It’s also freely available, as an open source application under the GNU General Public License version 2.
How to Install Wireshark on Windows
For Windows users, it’s essential to download the appropriate version of Wireshark tailored to your operating system. If you’re using Windows 10, for instance, you would select the 64-bit Windows installer and proceed to follow the installation wizard. Remember, installation requires administrator permissions to complete successfully.
How to Install Wireshark on Linux
If you have a Linux system, you’d install Wireshark using the following sequence (notice that you’ll need to have root permissions):
$ sudo apt-get install wireshark
$ sudo dpkg-reconfigure wireshark-common
$ sudo usermod -a -G wireshark $USER
$ newgrp wireshark
Once you have completed the above steps, you then log out and log back in, and then start Wireshark:
$ wireshark &
How to Capture Packets Using Wireshark
After installing Wireshark, you can begin capturing network traffic. However, remember that to capture packets, you must have the proper permissions on your computer to enable Wireshark’s promiscuous mode.
On a Windows system, this typically requires administrator access.
On a Linux system, root access is usually necessary.
Once you have the appropriate permissions, there are several ways to start the capture. One of the best methods is to select Capture >> Options from the main Wireshark window. This action will open the Capture Interfaces window, as depicted below in Figure 4.
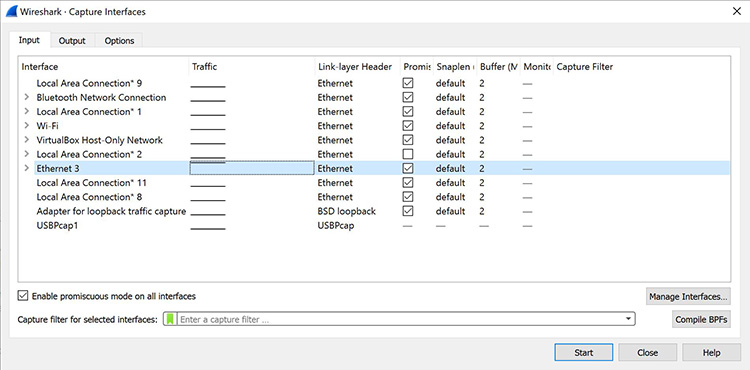
Figure 4: The Capture Interfaces dialog in Wireshark
In the Capture Interfaces window, you will find a list of all available interfaces. Wireshark offers several options to choose from.
For this demonstration, let’s choose the Ethernet 3 interface, which is the most active. Wireshark illustrates the traffic with a moving line, representing the packets on the network.
Once you’ve selected the network interface, simply click the Start button to initiate the capture. As the capture begins, you can observe the packets appearing on the screen, as depicted in Figure 5 below.
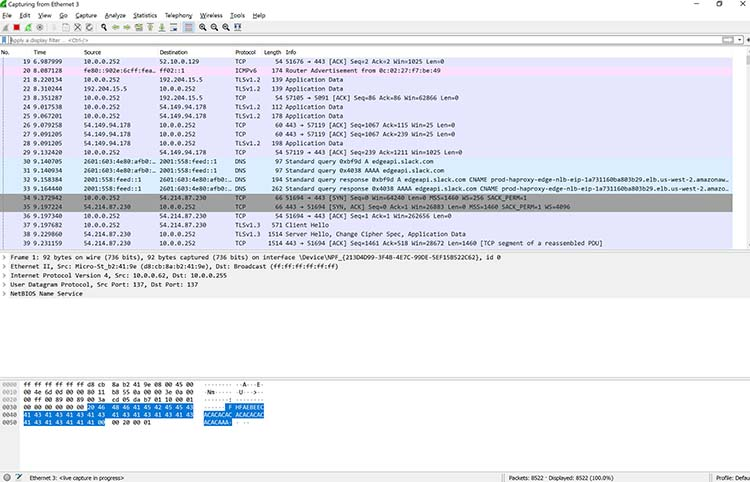
Figure 5: Wireshark capturing packets
Once you have captured all the packets that you want, simply click the red, square button at the top. Now you have a static packet capture to investigate.
What the Color Coding Means in Wireshark?
Now that you have some packets, it’s time to figure out what they mean. Wireshark tries to help you identify packet types by applying common-sense color coding. The table below describes the default colors given to major packet types.
| Color in Wireshark | Packet Type |
|---|---|
| Light purple | TCP |
| Light blue | UDP |
| Black | Packets with errors |
| Light green | HTTP traffic |
| Light yellow | Windows-specific traffic, including Server Message Blocks (SMB) and NetBIOS |
| Dark yellow | Routing |
| Dark gray | TCP SYN, FIN and ACK traffic |
The default coloring scheme is shown below in Figure 6. You can view this by going to View >> Coloring Rules.
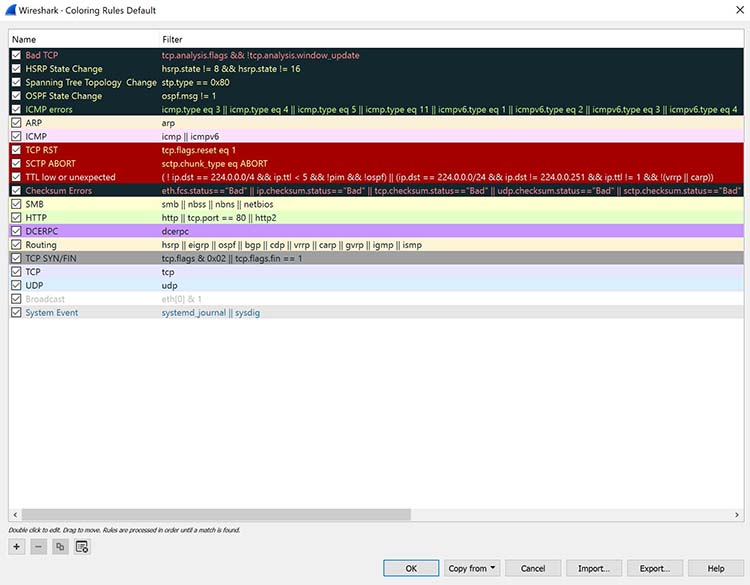
Figure 6: Default coloring rules
You have the option to customize the default coloring or apply a custom rule in Wireshark. If you prefer no coloring, navigate to View and click Colorize Packet List. This option is toggleable, so if you want coloring back, simply click Colorize Packet List again. Furthermore, you can colorize specific conversations between computers.
In Figure 7 below, you’ll notice standard UDP packets are highlighted in light blue, TCP packets in light purple, TCP handshake packets in dark gray, and routing traffic in yellow.
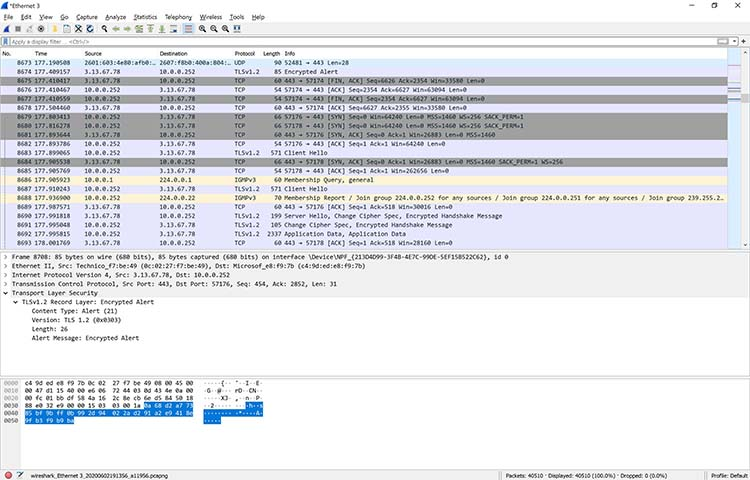
Figure 7: Viewing colorized packets in Wireshark
However, you’re not limited to just interpreting by color. It’s possible to view the input/output (I/O) statistics of an entire packet capture.
In Wireshark, just go to Statistics >> I/O Graph, and you’ll see a graph similar to the one shown in Figure 8.
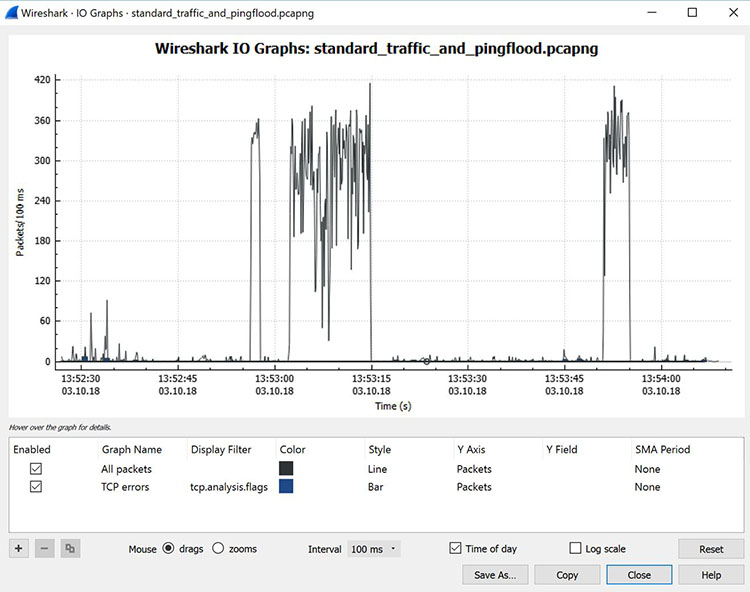
Figure 8: Viewing the input/output traffic graph in Wireshark
The graph displayed in this example illustrates typical traffic patterns generated by a home office. The spikes in the graph indicate bursts of traffic caused by a Distributed Denial of Service (DDoS) attack orchestrated using several Linux systems.
In this scenario, three significant traffic bursts occurred. Cybersecurity professionals often rely on Wireshark as a rapid and effective method to identify such traffic bursts during attacks.
Additionally, Wireshark enables capturing the volume of traffic exchanged between two systems. By accessing the Statistics menu and selecting Conversations, you can view a summary of conversations between endpoints, as depicted in Figure 9 below.
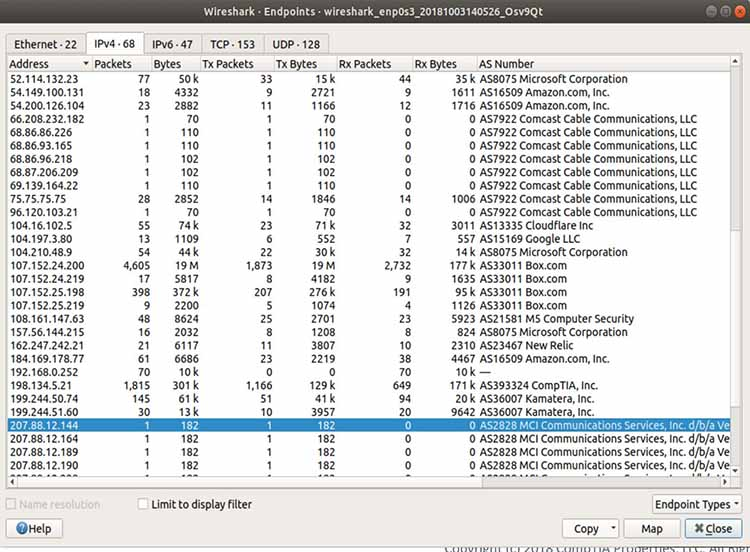
Figure 9: Viewing endpoint conversations in Wireshark
In the instance described above, Wireshark was employed to trace an old piece of equipment from MCI Communications running on a client’s network. Surprisingly, the client was unaware of this device’s presence on the network.
Consequently, it was removed, contributing to enhancing network security. Additionally, the analysis revealed a significant amount of traffic directed towards Amazon (for server administration in AWS) and Box.com (for system backup).
In some cases, Wireshark can even help identify the geographic locations of the source and destination traffic. By clicking on the Map button at the bottom of the screen (as depicted in Figure 9), Wireshark provides a map (Figure 10) indicating its best estimate of the IP addresses’ locations.
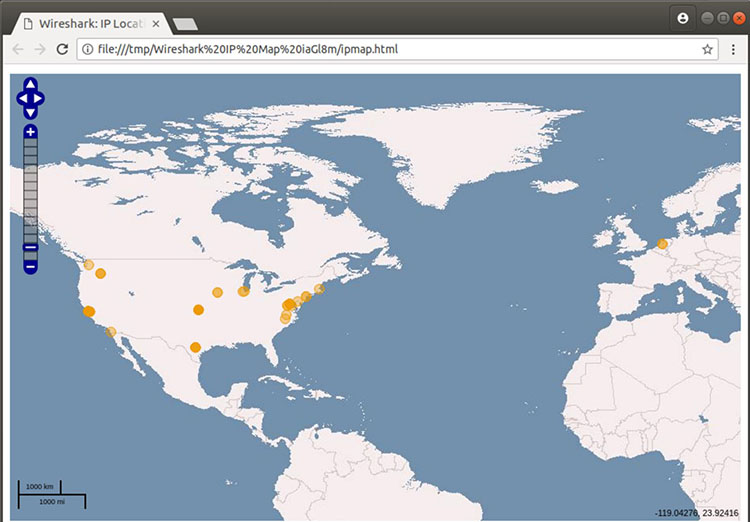
Figure 10: Viewing geographic estimations in Wireshark
Because IPv4 addresses can be easily spoofed, you can’t rely completely on this geographical information. But it can be fairly accurate.
How to Filter and Inspect Packets in Wireshark
You can apply Wireshark filters in two ways:
- In the Display Filter window, at the top of the screen
- By highlighting a packet (or a portion of a packet) and right-clicking on the packet
| ip.addr | Specifies an IPv4 address |
| ipv6.addr | Specifies an IPv6 address |
| src | Source – where the packet came from |
| dst | Destination – where the packet is going |
You can also use the following values:
| && | Means “and,” as in, “Choose the IP address of 192.168.2.1 and 192.168.2.2” |
| == | Means “equals,” as in “Choose only IP address 192.168.2.1” |
| ! | Means “not,” as in, do not show a particular IP address or source port |
Valid filter rules in Wireshark are consistently displayed in green. However, if you make an error in a filter rule, the box will turn a vivid pink.
Let’s begin with a couple of basic rules. For instance, suppose you want to view packets containing only the IP address 18.224.161.65. You would create the following command line and enter it into the Filter window:
ip.addr == 18.224.161.65
Figure 11 shows the results of adding that filter:
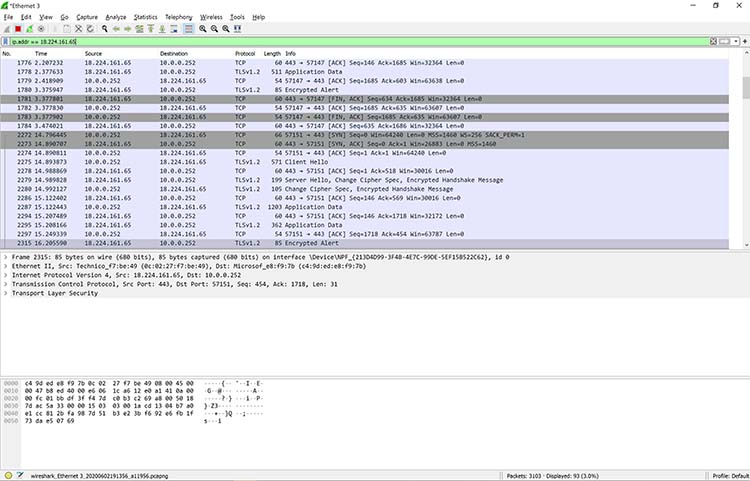
Figure 11: Applying a filter to a capture in Wireshark
Alternatively, you have the option to highlight the IP address of a packet and create a filter directly from it. After selecting the IP address, right-click, and then choose the Apply As Filter option.
A menu of additional options will appear. One of these is called Selected. If you opt for Selected, Wireshark will generate a filter that displays only packets containing that specific IP address.
You can also choose to filter out a specific IP address using the following filter, as shown in Figure 12:
!ip.addr==18.224.161.65
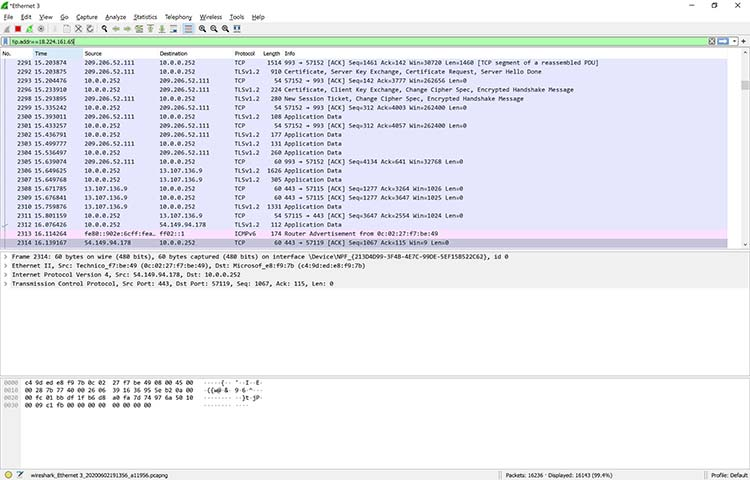
Figure 12: Filtering out a specific IP address in Wireshark
You’re not limited to just IPv4 addresses. For example, if you want to see if a particular computer is active and using an IPv6 address on your network, you can open up a copy of Wireshark and apply the following rule:
ipv6.dst == 2607:f8b0:400a:15::b
This same rule is shown in Figure 13.
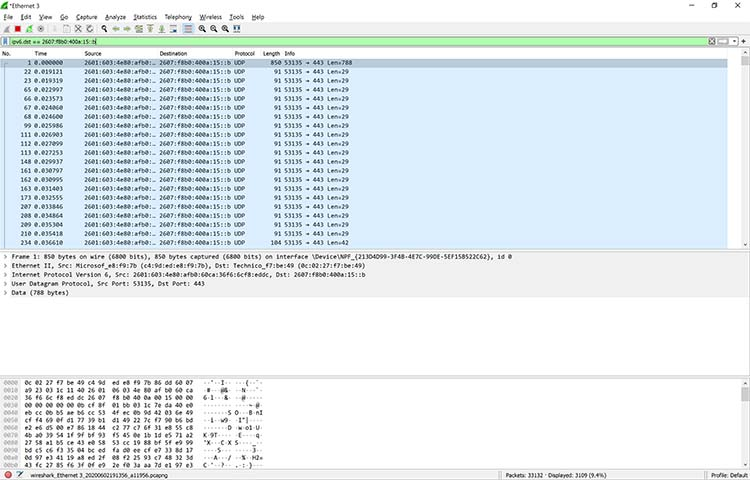
Figure 13: Applying an IPv6 filter in Wireshark
Clearly, this system is alive and well, talking on the network. There are so many possibilities.
Additional filters include:
| tcp.port==8080 | Filters packets to show a port of your own choosing – in this case, port 8080 |
| !(ip.src == 162.248.16.53) | Shows all packets except those originating from 162.248.16.53 |
| !(ipv6.dst ==2607:f8b0:400a:15::b) | Shows all packets except those going to the IPv6 address of 2607:f8b0:400a:15::b |
| ip.addr == 192.168.4.1 &&ip.addr == 192.168.4.2 | Shows both 192.168.4.1 and 192.168.4.2 |
| http.request | Shows only http requests – useful when troubleshooting or visualizing web traffic |
As you can see, Wireshark is a powerful application.
Learn More About Wireshark After Learning How to Use Wireshark for Network Analysis
For those interested in delving deeper into Wireshark, consider attending the hour-long webinar titled “Using Wireshark: A Hands-on Demonstration.” This webinar provides valuable insights and practical demonstrations. It’s available on demand, requiring only registration to access the video.
Additionally, the table below provides links to Wireshark downloads and actual packet captures, allowing for further learning. You can also download a quick “cheat sheet” in PDF form from Packetlife.net.


