1. Introduction to Network Packet Loss
This issue illustrates a common network challenge: Network Packet Loss. For instance, when pinging a website, a successful ping that returns complete information indicates smooth communication with the server. However, if the ping fails or the response is incomplete, it often points to data loss. Many of us have likely encountered such situations. To help understand Network Packet Loss, I’ve gathered some common methods for diagnosing network packet loss issues. By following these steps, you can gain a clearer understanding of network packet loss. Don’t panic when it happens—stay tuned to learn more about managing and troubleshooting network packet loss.
1.1 What is network packet loss?
Data is transmitted on the Internet in packets, which are measured in bytes. When data is transmitted on the network, it is affected by factors such as network equipment and network quality, resulting in less received data than sent data, causing network packet loss.
1.2 Principles of receiving and sending data packets
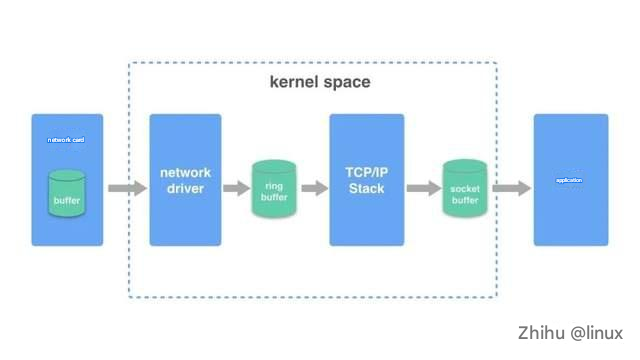
Sending a packet:
1. The data packet of the application program adds a TCP header at the TCP layer to form a transmittable data packet.
2. An IP header is added at the IP layer to form an IP packet.
3. The data network card driver adds a 14-byte MAC header to the IP packet to form a frame (no CRC yet). The frame (no CRC yet) contains the MAC addresses of the sender and receiver.
4. The driver copies the frame (no CRC yet) to the buffer of the network card, which is processed by the network card.
5. The network card adds header synchronization information and CRC check to the frame (no CRC yet), encapsulates it into a packet that can be sent, and then sends it to the network cable. In this way, the sending of an IP packet is completed, and all network cards connected to this network cable can see the packet.
Receive a packet:
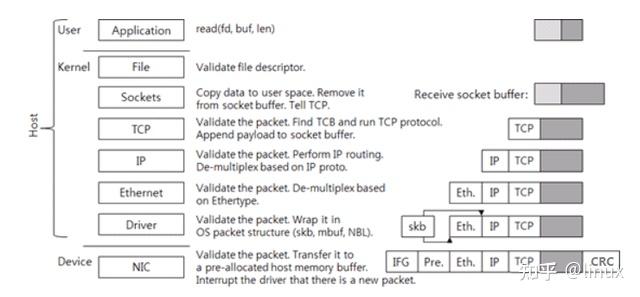
1. The network card receives the packet on the network line, first checks the CRC check of the packet to ensure integrity, then removes the packet header to get the frame. (The network card will check whether the destination MAC address in the MAC packet is the same as the MAC address of the network card. If not, it will be discarded.)
2. The network card copies the frame to the pre-allocated ring buffer.
3. The network card driver notifies the kernel to process, and the TCP/IP protocol stack decodes the data layer by layer.
4. The application reads data from the socket buffer.
1.3 Core idea
After understanding the principle of sending and receiving packets, we can know that the main reasons for network packet loss are network card devices, network card drivers, and kernel protocol stacks. In the following, we will follow the principle of “layered analysis from bottom to top (possible network packet loss scenarios at each layer), then check key information, and finally get the analysis results” to introduce.
2. Overview of Network Packet Loss Scenarios
2.1 Hardware NIC packet loss
2.1.1 Ring Buffer Overflow
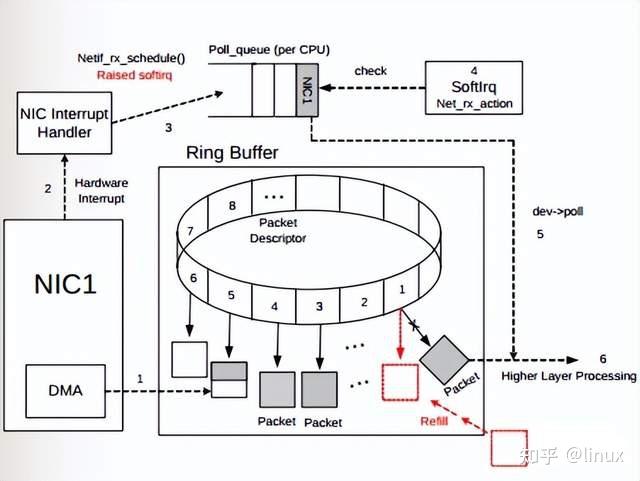
As shown in the figure, after the data frame arrives on the physical medium, it is first read by the NIC (network adapter) and written into the device’s internal buffer, the Ring Buffer, and then consumed by the interrupt handler triggering the Softirq. The size of the Ring Buffer varies depending on the network card device. When the rate at which network data packets arrive (produce) is faster than the rate at which the kernel processes (consumes), the Ring Buffer will soon be filled and the new data packets will be discarded;
Check:
You can use ethtool or /proc/net/dev to view the statistics of packets discarded due to Ring Buffer being full. The statistics are marked with fifo:
$ ethtool -S eth0|grep rx_fifo
rx_fifo_errors: 0
$ cat /proc/net/dev
Inter-|Receive | Transmitface |bytes packets errs drop fifo frame compressed
multicast|bytes packets errs drop fifo colls carrier compressed
eth0: 17253386680731 42839525880 0 0 0 0 0 244182022 14879545018057 41657801805 0 0 0 0 0 0
# View the maximum and current settings of the Ring Buffer of the eth0 network card
$ ethtool -g eth0Solution: Modify the size of the receiving and sending hardware buffers of the network card eth0
$ ethtool -G eth0 rx 4096 tx 40962.1.4 NIC port negotiation network packet loss
1. Check the network packet loss statistics of the network card: ethtool -S eth1/eth0
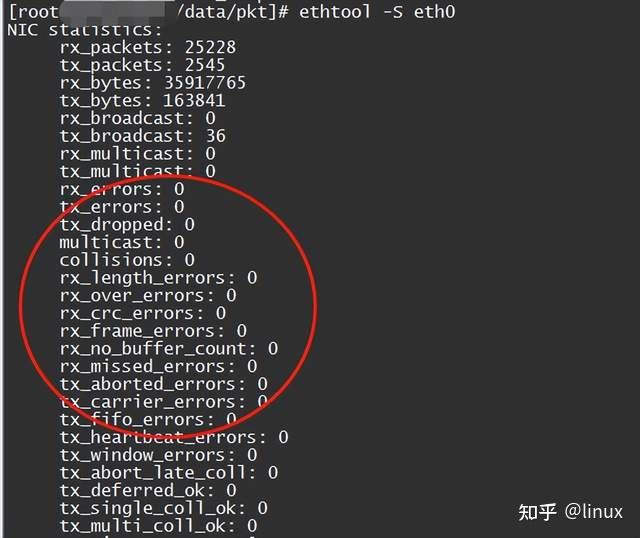
2. Check the network card configuration status: ethtool eth1/eth0
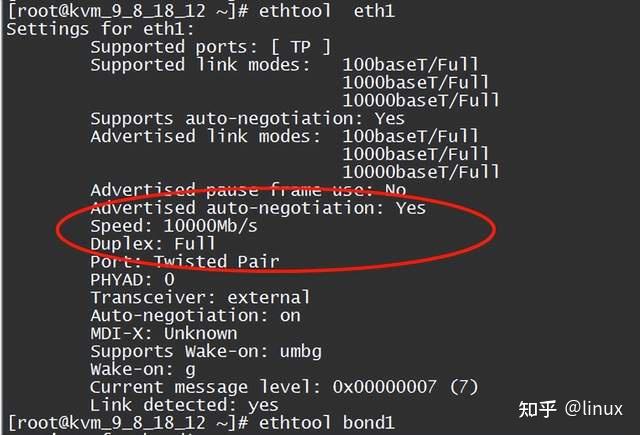
Mainly check whether the negotiation rate and mode between the network card and the upstream network device meet expectations;
Solution:
1 Re-negotiation: ethtool -r eth1/eth0;
2 If the upstream does not support auto-negotiation, you can force the port rate to be set:
ethtool -s eth1 speed 1000 duplex full autoneg off2.1.4 NIC flow control network packet loss
1. View flow control statistics:
ethtool -S eth1 | grep control
rx_flow_control_xon is the count of pause frames sent to the switch port to enable flow control when the NIC’s RX Buffer is full or other NIC internal resources are limited. Correspondingly, tx_flow_control_xoff is the count of pause frames sent to disable flow control after resources are available.
2. Check the network flow control configuration: ethtool -a eth1

Solution: Disable network card flow control
ethtool -A ethx autoneg off //Auto-negotiation off
ethtool -A ethx tx off //Transmit module off
ethtool -A ethx rx off //Receive module off
2.1.5 Network packet loss due to MAC address
Generally, computer network cards work in non-promiscuous mode. At this time, the network card only accepts data from the network port whose destination address points to itself. If the destination MAC address of the message is not the MAC address of the interface on the other end, the packet will generally be lost. Generally, this situation is likely that the source end sets a static ARP table entry or the dynamically learned ARP table entry is not updated in time, but the destination MAC address has changed (the network card has been replaced), and no update notification has been sent to the source end (for example, the update message is lost, the intermediate switch is abnormal, etc.);
Check:
1. Capture packets at the destination end. Tcpdump can enable promiscuous mode to capture the corresponding packets and then check the MAC address.
2. The source end checks the ARP table or captures the packet (previous hop device) to see whether the sent MAC address is consistent with the MAC address of the next hop destination;
Solution:
1. Refresh the ARP table and send a packet to trigger ARP re-learning (this may affect other messages and increase latency, so be careful).
2. You can manually set the correct static ARP table entry at the source end;
2.1.6 Other network cards have abnormal network packet loss
Other network cards have abnormal network packet loss
This type of exception is rare, but if none of the above situations occur, but there are still network packet loss counts in the network card statistics, you can try to check:
Network card firmware version:
Check if there is a bug in the NIC phy chip firmware and whether the installed version meets the expectations. Check ethtool -i eth1:

File a case with the manufacturer to ask if it is a known issue, whether there is a new version, etc.;
The network cable has poor contact:
If the CRC error count in the network card statistics increases, it is likely that the network cable is in poor contact. You can notify the network administrator to check:
ethtool -S eth0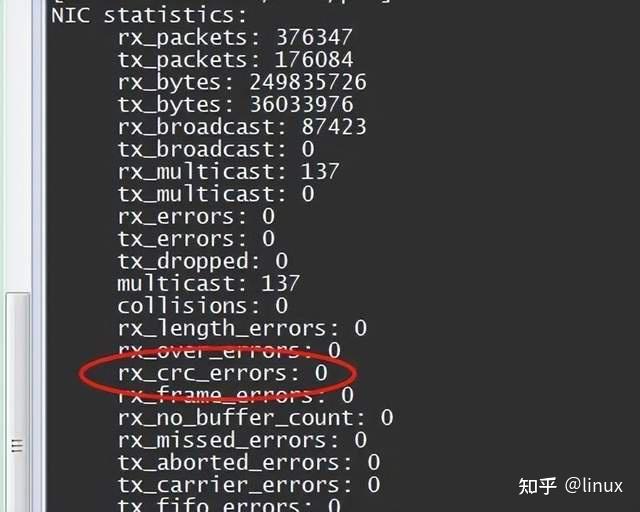
Solution: Generally, try to re-plug the network cable, or change a network cable, check whether the socket meets the port specifications, etc.;
Packet length loss
The network card has the correct message length range for receiving. Generally, the normal Ethernet message length range is: 64-1518. The sender will normally fill or fragment to adapt. Occasionally, some abnormal situations may occur, resulting in abnormal network packet loss.
Check:
ethtool -S eth1|grep length_errors
Solution:
1 Adjust the interface MTU configuration to see whether to enable support for Ethernet jumbo frames;
2. The sender turns on PATH MTU for reasonable fragmentation;
A brief summary of network card packet loss:
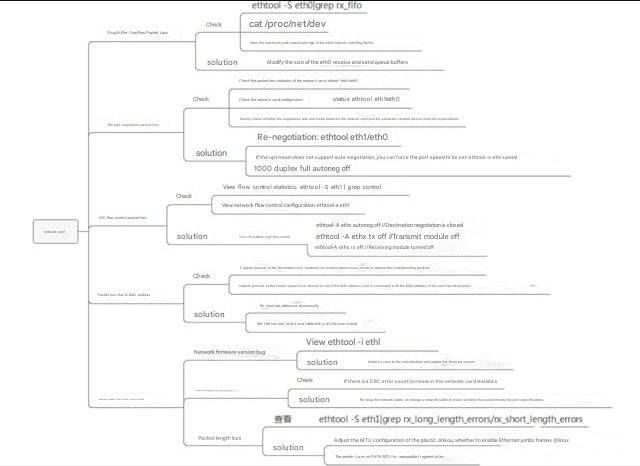
2.2 Network card driver network packet loss
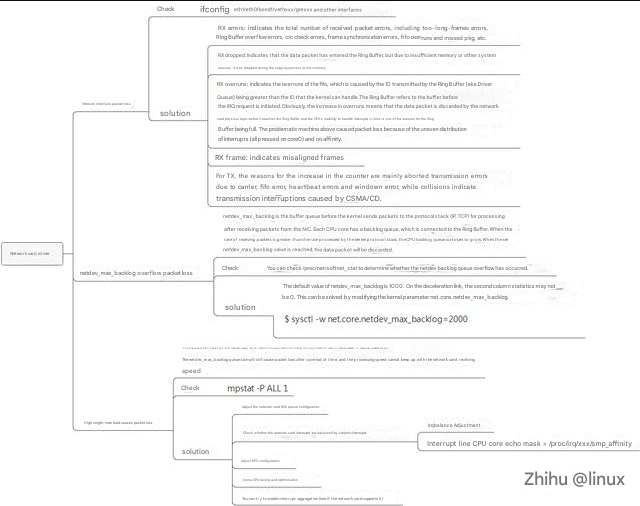
View: ifconfig eth1/eth0 and other interfaces

1.RX errors: Indicates the total number of received packet errors, including too-long-frames errors, Ring Buffer overflow errors, crc check errors, frame synchronization errors, fifo overruns and missed pkg, etc.
2.RX dropped: Indicates that the data packet has entered the Ring Buffer, but was discarded during the copying process to the memory due to system reasons such as insufficient memory.
3.RX overruns: indicates the overruns of the fifo, which is caused by the IO transmitted by the Ring Buffer (aka Driver Queue) being greater than the IO that the kernel can handle, and the Ring Buffer refers to the buffer before the IRQ request is initiated. Obviously, the increase in overruns means that the data packet is discarded by the network card physical layer before it reaches the Ring Buffer, and the inability of the CPU to handle interrupts in time is one of the reasons for the Ring Buffer being full. The problematic machine above caused network packet loss because of the uneven distribution of interruptrs (all pressed on core0) and no affinity.
4. RX frame: indicates misaligned frames.
5. For TX, the reasons for the above counter increase mainly include aborted transmission, errors due to carrier, fifo error, heartbeat errors and windown error, while collisions indicate transmission interruptions caused by CSMA/CD.
2.2.1 Driver overflow network packet loss
netdev_max_backlog is the buffer queue before the kernel receives packets from the NIC and passes them to the protocol stack (such as IP, TCP) for processing. Each CPU core has a backlog queue. Similar to the Ring Buffer, when the rate of receiving packets is greater than the rate processed by the kernel protocol stack, the CPU backlog queue continues to grow. When the set netdev_max_backlog value is reached, the data packet will be discarded.
Check:
You can determine whether a netdev backlog queue overflow has occurred by viewing /proc/net/softnet_stat:
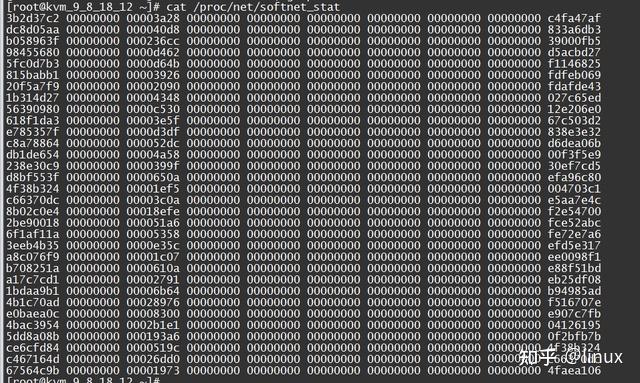
Each row represents the statistics of each CPU core, starting from CPU0 and going down; each column represents the statistics of a CPU core: the first column represents the total number of packets received by the interrupt handler; the second column represents the total number of packets discarded due to netdev_max_backlog queue overflow. From the above output, we can see that there is no network packet loss caused by netdev_max_backlog in the statistics of this server.
Solution:
The default value of netdev_max_backlog is 1000. On high-speed links, the second statistic may not be 0. This can be
solved by modifying the kernel parameter net.core.netdev_max_backlog:
$ sysctl -w net.core.netdev_max_backlog=20002.2.2 High single-core load causes packet loss
The single-core CPU has a high soft interrupt usage, which results in the application not having the opportunity to send and receive packets or receiving packets slowly. Even if the netdev_max_backlog queue size is adjusted, packets will still be lost after a period of time, and the processing speed cannot keep up with the speed of the network card receiving packets.
View: mpstat -P ALL 1
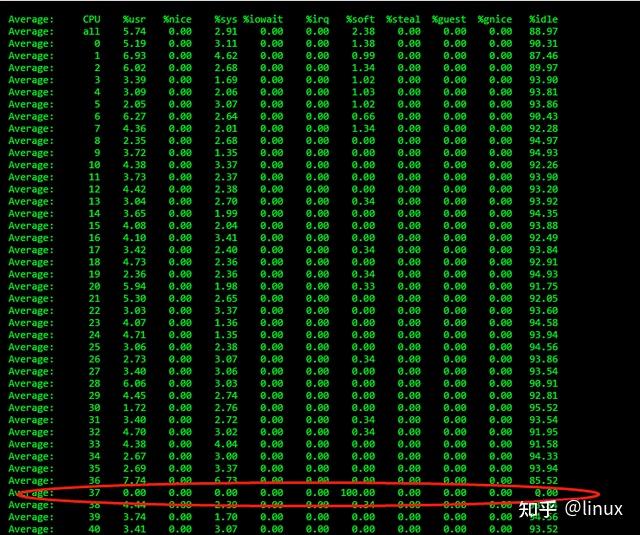
Single-core soft interrupts account for 100%, resulting in the application having no chance to send or receive packets or packet reception being slow and causing network packet loss;
Solution :
1. Adjust the network card RSS queue configuration:
Check: ethtool -x ethx;
Adjustment: ethtool -X ethx xxxx;
2. Check whether the network card interrupt configuration is balanced cat /proc/interrupts
Adjustment:
1) Adjust irqbalance;
# View the current running status
service irqbalance status
# Stop the service
service irqbalance stop
2) Bind interrupts to CPU cores echo mask > /proc/irq/xxx/smp_affinity
3. Adjust the NIC multi-queue and RPS configuration according to the number of CPU and NIC queues
-CPU is greater than the number of network card queues:
Check the network card queue ethtool -x ethx;
The protocol stack enables RPS and sets RPS;
echo $mask (CPU configuration) > /sys/class/net/$eth/queues/rx-$i/rps_cpus
echo 4096 (NIC buff) > /sys/class/net/$eth/queues/rx-$i/rps_flow_cnt
2) If the CPU is less than the number of NIC queues, just bind the interrupt. You can try to disable RPS to see the effect:
echo 0 > /sys/class/net/<dev>/queues/rx-<n>/rps_cpus
4. Numa CPU adjustment and alignment of network card positions can increase kernel processing speed, thereby giving more CPUs to receive packets for applications and reducing the probability of network packet loss;
Check the network card numa location:
ethtool -i eth1|grep bus-info
lspci -s bus-info -vv|grep node
The masks in the above interrupt and RPS settings need to be reset according to the numa CPU allocation;
5. You can try to enable interrupt aggregation (see if the network card supports it)
Check :
ethtool -c ethx
Coalesce parameters for eth1:
Adaptive RX: on  TX: on
stats-block-usecs: 0
sample-interval: 0
pkt-rate-low: 0
pkt-rate-high: 0


rx-usecs: 25
rx-frames: 0
rx-usecs-irq: 0
rx-frames-irq: 256


tx-usecs: 25
tx-frames: 0
tx-usecs-irq: 0
tx-frames-irq: 256


rx-usecs-low: 0
rx-frame-low: 0
tx-usecs-low: 0
tx-frame-low: 0


rx-usecs-high: 0
rx-frame-high: 0
tx-usecs-high: 0
tx-frame-high: 0
Adjustment:
ethtool -C ethx adaptive-rx onBriefly summarize the network card driver network packet loss processing:
2.3 Kernel protocol stack packet loss
2.3.1 Ethernet link layer packet loss
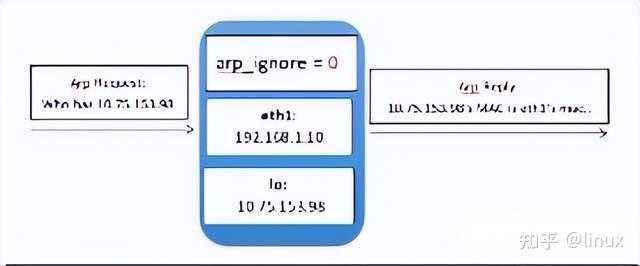
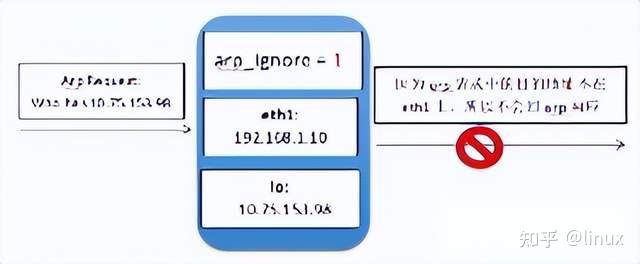
The function of the arp_ignore parameter is to control whether the system should return an arp response when receiving an external arp request. The commonly used values of the arp_ignore parameter are 0, 1, 2, and 3~8 are rarely used;
View: sysctl -a | grep arp_ignore

Solution : Set the corresponding value according to the actual scenario;
0: Respond to ARP requests for the local IP address received on any network card (including the address on the loopback network card), regardless of whether the destination IP is on the receiving network card.
1: Only respond to ARP requests whose destination IP address is the local address on the receiving network card.
2: Only respond to arp requests whose destination IP address is the local address on the receiving network card, and the source IP of the arp request must be in the same network segment as the receiving network card.
3: If the local address corresponding to the IP address requested by the ARP request packet has a scope of host, the ARP response packet will not be responded to. If the scope is global or link, the ARP response packet will be responded to.
2.3.2 arp_filter configuration packet loss
In a multi-interface system (such as Tencent Cloud’s elastic network card scenario), these interfaces can respond to ARP requests, causing the peer to learn different MAC addresses. Subsequent message sending may result in packet loss due to the difference between the MAC address and the MAC address of the receiving interface. arp_filter is mainly used to adapt to this scenario.
Check:
sysctl -a | grep arp_filter
Solution:
Set the corresponding value according to the actual scenario. Generally, the default is to turn off this filtering rule, which can be turned on in special cases;
0: Default value, indicating that the interface status is not checked when responding to arp requests;
1: Indicates that when responding to arp requests, it will check whether the interface is consistent with the receiving request interface, and will not respond if it is inconsistent;
2.3.3 ARP table full leads to packet loss
For example, in the following situation, because the number of burst ARP entries exceeds the default configuration of the protocol stack, some ARP creation fails when sending packets, resulting in sending failure and packet loss:
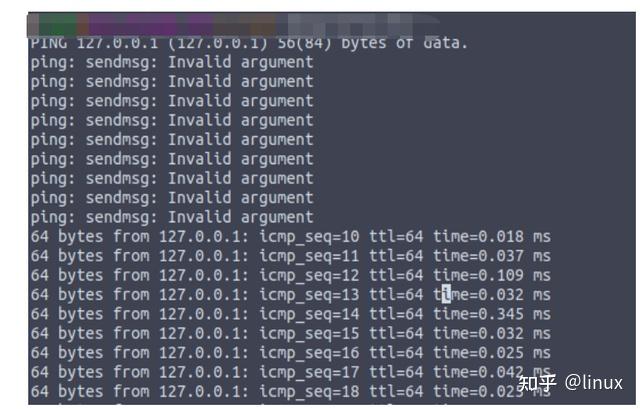
Check:
- Check the arp status: cat /proc/net/stat/arp_cache, table_fulls statistics:
- View dmesg messages (kernel print):

dmesg|grep neighbour
neighbour: arp_cache: neighbor table overflow!- View the current arp table size: ip n|wc -l
View system quotas:
sysctl -a |grep net.ipv4.neigh.default.gc_thresh
gc_thresh1: Minimum number of levels in the ARP cache. If there are fewer than this number, the garbage collector will not run. The default value is 128.

gc_thresh2: Soft limit on the maximum number of records stored in the ARP cache. The garbage collector allows the number of records to exceed this number for 5 seconds before starting to collect. The default value is 512.
gc_thresh3: Hard limit on the maximum number of records stored in the ARP cache. Once the number in the cache exceeds this, the garbage collector will run immediately. The default value is 1024.
Generally, if there is enough memory, the gc_thresh3 value can be considered as the total size of the arp table;

Solution : Adjust the ARP table size according to the actual ARP maximum value (such as the maximum number of other sub-machines accessed).
$ sudo sysctl -w net.ipv4.neigh.default.gc_thresh1=1024
$ sudo sysctl -w net.ipv4.neigh.default.gc_thresh2=2048
$ sudo sysctl -w net.ipv4.neigh.default.gc_thresh3=4096
$ sudo sysctl  -p
2.3.4 ARP request cache queue overflows and packet loss
Check:
cat /proc/net/stat/arp_cache ,unresolved_discards是否有新增计数Solution: Adjust the cache queue size unres_qlen_bytes according to customer needs:

2.4 Packet loss at the network IP layer
2.4.1 Interface IP address configuration packet loss
1. The local service is unavailable. Check whether the lo interface is configured with the address 127.0.0.1.
2. The local machine fails to receive packets. Check the local routing table: ip r show table local | grep the IP address of the slave machine. This packet loss usually occurs in multi-IP scenarios. The sub-machine fails to configure multiple IPs at the bottom layer, resulting in the corresponding IP not receiving packets and packet loss.

Solution:
1. Configure the correct interface IP address; for example, ip a add 1.1.1.1 dev eth0
2. If you find that the interface has an address but still loses packets, it may be that the local routing table does not have a corresponding entry. In an emergency, you can manually add it:
For example, ip r add local local ip address dev eth0 table local;
2.5 Routing packet loss
2.5.1 Routing configuration packet loss
Check:
1. Check whether the configured route is set correctly (whether it is reachable) and whether policy routing is configured (this configuration will appear in the elastic network card scenario) ip rule:

Then find the corresponding routing table. View the routing table:

Or you can directly use ip r get xxxx to let the system help you find out whether there is a reachable route and whether the interface meets expectations;
2. View system statistics:
netstat -s|grep "dropped because of missing route"Solution: Reconfigure the correct route;
2.5.2 Reverse routing filtering packet loss
The reverse routing filtering mechanism is that Linux checks whether the source IP of the received data packet is routable (Loose mode) or the best route (Strict mode) through reverse routing query. If it fails the verification, the data packet is discarded. The purpose of the design is to prevent IP address spoofing attacks.
Check:
rp_filter provides three modes for configuration:
0 – No verification
1 – Strict mode defined in RFC3704: For each received data packet, query the reverse route. If the data packet entry and reverse route exit are inconsistent, it will not pass.
2 – Loose mode defined in RFC3704: For each received packet, query the reverse route. If any interface is unreachable, do not pass it.
View the current rp_filter policy configuration:
$cat /proc/sys/net/ipv4/conf/eth0/rp_filter
If this is set to 1, you need to check whether the host’s network environment and routing policy may cause the client’s incoming packets to fail reverse routing verification.
In principle, this mechanism works at the network layer. Therefore, if the client can ping the server, this factor can be ruled out.
Solution:
Set rp_filter to 0 or 2 according to the actual network environment:
$ sysctl -w net.ipv4.conf.all.rp_filter=2 or $ sysctl -w net.ipv4.conf.eth0.rp_filter=22.6 Firewall packet loss
2.6.1 Packet loss caused by customer-set rules
Check:
iptables -nvL |grep DROP ;Solution: Modify the firewall rules;
2.6.2 Connection tracking causes packet loss
2.6.2.1 Connection tracking table overflow packet loss
The kernel uses the ip_conntrack module to record the status of iptables network packets and saves each record in the table (this table is in memory, and the total number of records currently recorded can be viewed through /proc/net/ip_conntrack). If the network is busy, such as high connections, high concurrent connections, etc., the available space of the table will be gradually occupied. Generally, this table is large and not easy to be full, and it can be cleaned up by itself. The records in the table will stay in the table and take up space until the source IP sends a RST packet. However, if there is an attack, wrong network configuration, problematic routing/router, problematic network card, etc., the RST packet sent by the source IP will not be received, so it will accumulate in the table, and the more it accumulates, the more it accumulates until it is full. No matter which situation causes the table to become full, packets will be dropped when it is full, and the external server cannot be connected. The kernel will report the following error message: kernel: ip_conntrack: table full, dropping packet;
View the current number of connection tracking:
cat /proc/sys/net/netfilter/nf_conntrack_maxSolution:
Increase the maximum number of traces
net.netfilter.nf_conntrack_max = 3276800
Reduce the maximum effective time of the trace connection
net.netfilter.nf_conntrack_tcp_timeout_established = 1200
net.netfilter.nf_conntrack_udp_timeout_stream = 180
net.netfilter.nf_conntrack_icmp_timeout = 30
2.6.2.2 ct creates conflict and causes network packet loss
View: Current connection tracking statistics: cat
/proc/net/stat/nf_conntrack, you can check various ct abnormal packet loss statistics
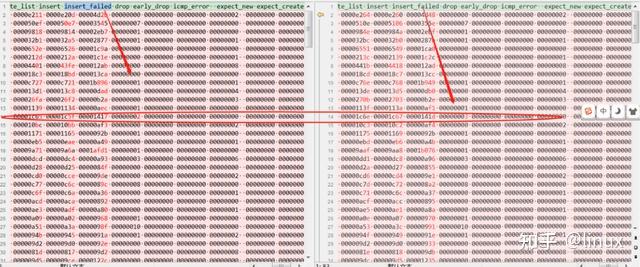
Solution: fix the kernel hot patch or update the kernel version (merge the patch modification);
2.7 Transport layer UDP/TCP network packet loss
2.7.1 TCP connection tracking security check network packet loss
Packet loss reason: The connection is not disconnected, but the server or client has previously sent packets abnormally (the message has not been updated through the connection tracking module to update the window count), and the legal window range has not been updated, resulting in subsequent packet security checks being lost; the protocol stack uses
nf_conntrack_tcp_be_liberal to control this option:
1: Close, only the RST packets that are not in the TCP window are marked as invalid;
0: Enabled; all packets not in the TCP window are marked as invalid;
Check:
View the configuration:
sysctl -a|grep nf_conntrack_tcp_be_liberal
net.netfilter.nf_conntrack_tcp_be_liberal = 1
View the log:
Normally, the netfiler module does not load the log by default and needs to be loaded manually;
modprobe ipt_LOG11
sysctl -w net.netfilter.nf_log.2=ipt_LOG
Then check syslog after sending the package;
Solution: Determine whether this mechanism is causing packet loss based on actual packet capture and analysis. You can try disabling it.
2.7.2 Fragmentation and reassembly packet loss
Situation Summary: Timeout
Check:
netstat -s|grep timeout
601 fragments dropped after timeout
Solution: Adjust the timeout period
net.ipv4.ipfrag_time = 30
sysctl -w net.ipv4.ipfrag_time=60
2.7.3 frag_high_thresh, if the memory of a fragment exceeds a certain threshold, the system security check will cause packet loss
Check:
netstat -s|grep reassembles
8094 packet reassembles failed
Solution: Resize
net.ipv4.ipfrag_high_thresh
net.ipv4.ipfrag_low_thresh
2.7.4 Fragment safety distance check to avoid packet loss
Check:
netstat -s|grep reassembles
8094 packet reassembles failed
Solution: Set ipfrag_max_dist to 0 to disable this security check.
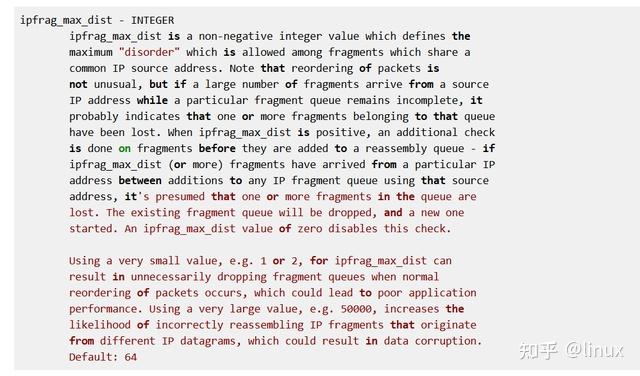
The pfrag_max_dist feature is not applicable in some scenarios:
1. There is a large amount of network message interaction
2. The concurrency of the sender is very high, and the SMP architecture makes it easy to cause this disorder;
The shard hash bucket conflict chain is too long and exceeds the system default value of 128
Check:
dmesg|grep “Dropping fragment”
inet_frag_find: Fragment hash bucket 128 list length grew over limit. Dropping fragment.
Solution: Hot patch to adjust hash size;
Insufficient system memory, failed to create new shard queue
View method:
netstat -s|grep reassembles
8094 packet reassembles failed
Dropwatch checks the packet loss location:
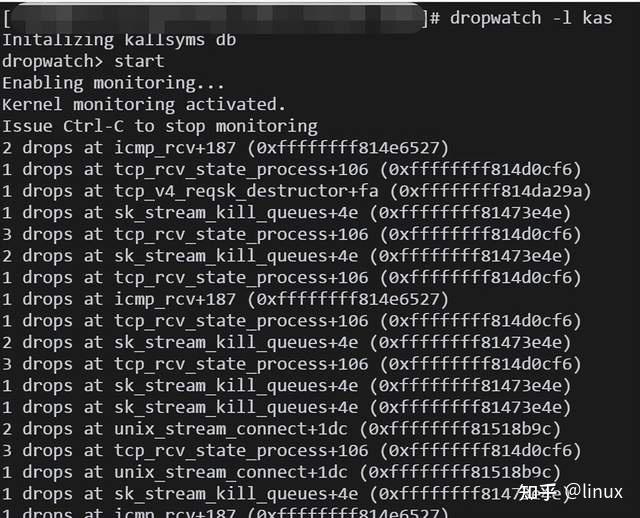
Solution:
a. Increase system network memory:
net.core.rmem_default
net.core.rmem_max
net.core.wmem_default
b. System reclaims memory:
In an emergency, you can use /proc/sys/vm/drop_caches to release virtual memory;
To free pagecache:
# echo 1 > /proc/sys/vm/drop_caches
To free dentries and inodes:
# echo 2 > /proc/sys/vm/drop_caches
To free pagecache, dentries and inodes:
echo 3 > /proc/sys/vm/drop_caches
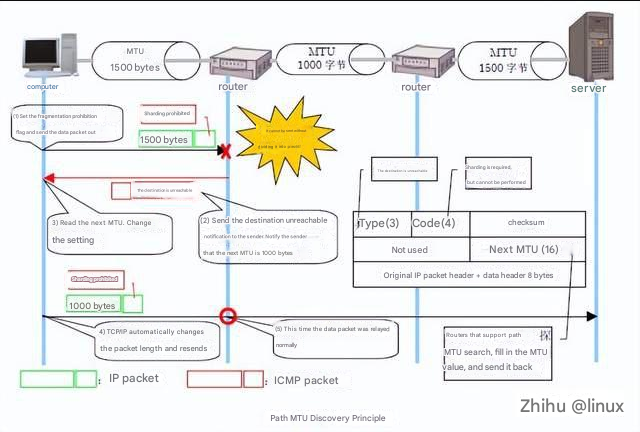
2.8 MTU packet loss
Check:
1. Check the interface MTU configuration, ifconfig eth1/eth0, the default is 1500;
2. Perform MTU detection and then set the MTU value corresponding to the interface;
Solution:
1. Set the correct MTU value according to the actual situation;
2. Set a reasonable TCP mss and enable TCP MTU Probe:
cat /proc/sys/net/ipv4/tcp_mtu_probing:
tcp_mtu_probing - INTEGER Controls TCP Packetization-Layer Path MTU Discovery.
Takes three values:
0 - Disabled
1 - Disabled by default, enabled when an ICMP black hole detected
2 - Always enabled, use initial MSS of tcp_base_mss.
2.9 TCP layer packet loss
2.9.1 Too many TIME_WAIT packets are lost
A large number of TIMEWAITs appear and need to be resolved on a TCP server with high concurrency and short connections. After the server processes the request, it immediately closes the connection normally. In this scenario, a large number of sockets will be in the TIMEWAIT state. If the client’s concurrency continues to be high, some clients will show that they cannot connect.
Check:
View the system log:
dmsg
TCP: time wait bucket table overflow;
View system configuration:
sysctl -a|grep tcp_max_tw_buckets
net.ipv4.tcp_max_tw_buckets = 16384
Solution:
1. tw_reuse and tw_recycle only work when timestamps are enabled on the client and server (enabled by default)
2. tw_reuse only works on the client. After it is turned on, the client will recycle within 1 second.
3. tw_recycle works on both the client and the server. After it is turned on, it will be recycled within 3.5*RTO. The specific time of RTO is 200ms~120s, depending on the network conditions. The intranet condition is slightly faster than tw_reuse, and the public network, especially the mobile network, is mostly slower than tw_reuse. The advantage is that it can recycle the number of TIME_WAIT on the server;
On the server side, if the network path passes through a NAT node, do not enable net.ipv4.tcp_tw_recycle, which will cause timestamp confusion and other packet loss issues.
4. Adjust the size of tcp_max_tw_buckets if the memory is sufficient:
sysctl -w net.ipv4.tcp_max_tw_buckets=163840;2.9.2 Abnormal timestamp packet loss
When multiple clients are in the same NAT environment and access the server at the same time, the times of different clients may be inconsistent. When the server receives requests sent by the same NAT, the timestamp will be disordered, so the subsequent data packets will be discarded. The specific manifestation is usually that the client clearly sends SYN, but the server does not respond to ACK. The following command can be used on the server to confirm whether the data packets are constantly discarded.
examine:
netstat -s | grep rejectsSolution:
If the network path passes through a NAT node, do not enable net.ipv4.tcp_tw_recycle;
2.9.3 TCP queue issues causing packet loss
principle:
TCP state machine (three-way handshake)

Protocol processing:
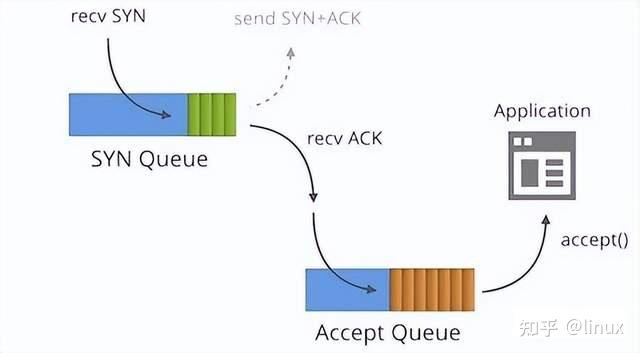
One is a semi-connection queue (syn queue):
In the three-way handshake protocol, the server maintains a semi-connected queue, which opens an entry for each client’s SYN packet (the server has created a request_sock structure when receiving the SYN packet and stored it in the semi-connected queue). This entry indicates that the server has received the SYN packet and sent a confirmation to the client, and is waiting for the client’s confirmation packet (a second handshake will be performed to send a SYN+ACK packet for confirmation). The connections identified by these entries are in the Syn_RECV state on the server. When the server receives the client’s confirmation packet, the entry is deleted and the server enters the ESTABLISHED state. This queue is a SYN queue with a length of max(64,
/proc/sys/net/ipv4/tcp_max_syn_backlog). The machine’s tcp_max_syn_backlog value is configured under /proc/sys/net/ipv4/tcp_max_syn_backlog;
One is the full connection queue (accept queue):
During the third handshake, after the server receives the ACK message, it will enter a new queue called accept. The length of the queue is min(backlog, somaxconn). By default, the value of somaxconn is 128, which means that there are at most 129 ESTAB connections waiting for accept(). The value of backlog should be specified by the second parameter in int listen(int sockfd, int backlog). The backlog in listen can be defined by our application.
Check:
Connection establishment failed, syn packet loss:
netstat -s |grep -i listen
SYNs to LISTEN sockets dropped
It will also be affected by full packet loss on the connection
Solution: Increase the size of tcp_max_syn_backlog
Connection full of packet loss
-xxx times the listen queue of a socket overflowed
Check:
- View the accept queue size: net.core.somaxconn
- ss -lnt queries the socket queue: LISTEN status: Recv-Q indicates the listen backlog value currently waiting for the server to call accept to complete the three-way handshake. That is, when the client connects to the server that is listening() through connect(), these connections will remain in this queue until they are accepted() by the server; Send-Q indicates the maximum listen backlog value, which is the value of min(backlog, somaxconn) mentioned above.
- Check if it is restricted by the application, int listen(int sockfd, int backlog);
Solution:
- Linux kernel parameters are optimized to relieve pressure, tcp_abort_on_overflow=1
- Adjust the net.core.somaxconn size;
- Application setting issues, notify customers of program modifications;
2.9.4 syn flood attack packet loss
At present, Linux will resend SYN-ACK packets 5 times by default. The retry interval starts from 1s. The next retry interval is double the previous one. The 5 retry intervals are 1s, 2s, 4s, 8s, and 16s, a total of 31s. After the 5th retry, it takes another 32s to know that the 5th time has also timed out. Therefore, it takes a total of 1s + 2s + 4s + 8s + 16s + 32s = 63s for TCP to disconnect the connection. Since the SYN timeout takes 63 seconds, it gives the attacker an opportunity to attack the server. The attacker sends a large number of SYN packets to the server in a short period of time (commonly known as SYN flood attack) to exhaust the server’s SYN queue. To deal with the problem of too many SYNs;
Check: Check syslog: kernel: [3649830.269068] TCP: Possible SYN flooding on port xxx. Sending cookies. Check SNMP counters.
Solution:
- Increase tcp_max_syn_backlog
- Reduce tcp_synack_retries
- Enable tcp_syncookies
- Enable tcp_abort_on_overflow, and change tcp_abort_on_overflow to 1. 1 means that if the full connection queue is full in the third step, the server sends a reset packet to the client, indicating that the handshake process and the connection have been aborted (the connection has not been established on the server).
2.9.5 PAWS mechanism packet loss
Principle: PAWS (Protect Against Wrapped Sequence numbers). Under high bandwidth, TCP sequence numbers may be reused (recycled/wrapped) in a short period of time,
which may cause two legitimate data packets and their confirmation packets with the same sequence number to appear in the same TCP flow in a short period of time.
Check:
$netstat -s |grep -e "passive connections rejected because of time
stamp" -e "packets rejects in established connections because of
timestamp”
387158 passive connections rejected because of time stamp
825313 packets rejects in established connections because of timestamp
Use sysctl to check whether tcp_tw_recycle and tcp_timestamp are enabled:
$ sysctl net.ipv4.tcp_tw_recycle
net.ipv4.tcp_tw_recycle = 1
$ sysctl net.ipv4.tcp_timestamps
net.ipv4.tcp_timestamps = 1
1. tcp_tw_recycle parameter. It is used to quickly recycle TIME_WAIT connections, but it will cause problems in a NAT environment;
2. When multiple clients are connected to the Internet through NAT and interact with the server, the server sees the same IP, which means that these clients are actually equivalent to one client. Unfortunately, the timestamps of these clients may be different, so from the perspective of the server, the timestamp may be disordered, which directly causes the data packets with small timestamps to be discarded. If this problem occurs, the specific manifestation is usually that the client clearly sends SYN, but the server does not respond to ACK.
Solution:
In a NAT environment, clear the TCP timestamp option or disable the tcp_tw_recycle parameter;
2.9.6 TLP problem packet loss
TLP is mainly used to solve the problem of tail packet retransmission efficiency. TLP can effectively avoid long RTO timeouts and thus improve TCP performance. For details, please refer to the article:
http://perthcharles.github.io/ 2015 /10/31/wiki-network-tcp-tlp/;
However, in low-latency scenarios (short connections and small packets), the combination of TLP and delayed ACK may cause invalid retransmissions, causing the client to detect a large number of false retransmission packets, increasing the response delay;
Check:
View protocol stack statistics:
netstat -s |grep TCPLossProbesView system configuration:
sysctl -a | grep tcp_early_retrans
Solution:
1. Turn off delayed ack and turn on fast ack;
2. The nodelay semantics implemented in Linux is not a fast ack, but just turns off the Nagle algorithm;
3. Turn on the quick ack option. There is a TCP_QUICKACK option in the socket, which needs to be set again after each recv.
2.9.7 Insufficient memory causes packet loss
Check:
View the log:
dmesg|grep “out of memory”View system configuration:
cat /proc/sys/net/ipv4/tcp_mem
cat /proc/sys/net/ipv4/tcp_rmem
cat /proc/sys/net/ipv4/tcp_wmem
Solution:
Adjust system parameters according to the concurrent traffic of TCP services. Generally, try to increase it by 2 times or other multiples to see if the problem is alleviated.
sysclt -w net.ipv4.tcp_mem=
sysclt -w net.ipv4.tcp_wmem=
sysclt -w net.ipv4.tcp_rmem=
sysctl -p
2.9.8 TCP timeout packet loss
Check:
Capture packets and analyze network RTT:
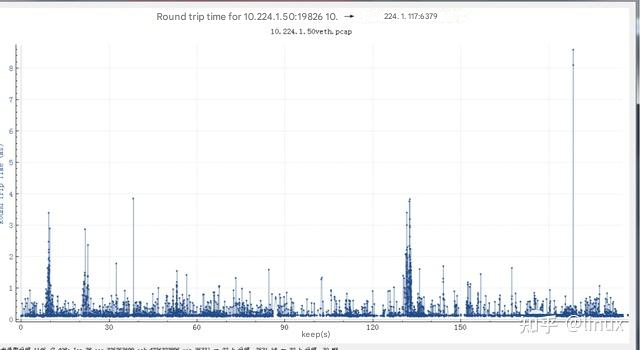
Use other tools to test the current end-to-end network quality (hping, etc.);
# hping -S 9.199.10.104 -A
HPING 9.199.10.104 (bond1 9.199.10.104): SA set, 40 headers + 0 data bytes
len=46 ip=9.199.10.104 ttl=53 DF id=47617 sport=0 flags=R seq=0 win=0 rtt=38.3 ms
len=46 ip=9.199.10.104 ttl=53 DF id=47658 sport=0 flags=R seq=1 win=0 rtt=38.3 ms
len=46 ip=9.199.10.104 ttl=53 DF id=47739 sport=0 flags=R seq=2 win=0 rtt=30.4 ms
len=46 ip=9.199.10.104 ttl=53 DF id=47842 sport=0 flags=R seq=3 win=0 rtt=30.4 ms
len=46 ip=9.199.10.104 ttl=53 DF id=48485 sport=0 flags=R seq=4 win=0 rtt=38.7 ms
len=46 ip=9.199.10.104 ttl=53 DF id=49274 sport=0 flags=R seq=5 win=0 rtt=34.1 ms
len=46 ip=9.199.10.104 ttl=53 DF id=49491 sport=0 flags=R seq=6 win=0 rtt=30.3 ms
Solution:
- Disable Nagle algorithm to reduce small packet delay;
- Disable delayed ack:
sysctl -w net.ipv4.tcp_no_delay_ack=12.9.9 TCP out-of-order packet loss
At this time, TCP will not be able to determine whether the data packet is lost or out of order, because both packet loss and out of order will cause the receiver to receive out-of-order data packets, resulting in data holes at the receiver. TCP will temporarily define this situation as out of order data packets, because out of order is a time issue (it may be the late arrival of data packets), and packet loss means retransmission. When TCP realizes that the packet is out of order, it will immediately ACK. The TSEV value contained in the TSER part of the ACK will record the moment when the current receiver receives the ordered segment. This will increase the RTT sample value of the data packet, further leading to an extension of the RTO time. This is undoubtedly beneficial to TCP, because TCP has sufficient time to determine whether the data packet is out of order or lost to prevent unnecessary data retransmission. Of course, severe out of order will make the sender think that it is a packet loss. Once the repeated ACK exceeds the TCP threshold, it will trigger the timeout retransmission mechanism to solve this problem in time;
Check: Capture packets and analyze whether there are many out-of-order messages:

Solution: If the multipath transmission scenario or the network quality is poor, you can modify the following values to increase the system’s tolerance for TCP out-of-order transmission:

2.9.10 Congestion Control network Packet Loss
In the process of Internet development, TCP algorithm has also undergone certain changes and has evolved into
Reno, NewReno, Cubic and Vegas, these improved algorithms can be roughly divided into packet loss-based and delay-based congestion control algorithms. Reno and NewReno are the representatives of packet loss-based congestion control algorithms. Its main problems are buffer bloat and long fat pipes. The congestion control mechanism of the protocol based on packet loss is passive, and it makes network congestion judgments based on packet loss events in the network. Even if the load in the network is very high, as long as there is no congestion and packet loss, the protocol will not actively reduce its sending speed. Initially, the buffer of the router forwarding export was relatively small, and TCP was prone to global synchronization when using it, reducing bandwidth utilization. Later, router manufacturers continued to increase buffers due to the reduction of hardware costs. The protocol based on packet loss feedback continued to occupy the router buffer without packet loss. Although it improved the utilization of network bandwidth, it also meant that after congestion and packet loss, the network jitter increased. In addition, for the problem of long fat pipes with high bandwidth and RTT, there is a high possibility of random packet loss in the pipe. The default buffer setting of TCP is relatively small, and the cwnd caused by random packet loss often folds down, resulting in low bandwidth utilization. BBR (Bottleneck Bandwidth and Round-trip propagation time) is a congestion control algorithm based on bandwidth and delay feedback. It has evolved to the second version and is a typical closed feedback system. The number of packets sent and the speed at which these packets are sent are constantly adjusted in each feedback. Before BBR was proposed, congestion control was an event-based algorithm that needed to be driven by packet loss or delay events. After BBR was proposed, congestion control was an autonomous automatic control algorithm based on feedback. The control of the rate was determined by the algorithm, not by network events. The core of the BBR algorithm is to find the two parameters of maximum bandwidth (Max BW) and minimum delay (Min RTT). The product of maximum bandwidth and minimum delay can get BDP (Bandwidth Delay Product), and BDP is the maximum capacity that can store data in the network link. BDP drives the Probing State Machine to obtain Rate quantum and cwnd, and sets them in the sending engine respectively to solve the problems of sending speed and data volume.
The Linux 4.9 kernel first adopted the first version of the BBR congestion control algorithm. BBR has stronger anti-packet loss capabilities than other algorithms, but this version has problems (disadvantages) in some scenarios. BBR has problems in the field of real-time audio and video, and its deep queue cannot compete with Cubic.
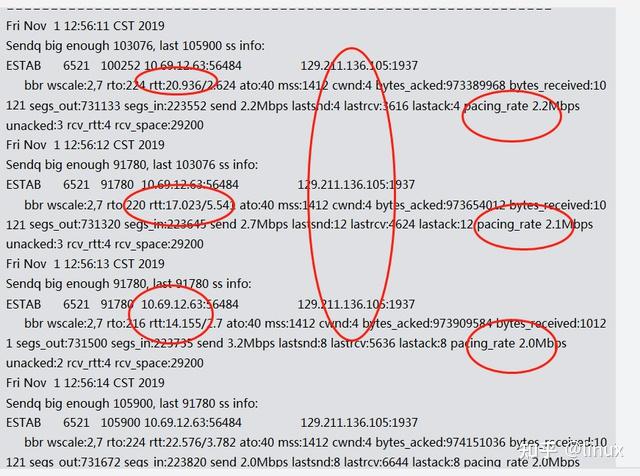
The problem phenomenon is: in the deep queue scenario, BBR only sends 4 packets in the ProbeRTT phase. If the sending rate drops too much, it will cause increased latency and lag problems.
Check:
ss -sti // On the source side ss -sti|grep 10.125.42.49:47699 -A 3 (10.125.42.49:47699 is the destination address and port number)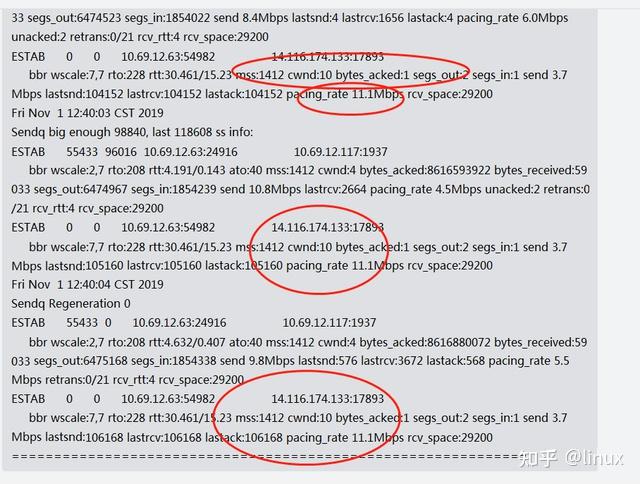
Solution:
- ProbeRTT is not suitable for real-time audio and video, so you can choose to remove it directly, or shorten the probe RTT to 2.5s like BBRV2 and use 0.5xBDP to send.
- If there is no special requirement, switch to the stable cubic algorithm;
2.10 UDP layer packet loss
2.10.1 Packet receiving and sending failures and network packet loss
View: netstat statistics
If there are continuous receive buffer errors/send buffer errors counts;

Solution:
- CPU load (multi-core binding configuration), network load (soft interrupt optimization, adjusting the driver queue netdev_max_backlog), memory configuration (protocol stack memory);
- According to the peak value, increase the buffer size:
net.ipv4.udp_mem = xxx
net.ipv4.udp_rmem_min = xxx
net.ipv4.udp_wmem_min = xxx
3. Adjust application design:
- UDP itself is a connectionless and unreliable protocol. It is suitable for scenarios where occasional message loss does not affect the program status, such as video, audio, games, monitoring, etc. Applications that require high message reliability should not use UDP. It is recommended to use TCP directly. Of course, you can also do retries and deduplication at the application layer to ensure reliability.
- If you find that the server is losing packets, first check whether the system load is too high through monitoring. Try to reduce the load first and then see if the packet loss problem disappears.
- If the system load is too high, there is no effective solution for UDP packet loss. If the CPU, memory, and IO are too high due to application anomalies, please locate the abnormal application and repair it in time; if there are insufficient resources, monitoring should be able to detect it in time and quickly expand capacity.
- For systems that receive or send a large number of UDP packets, the probability of packet loss can be reduced by adjusting the socket buffer size of the system and program.
- When processing UDP messages, the application should use asynchronous mode and not have too much processing logic between receiving two messages.
2.11 Application layer socket network packet loss
2.11.1 Socket buffer receiving network packet loss
Check:
1. Capture packets and analyze whether there is network packet loss;
2. View statistics:
netstat -s|grep "packet receive errors"Solution:
Adjust the socket buffer size:
Socket configuration (all protocol sockets):
# Default Socket Receive Buffer
net.core.rmem_default = 31457280
# Maximum Socket Receive Buffer
net.core.rmem_max = 67108864
Specific resizing principle:
There is no optimal setting for the buffer size, because the optimal size varies from situation to situation.
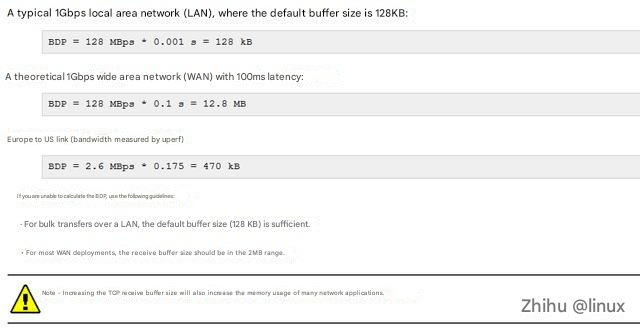
Buffer estimation principle: In data communications, the bandwidth-delay product (BDP) is the product of the capacity of a data link (in bits per second) and the round-trip communication delay (in seconds). [1][2] The result is a total amount of data in bits (or bytes), which is equal to the maximum amount of data that can be sent but not yet acknowledged on the network line at any given time.
BDP = Bandwidth * RTT
You can estimate the BDP, or buffer size, by calculating the bandwidth of the nodes on the ground and the statistical average latency. You can refer to the following common scenarios for estimation:
2.11.2 Application settings TCP connection number size packet loss
Check:
Please refer to the above TCP connection queue analysis;
Solution:
Set a reasonable connection queue size. During the third handshake, after the server receives the ACK message, it will enter a new queue called accept. The length of the queue is min(backlog, somaxconn). By default, the value of somaxconn is 128, which means that there are at most 129 ESTAB connections waiting for accept(). The value of backlog should be specified by the second parameter in int listen(int sockfd, int backlog). The backlog in listen can be defined by our application.
The application sends packets too quickly, causing network packet loss
View statistics:
netstat -s|grep "send buffer errorsSolution:
- ICMP/UDP has no flow control mechanism, so the application needs to design a reasonable sending method and speed, taking into account the underlying buff size, CPU load, and network bandwidth quality;
- Set a reasonable sock buffer size:
setsockopt(s,SOL_SOCKET,SO_SNDBUF, i(const char*)&nSendBuf,sizeof(int));- Adjust the system socket buffer size:
# Default Socket Send Buffer
   net.core.wmem_default = 31457280
   # Maximum Socket Send Buffer
   net.core.wmem_max = 33554432
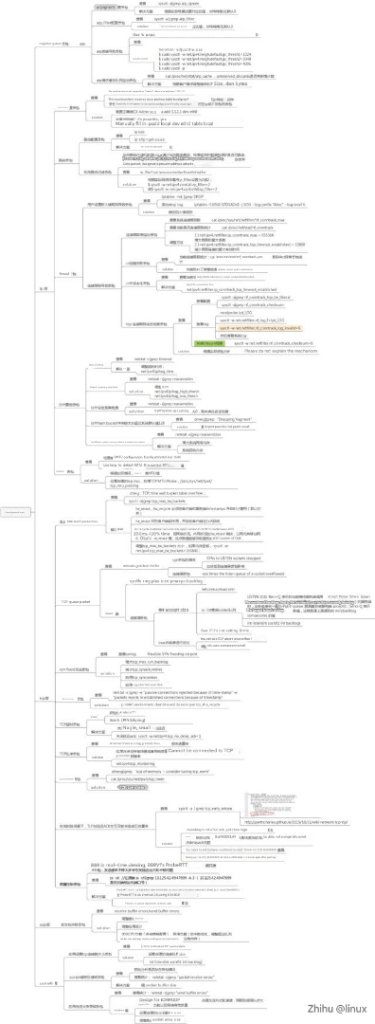
Appendix: A brief summary of kernel protocol stack packet loss:
3. Related tools introduction
3.1 Dropwatch tool
Principle: Monitor the kfree_skb function or event (this function is called when a network packet is discarded), and then print the corresponding call stack; if you want to know in detail which function the Linux system executes when the packet is lost, you can use the dropwatch tool, which monitors the system packet loss information and prints the function where the packet loss occurs:

3.2 tcpdump tool
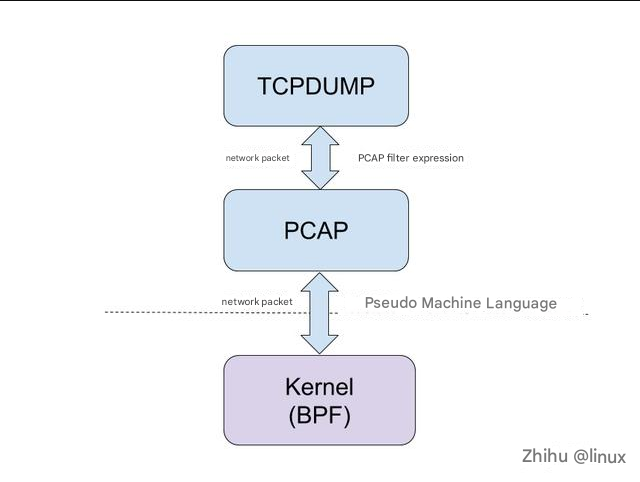
Principle: tcpdump is a powerful network packet capture tool under Unix, which allows users to intercept and display TCP/IP and other data packets sent or received through the network connected to the computer
Packet capture command reference:
https://www.tcpdump.org/manpages/tcpdump.1.html
Packet Analysis:
1. Use wireshark tool for analysis reference: Wireshark packet analysis practice.pdf
2. It can convert and generate CSV data, and use Excel or shell to analyze messages in specific scenarios;
3. You can use the tshark command line tool for analysis on Linux:
https://www.wireshark.org/docs/man-pages/tshark.html
4. Summarize
This article only analyzes most of the nodes that may experience network packet loss, and provides single-node network packet loss troubleshooting and related solutions. Network packet loss problems involve various components of the network link, especially in the cloud network era. The network topology is complex and changeable, involving operator networks, IDC networks, dedicated lines and other underlay networks, border gateways, VPC networks, CLB load balancing and other cloud overlay networks. Troubleshooting various network packet loss problems is very complicated and difficult, but after mastering the basic principles of network communication, you can decompose the network topology, check the communication nodes one by one, and find the location of network packet loss. In the future, we will introduce the cloud computing era, cloud network network packet loss troubleshooting methods, network architecture analysis, etc., so that any network packet loss problem can be quickly troubleshooted and located, helping customers quickly restore business. See you next time.


