Preface
Let’s continue with a practical example of TCP handshake issues. This data packet is still from Wireshark sharkfest 2017. It is another one of some short but interesting TCP trace files, or the last one. It can be said that these are all connection problems related to TCP handshake. Friends who are interested can send private messages and share the relevant data packets at that time.
Problem Information
The basic information of the packet trace file is as follows:
λ capinfos Sample03.pcapng
File name:           Sample03.pcapng
File type:           Wireshark/... - pcapng
File encapsulation:  Ethernet
File timestamp precision:  nanoseconds (9)
Packet size limit:   file hdr: (not set)
Packet size limit:   inferred: 58 bytes
Number of packets:   1102
File size:           116 kB
Data size:           956 kB
Capture duration:    69.469164000 seconds
First packet time:   2015-11-27 18:51:55.682798700
Last packet time:    2015-11-27 18:53:05.151962700
Data byte rate:      13 kBps
Data bit rate:       110 kbps
Average packet size: 867.71 bytes
Average packet rate: 15 packets/s
SHA256:              e0156ab381f1646742ff1400782334c8cfd78e64cdabd1368607806b61711df9
RIPEMD160:           eb423fa44c99618044fbadf6a2783eebcd03af44
SHA1:                d2b1059f35308520ba69e8cd29f3bcd7db998d8c
Strict time order:   True
Capture application: Sanitized by TraceWrangler v0.3.1 build 511
Number of interfaces in file: 1
Interface #0 info:
                     Name = eth0
                     Encapsulation = Ethernet (1 - ether)
                     Speed = 1000000000
                     Capture length = 65535
                     Time precision = nanoseconds (9)
                     Time ticks per second = 1000000000
                     Time resolution = 0x09
                     Number of stat entries = 0
                     Number of packets = 1102

λ
It is speculated that the captured packets were captured by Wireshark, snaplen truncated to 58 bytes, the number of packets captured was relatively large, 1102, the capture duration was 69.5 seconds, the average rate was 110 kbps, and they were processed by TraceWrangler anonymization software.
For an introduction to TraceWrangler anonymization software, you can check out the previous article
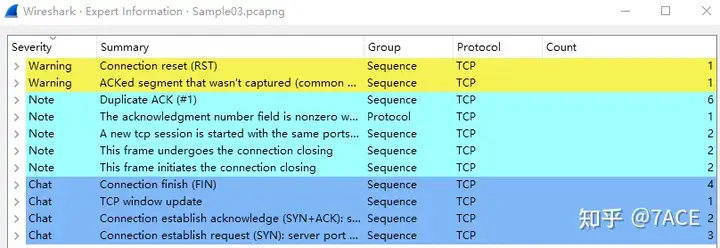
The expert information is as follows. Compared with the total number of data packets, there are very few warning messages, only 1 RST and 1 ACKed segment that wasn’t captured. It looks normal at first glance.

Problem Analysis
There are a large number of data packets, so they are not fully expanded. From tcp.streamthe output, we can see that there are a total of 3 TCP Streams.
λ tshark -r Sample03.pcapng -T fields -e tcp.stream | sort | uniq
0
1
2
There are three TCP streams between client 192.168.0.1 and server 10.10.10.1. TCP Stream 2 is a little strange, with only three packets. At the same time, the source port of client 192.168.0.1 in these three streams is 24426, which is a suspicious point.

TCP Stream 0
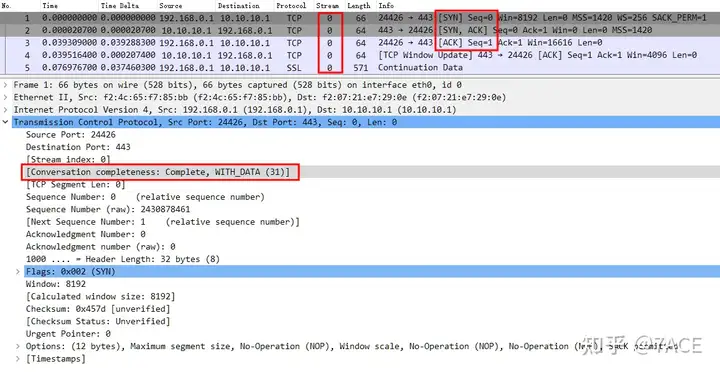
First, we start from TCP Stream 0. The entire traversal shows a complete TCP interactive session. Packet DetailsThe TCP session integrity information in is Conversation completeness:Complete,WITH_DATA(31), which means that the value of the tcp.completeness field is 31, as shown below:
- 1: SYN
- 2 : SYN-ACK
- 4 : ACK
- 8 : DATA
- 16: END
- 32 : RST
1 + 2 + 4 + 8 + 16 = 31 , which is the value of SYN + SYN-ACK + ACK + DATA + FIN , indicating that TCP Stream 0 is a complete TCP session with Data, from the TCP three-way handshake, to the intermediate data transmission, and to the final TCP four-way handshake.
For an introduction to TCP session integrity analysis and how to use the display filter expression for tcp.completeness, see the previous article
“Wireshark Tips and Tricks | TCP Session Integrity Analysis”

TCP Stream 1
After TCP Stream 0 waved four times, a problem occurred in TCP Stream 1 initiated by the client with the same source port 24426. The server 10.10.10.1 responded with a strange ACK prompt TCP ACKed unseen segmentmessage, and the client directly ended the connection with RST.

What happened? Let’s turn to the TCP detailed view to find out. The analysis is as follows:
- No.1040 – No.1043 are the four wave processes of TCP Stream 0;

2. After 16 seconds, TCP Stream 1 client No.1044 SYN is sent, and the server responds with an ACK=158049099. At first glance, it seems that Num 158049099 appears inexplicably, but it should be noted that Wireshark defaults to TCP relative sequence numbers, not absolute sequence numbers. TCP Relative sequence numbersThe information after turning off the option is as follows

The previous relative sequence number 158049099 is actually the difference between the absolute sequence number 2430890842 and 2272841743, but the real origin of this ACK Num 2430890842 is the continuation of Stream 0 .
Those who are familiar with TCP’s four waves should understand that in TCP Stream 0, No. 1040 is the first FIN sent by the server. After No. 1043, the server’s last ACK, the server’s connection will enter the TIME_WAIT state, that is, it will wait for 2MSL time before it is finally CLOSED. However, during this 2MSL time, the client happens to initiate a new connection with the same source port 24426. The server naturally matches the old connection information, so it replies with a data packet of ACK=2430890842. After receiving it, the client determines that it is an abnormal data packet outside the window and ends Stream 1 with a RST. Of course, this is for the client, and this RST actually ends the server’s TCP Stream 0 connection.
3. So after 25 seconds, the client continues to send TCP Stream 2 No.1047 SYN. Although it is still the same source port 24426, the server’s TCP Sream 0 connection has been closed and there is no relevant information. Therefore, TCP Stream 2 completes another normal three-way handshake process and continues to happily transmit data.

The time between No.1044 SYN and No.1043 is only 16.49s, which is still within the 2MSL time range. Although the time between No.1047 SYN and No.1043 is 42.45s, it still seems to be within the 2MSL time range. Why did it succeed this time? In fact, it is the result of the RST of No.1046.
RFC 793 stipulates that the MSL is 2 minutes. In actual applications, 30 seconds, 1 minute, and 2 minutes are commonly used. 2MSL means twice the MSL.

Summary of the problem
This article does not elaborate on the basic knowledge points of TCP TIME_WAIT and 2MSL. In actual environments, the TIME_WAIT state is still a very common phenomenon for servers, and there are many reasons for it. We will analyze it in detail later.


