

This article discusses some debugging techniques for Guomi SSL communication. Network communication development requires developers to be meticulous and patient, analyzing data step by step according to the protocol, a process that can be somewhat tedious. Especially with network packets, being off by just one byte can lead to parsing errors, necessitating byte-by-byte comparison. That’s when some debugging experience and skills become quite important.
Here, I’ll share some techniques I used while developing a browser product with Guomi support.
Stepping through code—could this really be called a debugging technique? You bet it can. I’ve found many developers prefer using the print method rather than step-by-step debugging, especially in embedded, mobile, and frontend development. How many people use Chrome and Firefox’s remote debugging tools for developing JavaScript in web pages?
Why is there reluctance to use step-by-step debugging? Mainly because configuring it can be somewhat troublesome. For embedded and mobile development, typically, you need to cross-compile (C/C++ development) on a development machine, download compiled binary programs to run on a device, and usually do not work with an IDE like in Windows development. If you wish to use gdb for debugging, it might also require using gdbserver, configuring communication between gdb and gdbserver, and setting up the path for the debugging symbols of the code.
However, once the step-by-step debugging environment is configured, it can significantly clarify the program execution flow and assist in debugging bugs. As the saying goes, to do a good job, one must sharpen one’s tools first. It’s definitely worth spending some time setting up the debugging environment.
On a Linux system, preparing this is actually quite simple, not involving cross-compilation or gdbserver, and just requires mastering a few gdb commands.
Next, using the GmSSL code as an example, I’ll explain how to step through the debugging process.
Developers involved in network communication must be familiar with packet capturing. Common software for capturing packets on a PC is Wireshark, and on Android systems, the tool is tcpdump. However, Guomi defines a very troublesome value for the SSL version number: 0x0101, and most software packages perceive values below 0x0300 as invalid version numbers, so using a standard version of Wireshark to capture Guomi SSL packets results in the following:
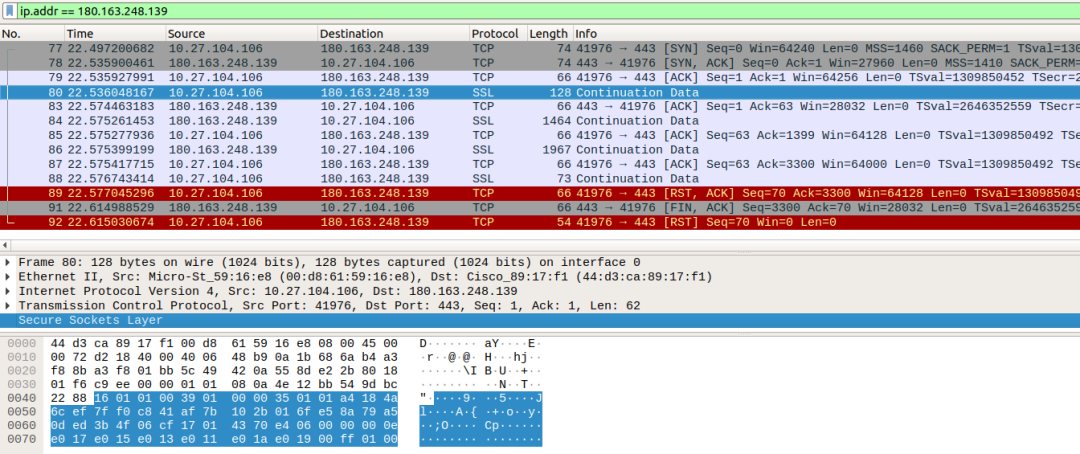
Standard version Wireshark packet capture
This makes analysis very inconvenient!
Fortunately, someone has added Guomi SSL support to Wireshark, resulting in the capture as follows:
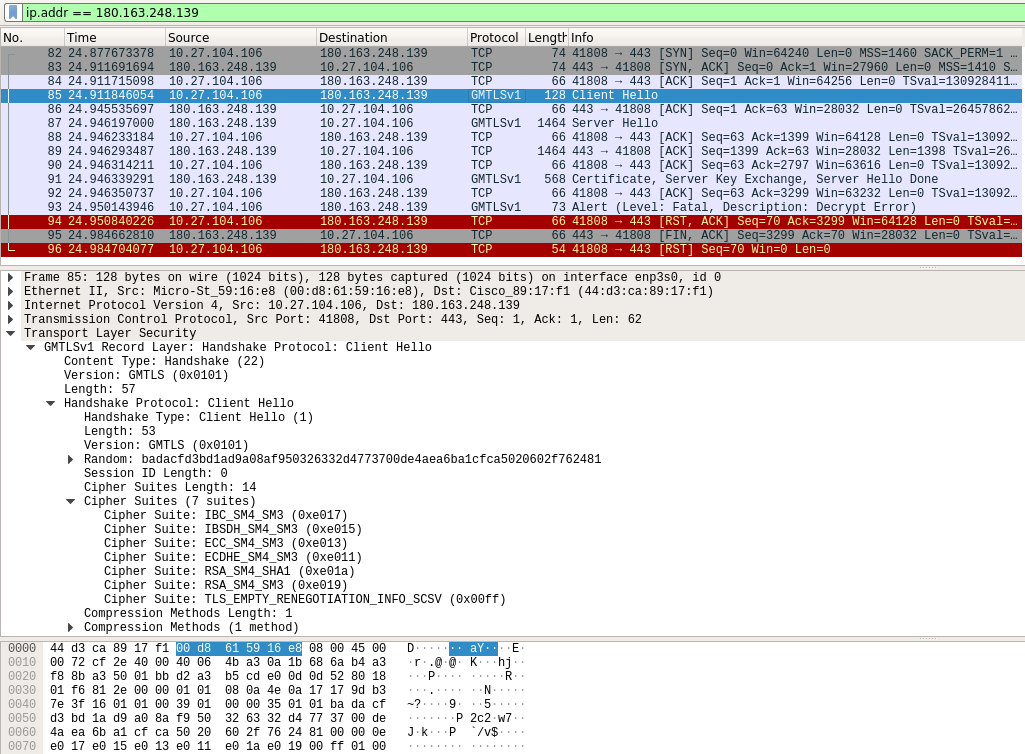
Wireshark with Guomi support packet capture
The project for Wireshark with Guomi support can be found at: https://github.com/pengtianabc/wireshark-gm
The project’s release contains a Windows installer, so Windows developers don’t have to spend much effort to install it.
Now, let’s talk about building Wireshark from source on an Ubuntu system and running it.
Network packet capturing is particularly useful for on-site debugging, especially when interfacing debugging with third parties. In Guomi SSL communication, the main task is debugging the process of establishing a Guomi SSL connection. During this process, what data is sent and received at each stage of connection establishment? With support for the Guomi SSL protocol, it becomes much clearer, otherwise, you’d have to manually analyze the data against the protocol step by step.
Alright, that’s it for the two debugging techniques for Guomi development. I hope this is helpful to you. Thank you!