Influenced by the mountains of Guizhou from a young age, I developed an honest and simple character. After years of diligent study, I was admitted to BIT. To fulfill my dream of becoming a teacher, I gave up jobs in IT and aerospace to become a university lecturer at Guizhou Finance and Economics University, with the desire to sincerely impart what I have learned and felt to my students and to help more strangers.
No matter what is transmitted over the network, ultimately, it is all sent as binary through physical media, similar to 0101 bitstreams. Plain text (strings) in Chinese usually uses UTF-8 encoding, while English typically uses ASCII encoding. Non-plain text such as audio, video, images, and compressed files are encapsulated in different encodings and converted into binary for transmission. In an IP network, by capturing packets with Wireshark, the original data obtained is all in binary.
Under what network conditions can packets be captured? Below is an explanation combined with network principles. Network packet capturing mainly exists in three situations: local environment, hub environment, and switch environment.
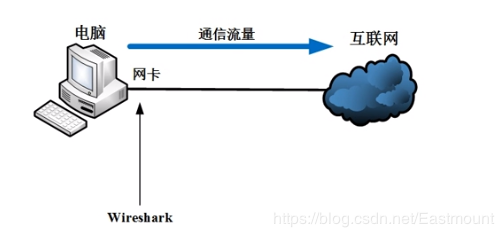
The local environment captures the traffic that enters and exits the local network card directly. Wireshark binds to our network card, allowing us to capture our network communication traffic without the need for third-party devices (like switches or routers), which is the most basic packet capturing method.
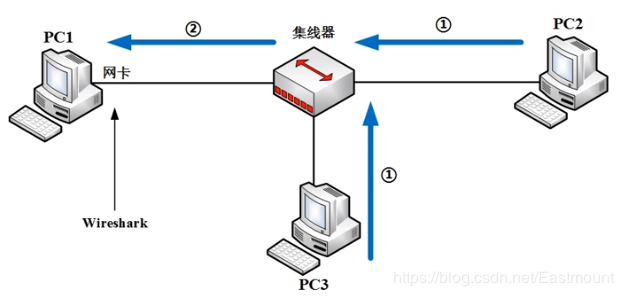
A hub environment can perform flood prevention in the same collision domain. The English word for hub is “Hub,” meaning “center.” The primary function of a hub is to regenerate, reshape, and amplify received signals to extend the network’s transmission distance while centralizing all nodes around it. It operates at the first layer of the OSI reference model, which is the “physical layer.”
Assuming three computers communicate, with Wireshark installed on PC1, when PC2 and PC3 send data packets to the hub network (collision domain or broadcast domain), since the hub is a physical layer product, it cannot recognize MAC addresses or IP addresses. It will flood the received packets to all other interfaces. At this time, Wireshark can capture the data packets sent from other computers connected to the same hub, a typical old networking method that is now largely obsolete.
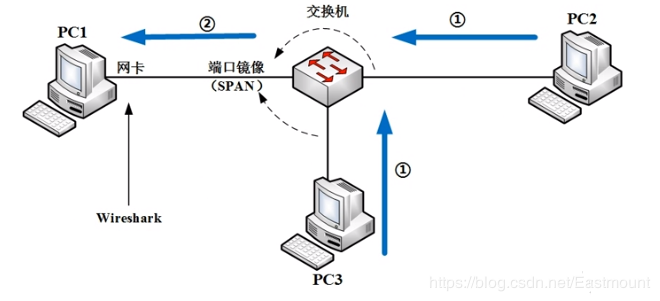
The switch environment is a more common method, including port mirroring, ARP spoofing, and MAC flooding.
A switch is a data link layer, or even a network layer product, with packet forwarding strictly according to the MAC address table on the switch. Therefore, under normal circumstances, the communication traffic between PC2 and PC3 is difficult to flow to PC1’s network card. When PC2 and PC3 communicate, PC1 cannot capture packets through Wireshark. However, we can perform SPAN port mirroring on the switch, which will duplicate traffic from the other two ports to PC1. PC1’s network card and Wireshark can be set to promiscuous mode, allowing for packet capturing. This mode is often used in many paid traffic analysis software.
(2) ARP Hijacking
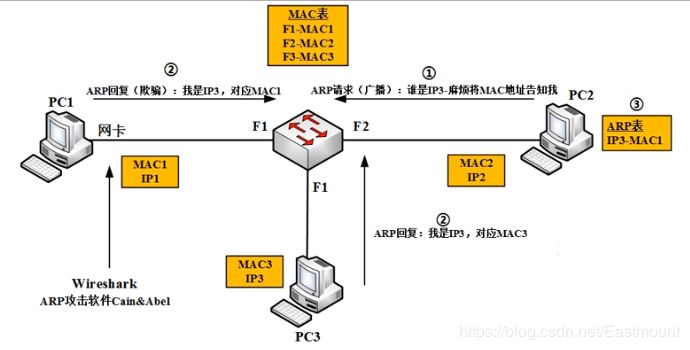
Suppose we are not authorized to perform port mirroring on the switch. Because there is a MAC address table, we want to obtain the entire local area network’s traffic, intercepting PC2 and PC3’s traffic. This can be achieved through the famous ARP attack software Cain & Abel. The process is as follows:
First, PC2 sends an ARP request broadcast packet. The switch, upon receiving the packet, will send it to PC1 and PC3.
When PC1 and PC3 receive the packet, under normal circumstances, PC1 will discard it because it is inquiring about PC3. However, ARP spoofing will reply, “I am IP3, corresponding to MAC1,” which is a typical ARP spoofing or ARP virus.
Finally, PC2 will encapsulate traffic into MAC1 at the underlying layer and reply. If PC3 and PC1 both respond, but APR has a feature called last-in priority, PC1 will make an incorrect binding, sending the data packet to MAC1, causing PC2 and PC3’s communication traffic to pass through PC1. This is a typical traffic interception, and local area network attack.
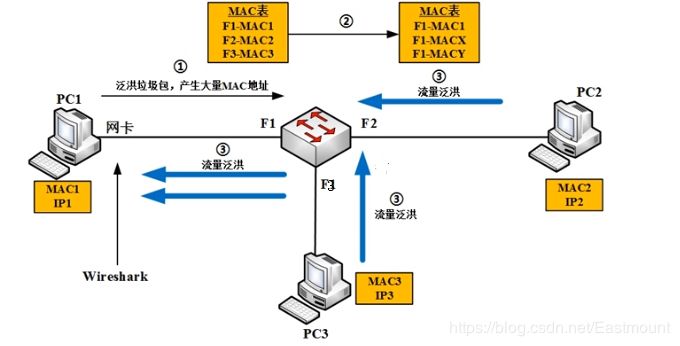
3) MAC FloodingThrough tools, flooding can generate a large number of garbage packets, creating a lot of MAC addresses. At this point, the switch’s MAC address table will become like the table on the right (overflow). MAC2 and MAC3 are pushed out of the MAC address table. Once these MAC addresses are pushed out of the MAC address table, as per the switch’s principle, if a data packet is received as unknown, it will flood it externally, causing PC2 and PC3 to flood externally.
(B) Underlying Framework Principle
So, what is the underlying architecture of packet capturing like? Let’s start explaining Wireshark’s underlying principles.
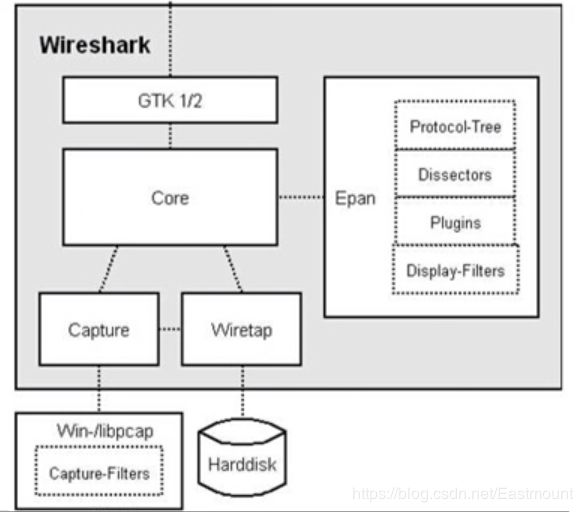
Wireshark consists of a five-layer architecture:
The bottom-most Win-/libpcap: The library files (driver files, library files) Wireshark relies on for capturing packets.
Capture: The packet capturing engine leverages libpcap/WinPcap to capture network packets at the lower layer. Libpcap/WinPcap provides a universal packet capturing interface that can obtain packets from different types of network interfaces (including Ethernet, token ring, ATM networks, etc.).
Wiretap: At this point, a bitstream is obtained. Through Wiretap (format-supported engines), packets can be read from captured files, supporting multiple file formats.
Core: The core engine connects other modules through function calls, playing a role in joint calls. The packet analysis engine involves Protocol-Tree (saving protocol information of packets, protocol structure employing a tree structure. When parsing protocol messages, just call each layer’s parsing function successively from the root node through function handles), Dissectors (various protocol decoders supporting over 700 protocol parsing. Decoders recognize protocol fields and display field values. Wireshark employs a protocol tree form for layered processing of protocol traffic), Plugins (some protocol decoders achieved in the form of plugins, source code in the plugins directory), Display-Filters (display filter engine, source code in the epan/dfilter directory).
GTK1/2: Graphics processing tools, handling user input and output display, finally stored on the Harddisk.
PS: Understanding the basic principles is quite important, especially for later in-depth research.

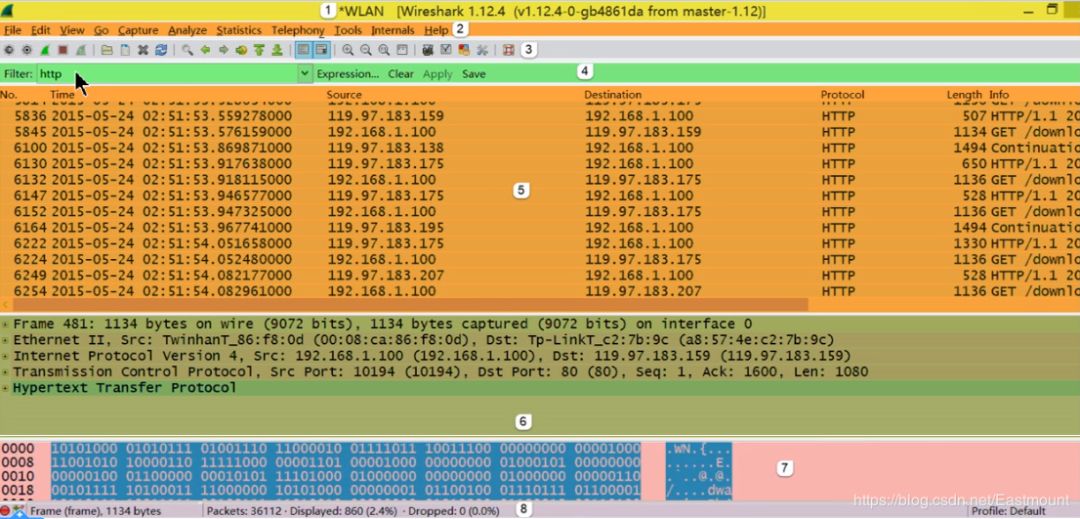
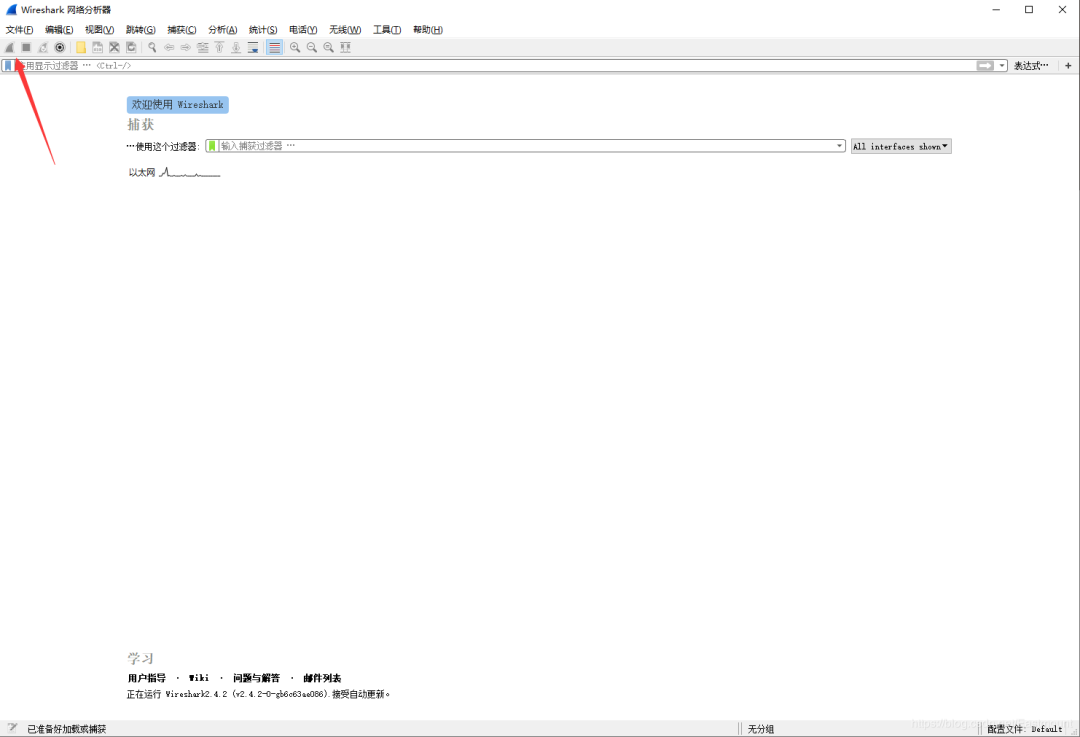
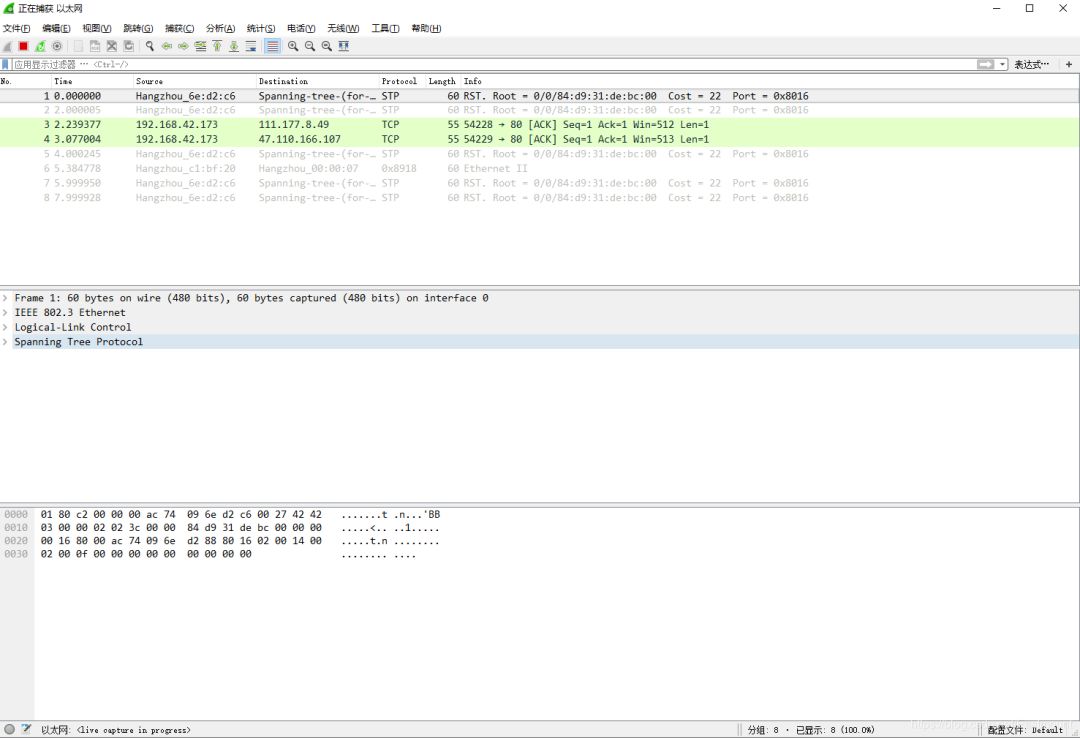
After Wireshark is running, its interface is shown below, encompassing the title bar, menu bar, toolbar, packet filter bar, packet list area, packet details area, packet bytes area, and packet statistics area.
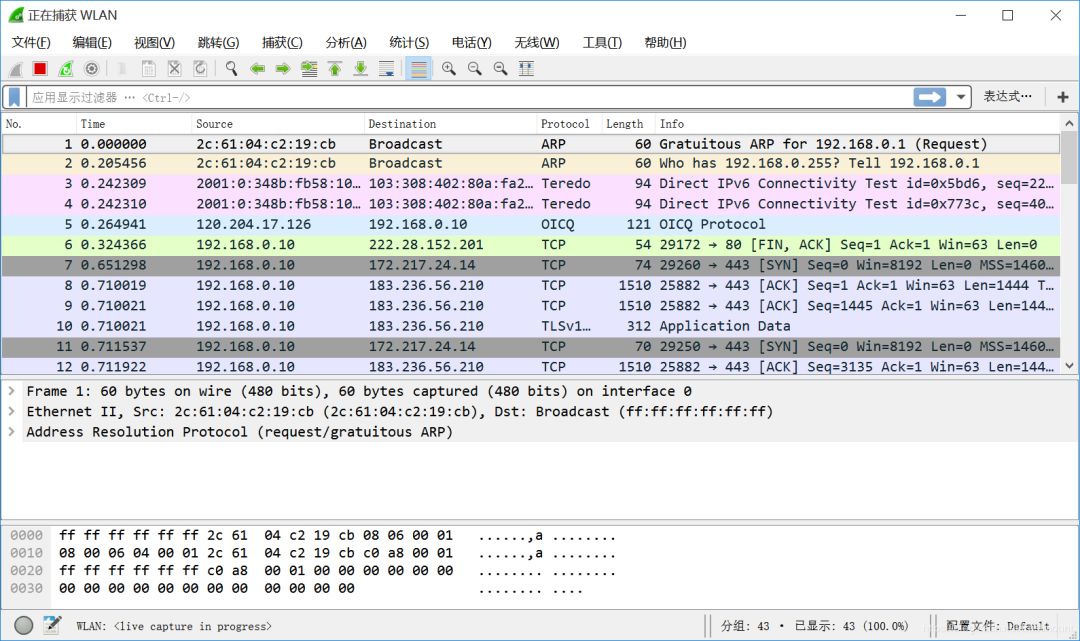
From top to bottom, numbered as shown below.
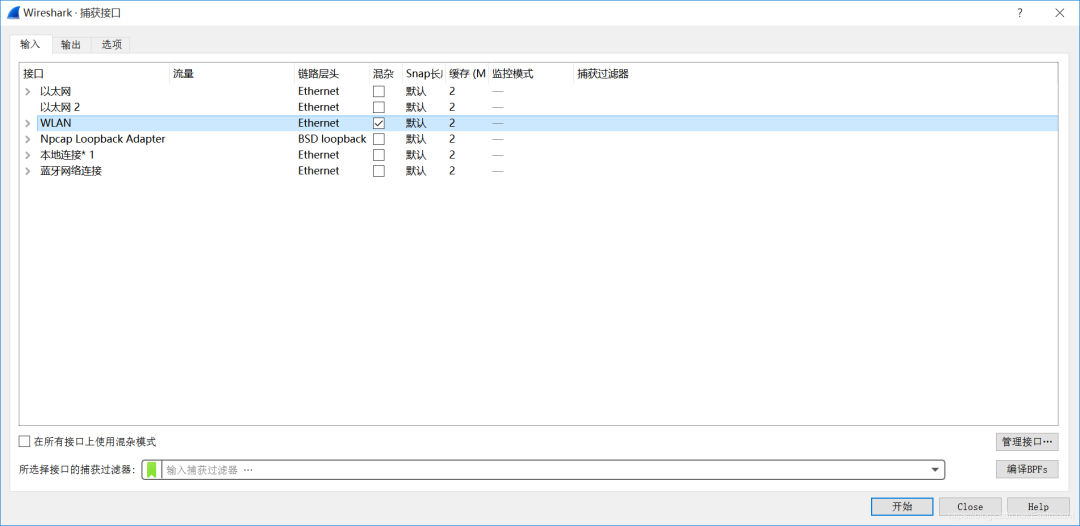
Next is a brief introduction to some common interface knowledge.

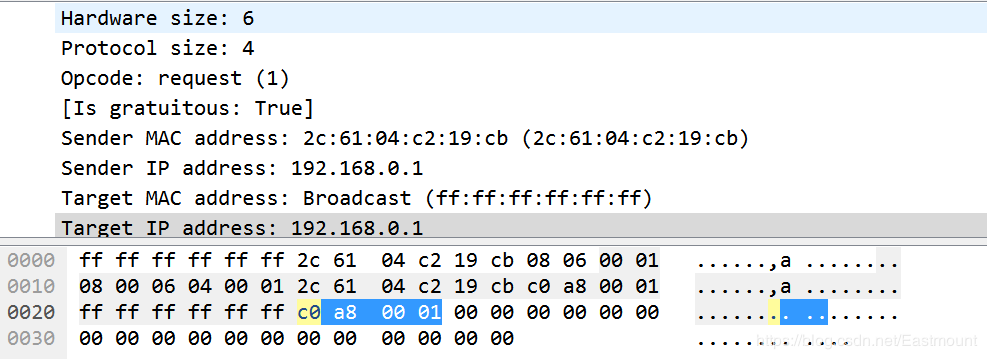
The packet details area and packet bytes area contain bit-byte information.
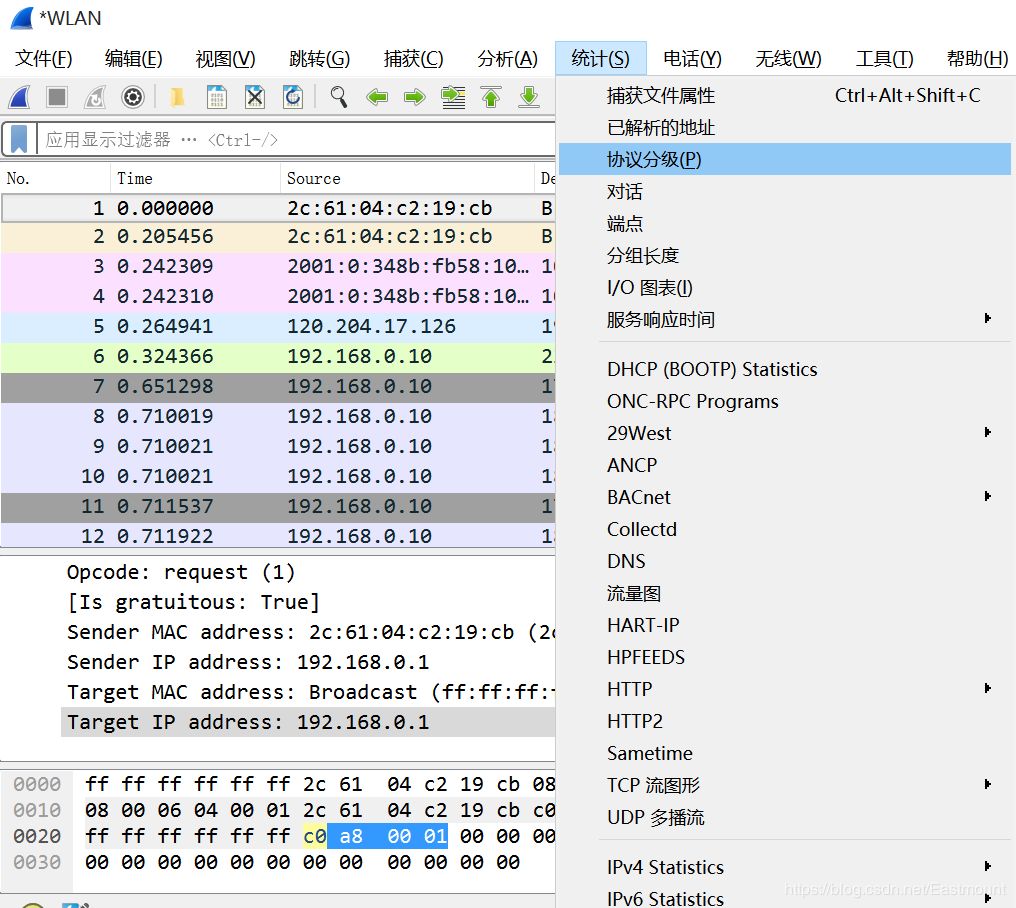
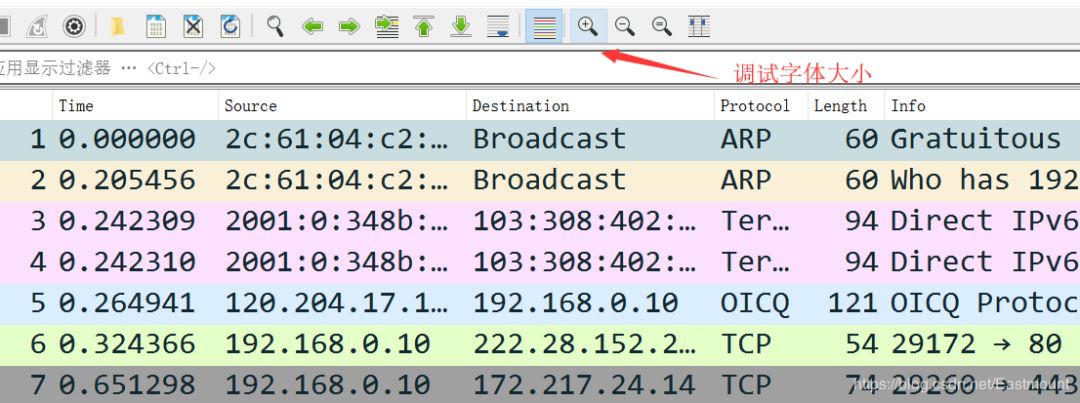
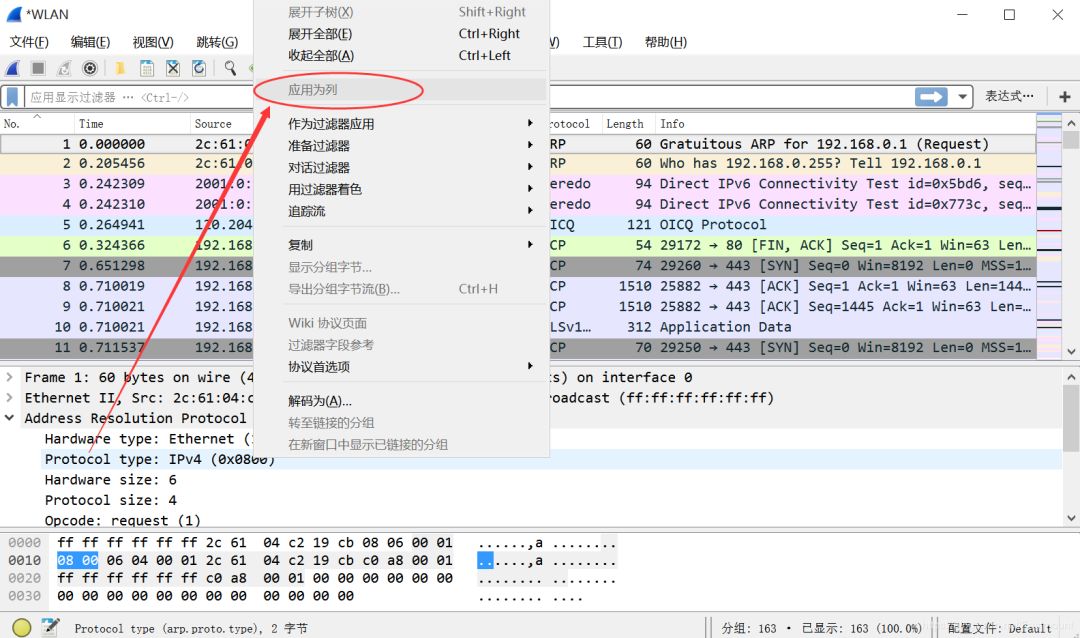
After adding, as shown below:

Select the column name, right-click “Delete Column” to remove it. Click “Edit Column” to modify the name.
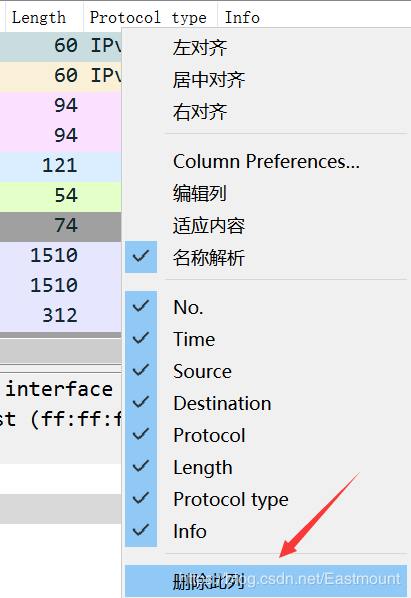
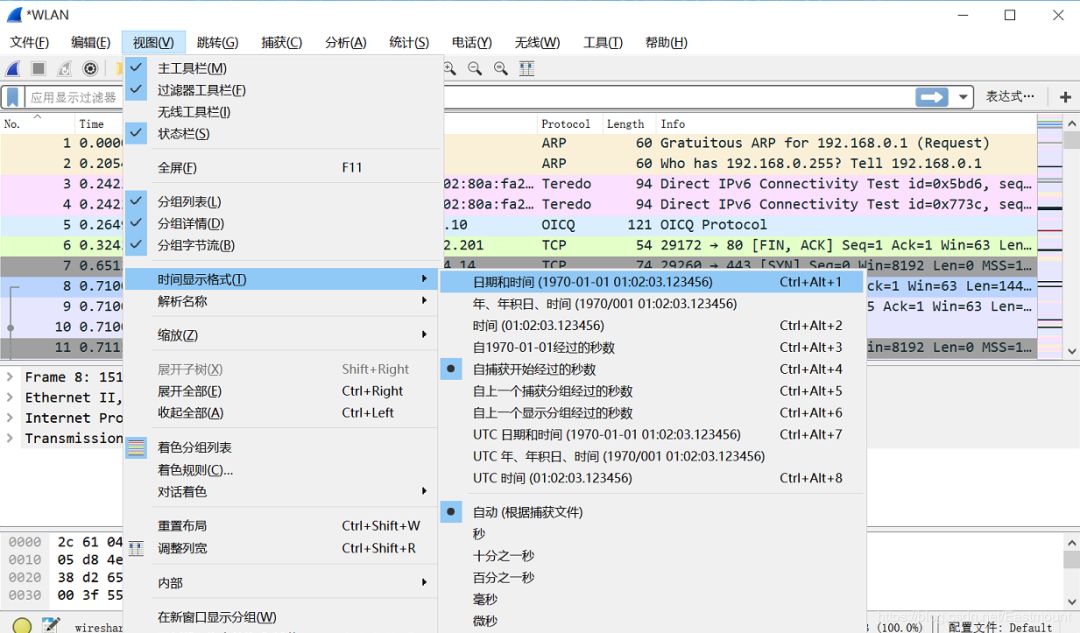
After modification, as shown below, the time interval is no longer displayed.


Device-related information is shown below:
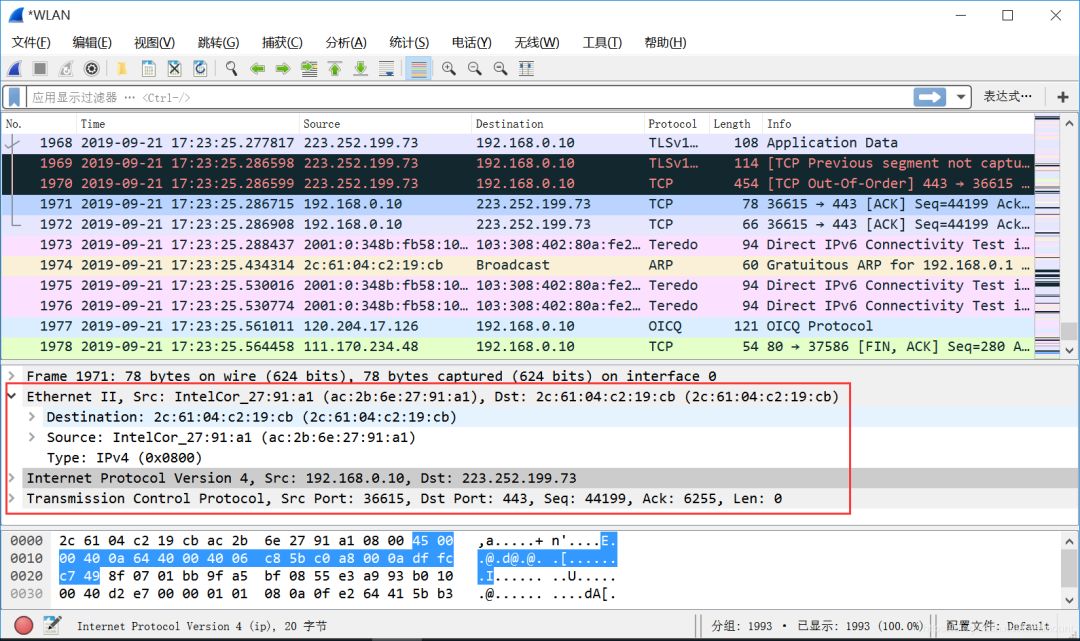
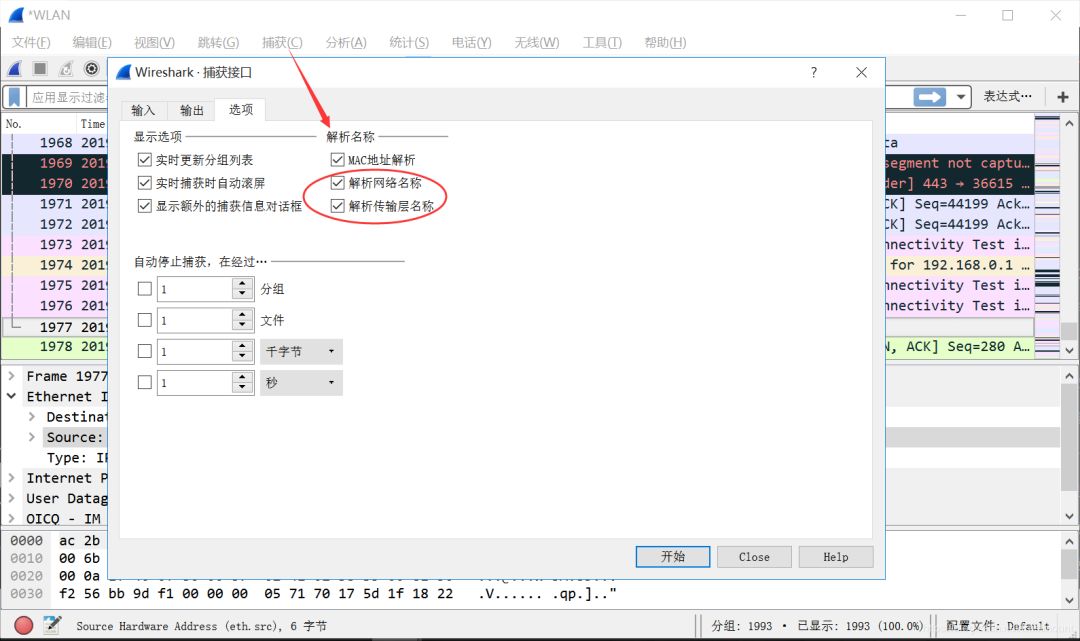
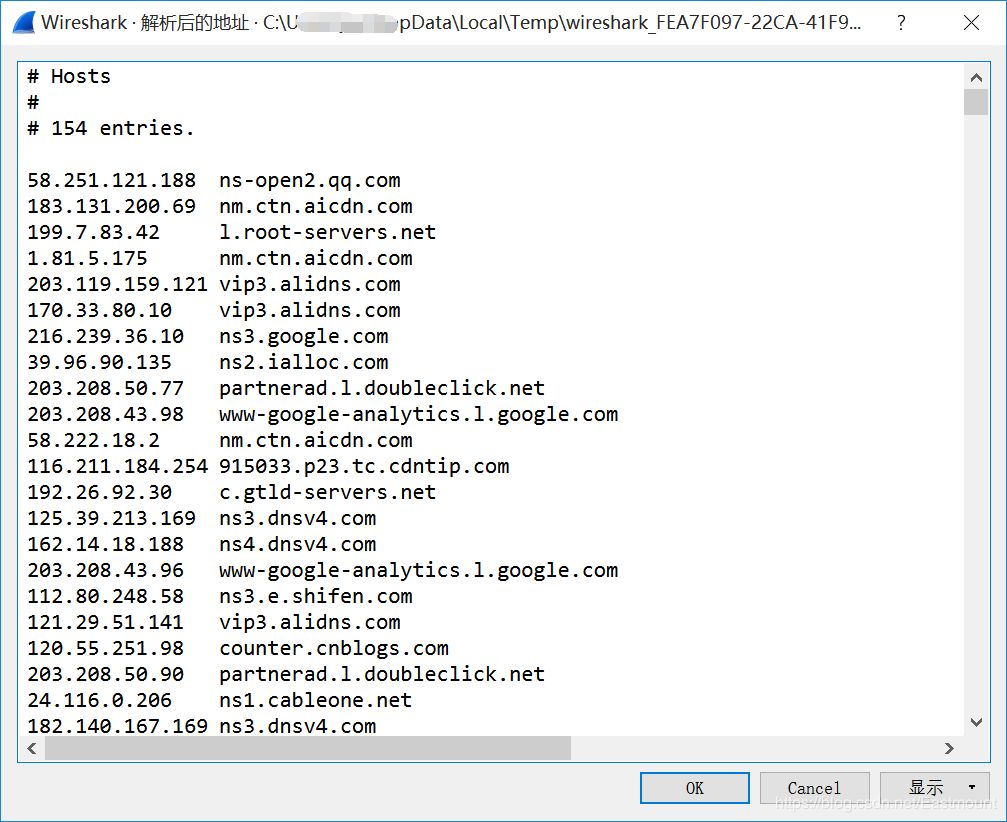
After enabling, you can see the parsed domain names and their corresponding DNS.
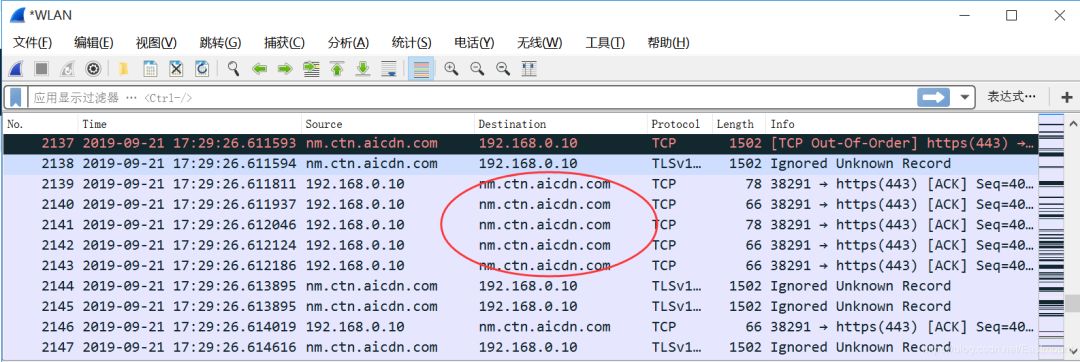
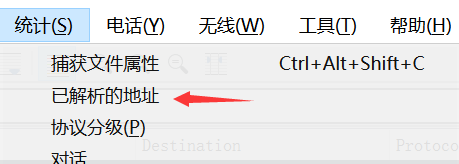
The display results are as follows:
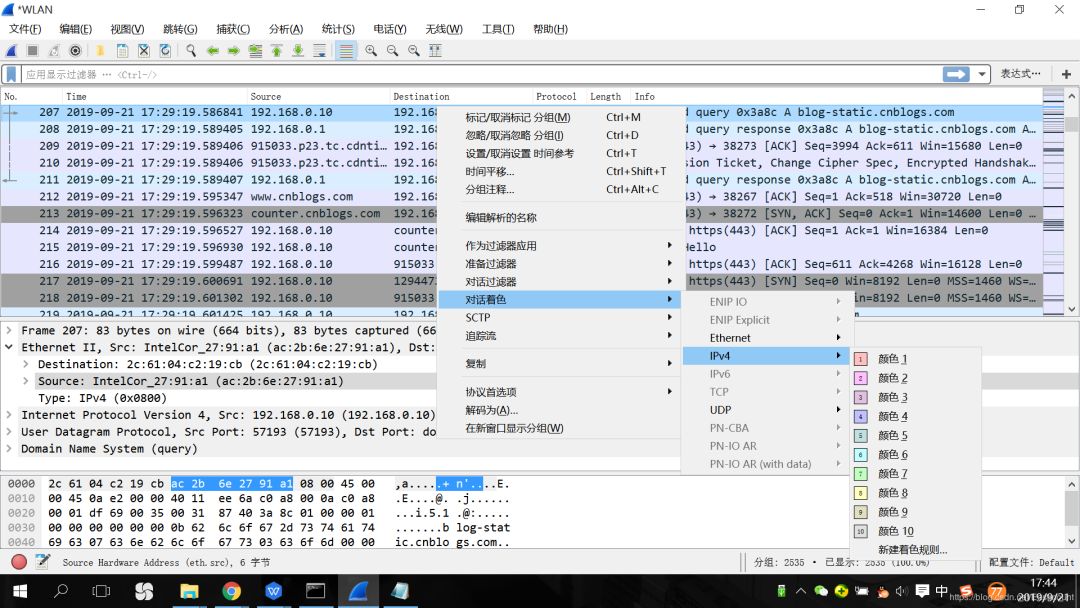
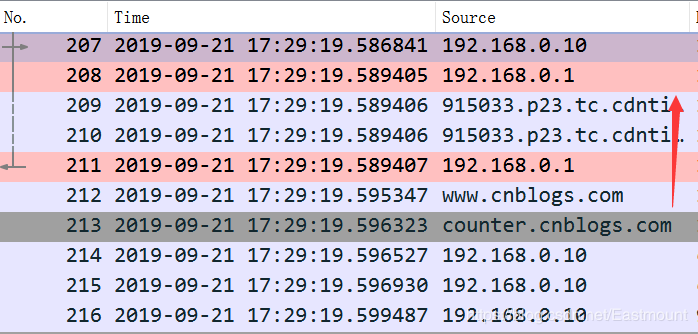
As shown below, modify it to red.
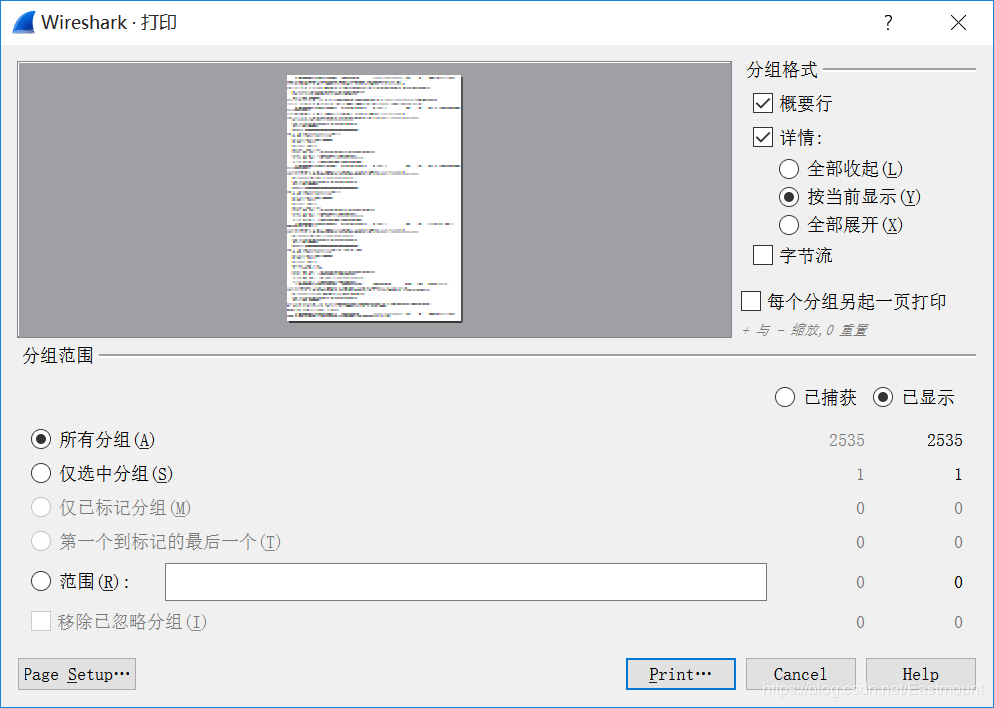
Next, the author will continue to share practical case knowledge of Wireshark, first explaining knowledge about tracing data streams, obtaining expert information, and obtaining statistical summaries.

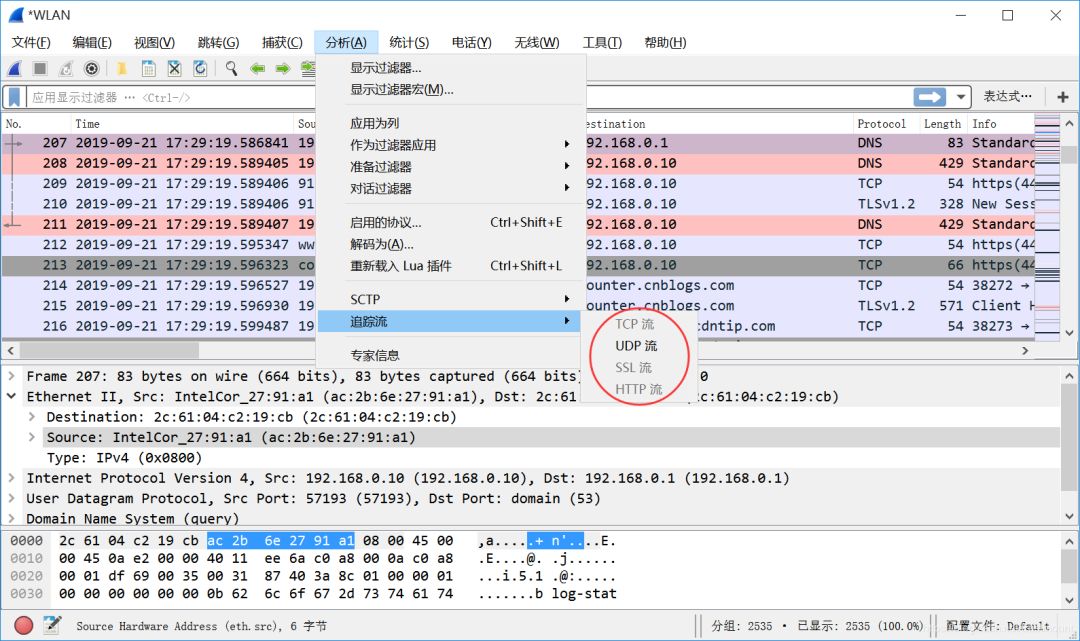
Data stream tracking mainly refers to reorganizing and fully presenting TCP, UDP, and SSL data streams. The click path is: Analyze -> Follow -> TCP stream analysis. Tracking TCP streams is implemented as shown below:
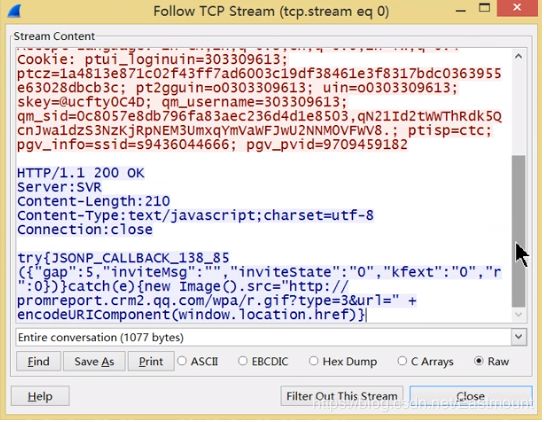
When we visit web pages, besides the HTTP protocol, most of the traffic should be packets generated through the TCP protocol, as shown below. The red part represents the URL information accessed by the browser (Request), and the blue part represents the feedback information given to us (Response).
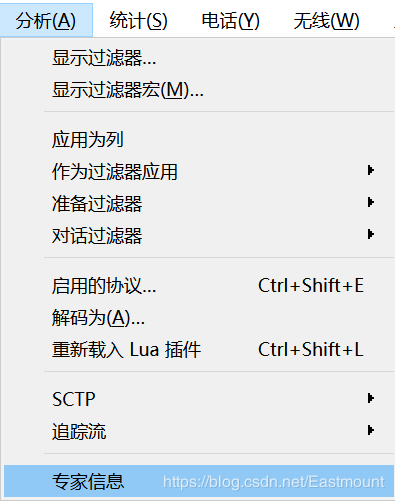
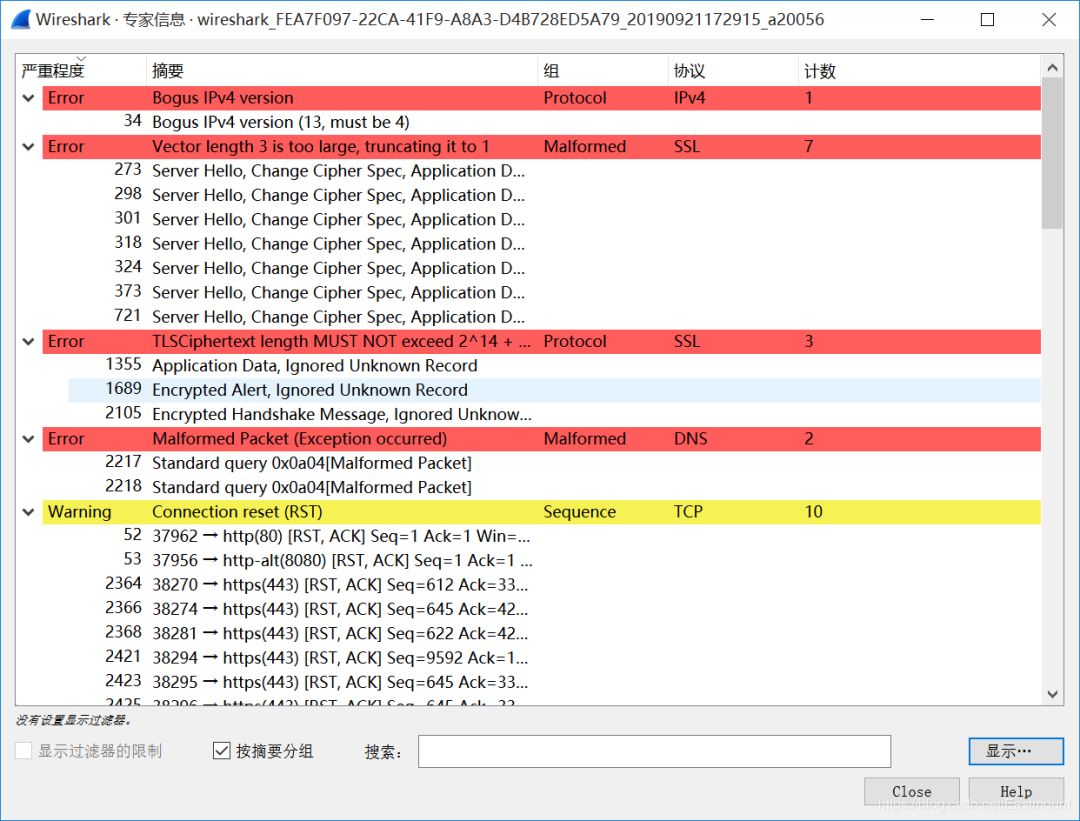
Its function is to provide warnings and explanations of specific states in the packet, including errors, warnings, notes, and chats. Normal communication should not lose packets, but in reality, there might be delays. You can analyze expert information to check a website’s stability.
The display results are shown below, and are marked in various colors.
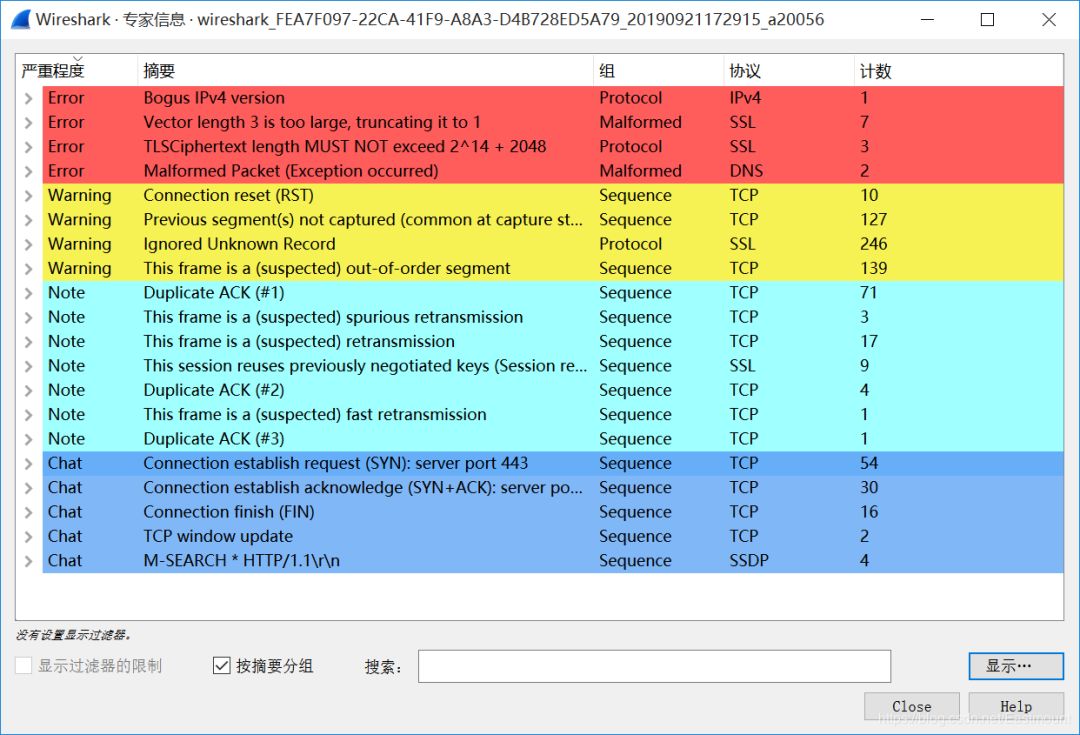
Its main function is to provide global statistics on the captured packets. The basic click path is: Statistics -> Summary to obtain statistical summary information. The display results are as shown below, with further detailed explanations possibly combined with cases.
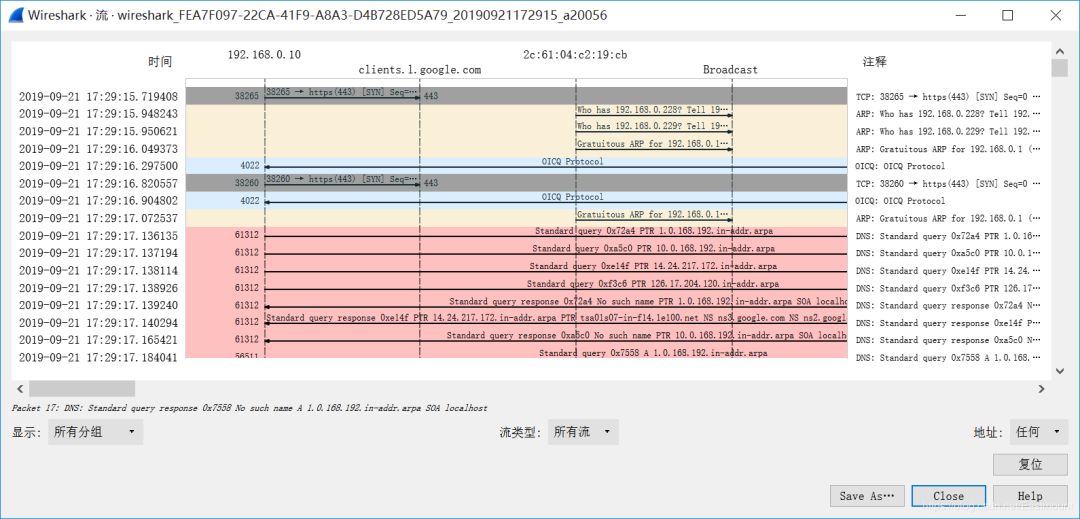

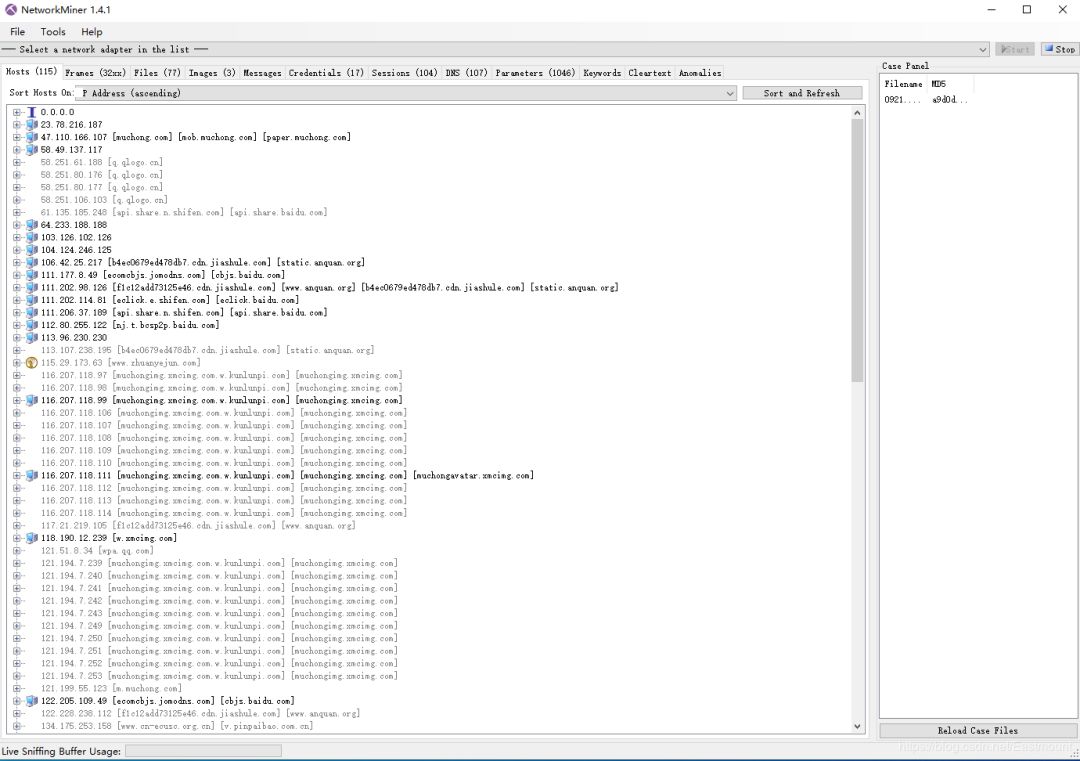
NetworkMiner: An open-source network forensics and protocol analysis tool capable of detecting operating systems, hostnames, and open ports through a sniffer. It can also obtain detailed information from data packets through pcap file analysis. In addition to basic packet capturing and analysis, NetworkMiner supports the following features:
Displays communication information for a specific host in a node form.
Presents IP address, port, used protocol, server version, data packet size, and more via detailed data packet information.
Allows data packet display by IP address, hostname, operating system, or other categories.
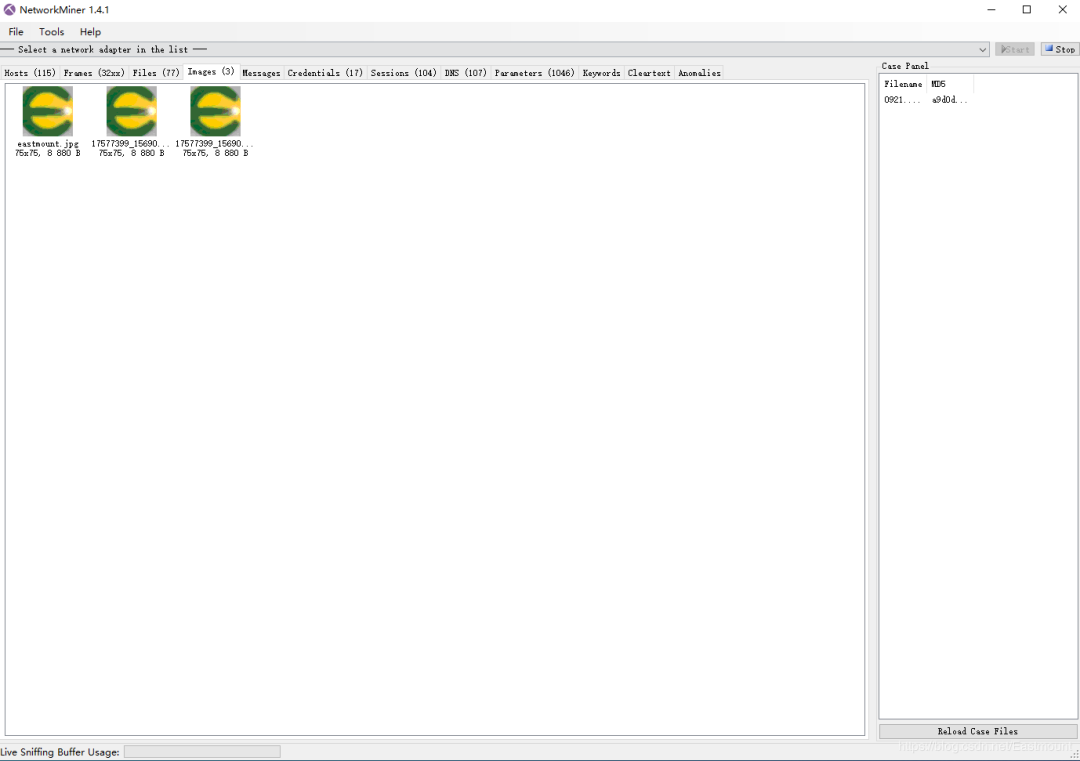
Automatically analyzes and extracts files from data packets, such as images, js files, css files, etc.
Can analyze certificate information contained in data packets.
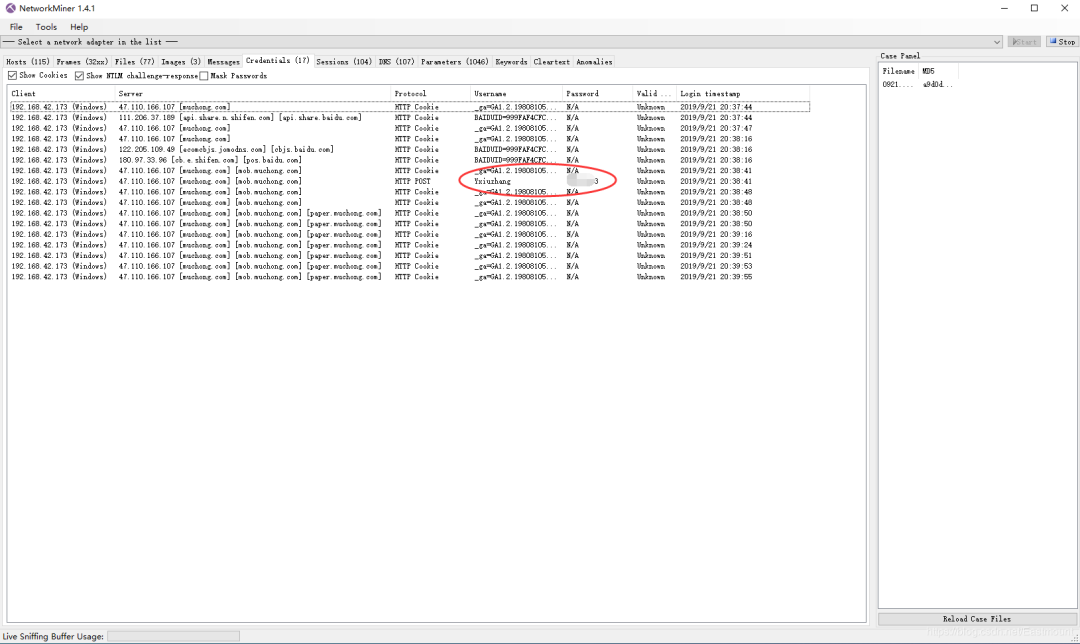
Can analyze session information and cookies in the HTTP protocol and other parameters.
Supports search by keyword functionality, supporting file extraction for FTP, TFTP, HTTP, SMB, and SMTP protocols.
In short, this source project is relatively complex, and if you want to delve into data packet structure analysis and Pcap, NetworkMiner is also a good choice.
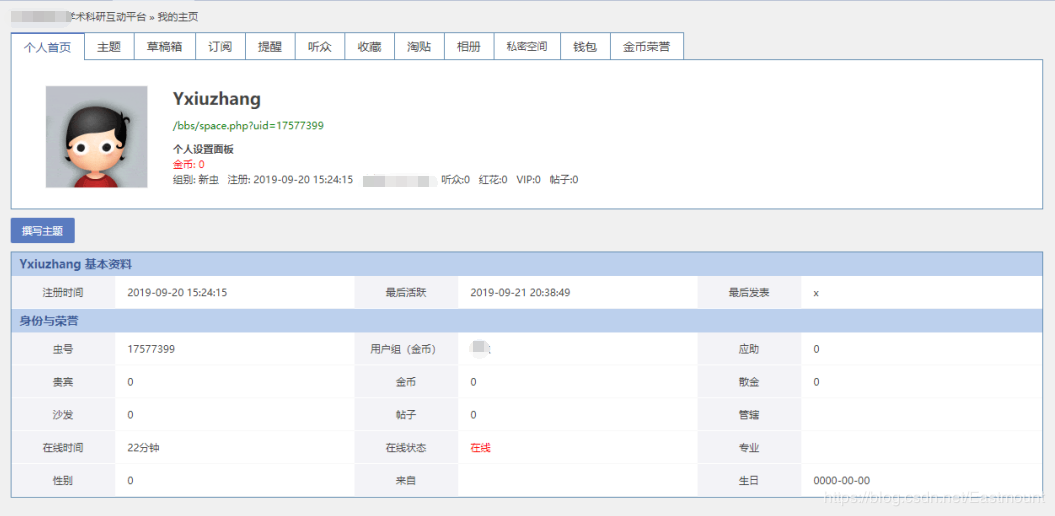
Here’s an explanation of a traffic hijacking case using Wireshark and NetworkMiner tools, demonstrating how to capture usernames and passwords for logging into an HTTP website, and the author modified an avatar image and retrieved the uploaded resource through NetworkMiner software.
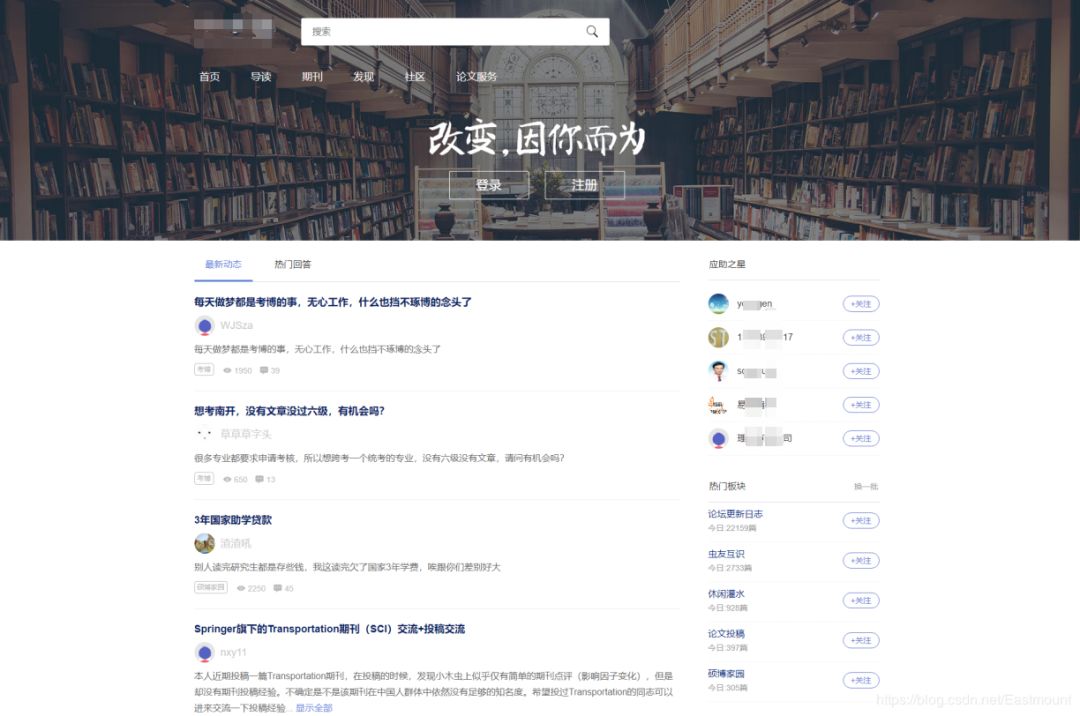
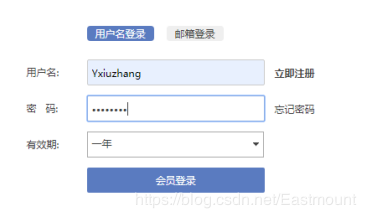
After logging in, as shown below, the author attempts to click a link to submit a local avatar.
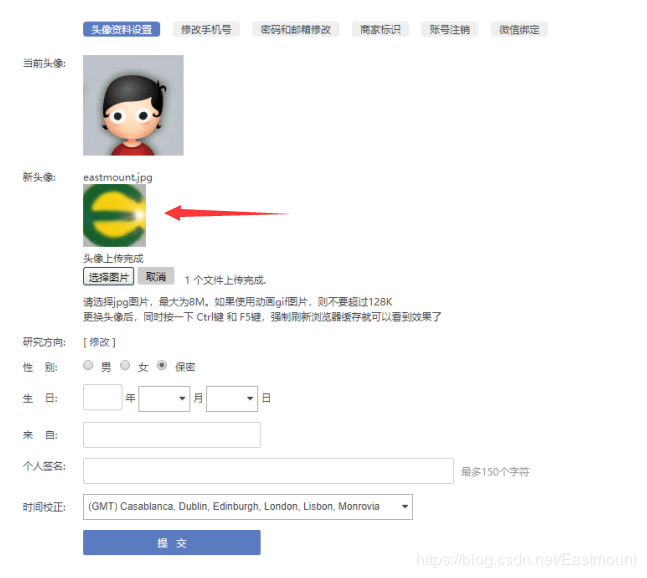
After uploading, as shown below, we begin attempting to analyze the captured traffic data packet.
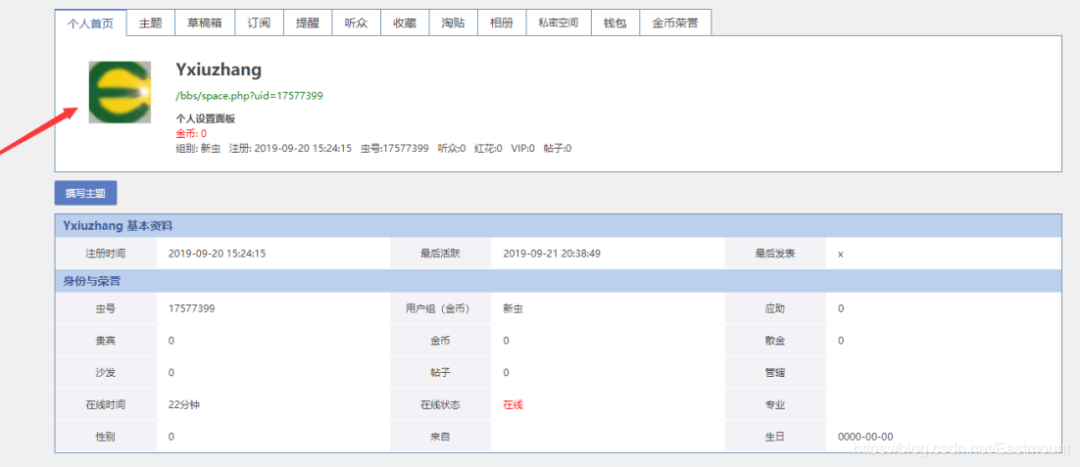

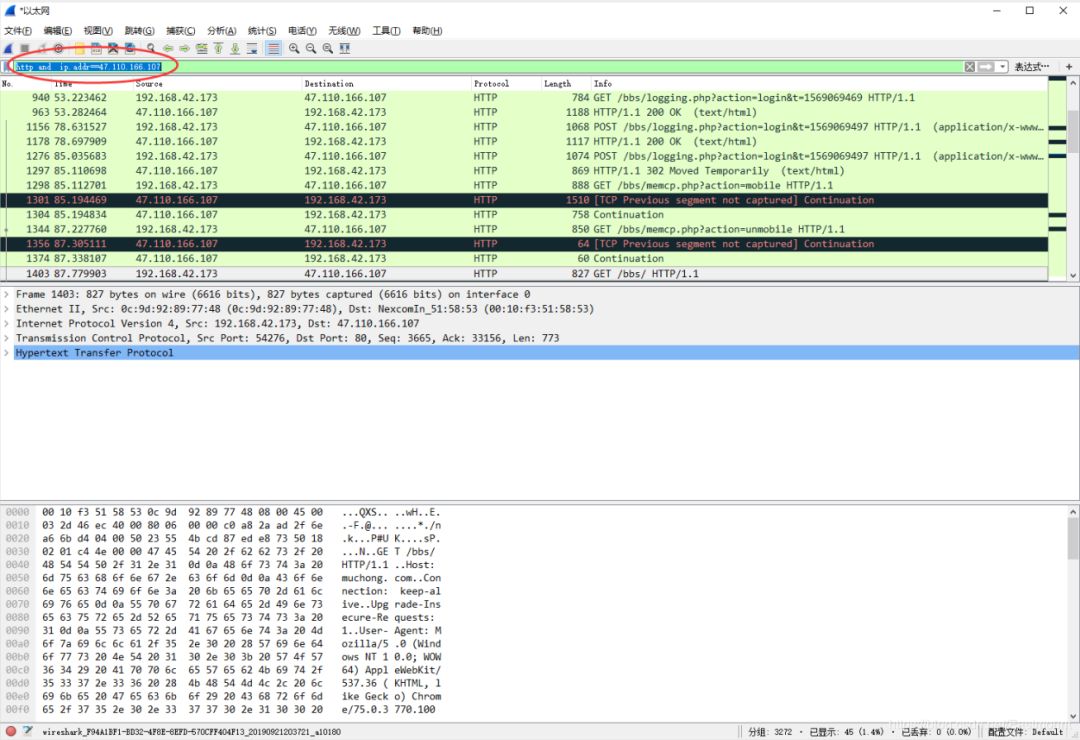
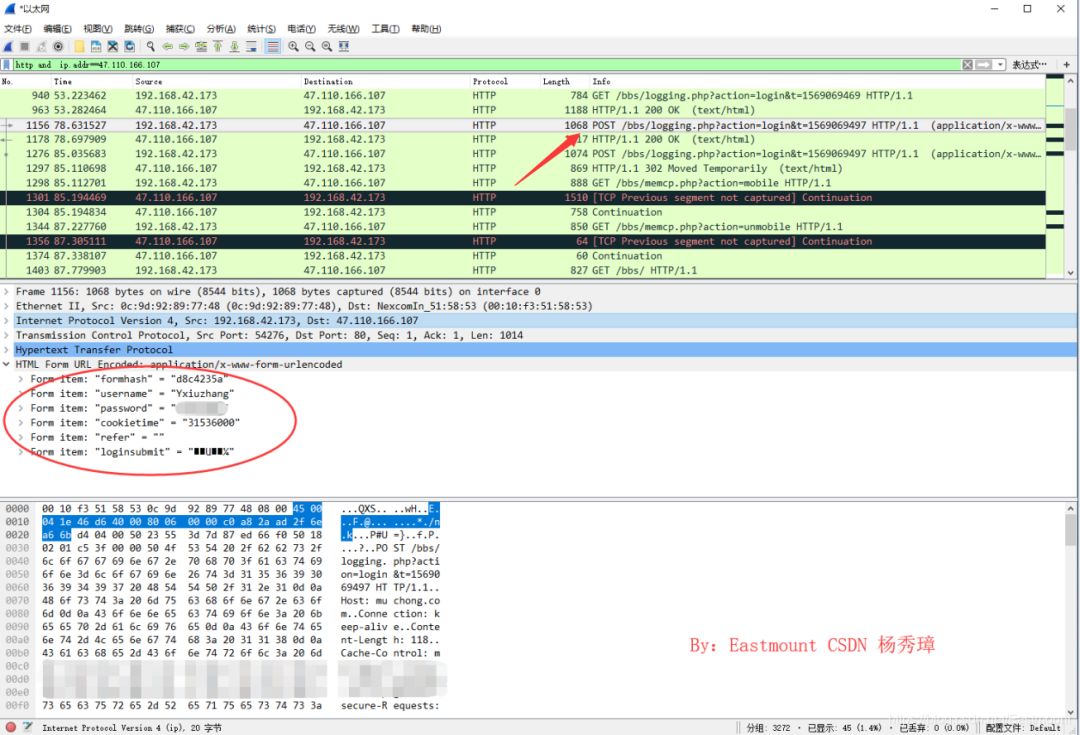
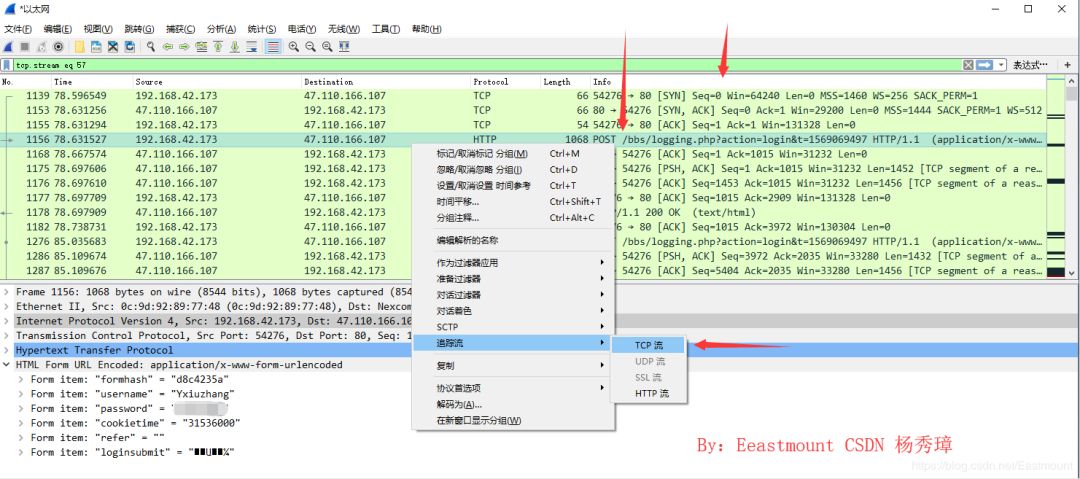
The displayed details are shown as follows, with red indicating the Request and blue indicating the server’s Response. We can also attempt to export and save them locally.
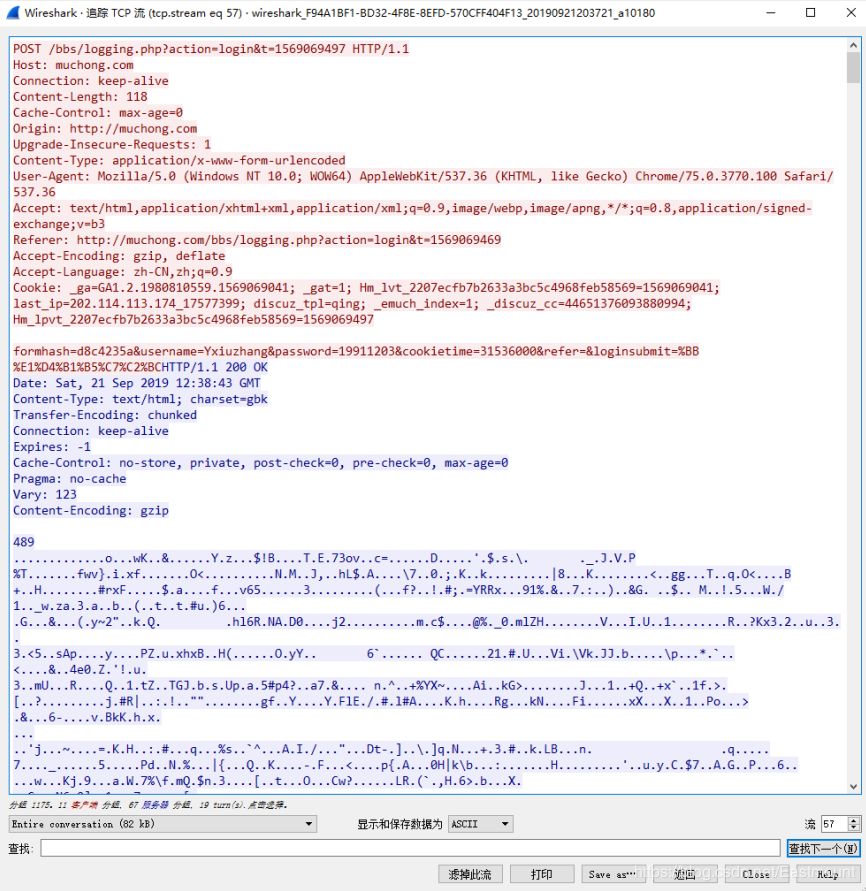
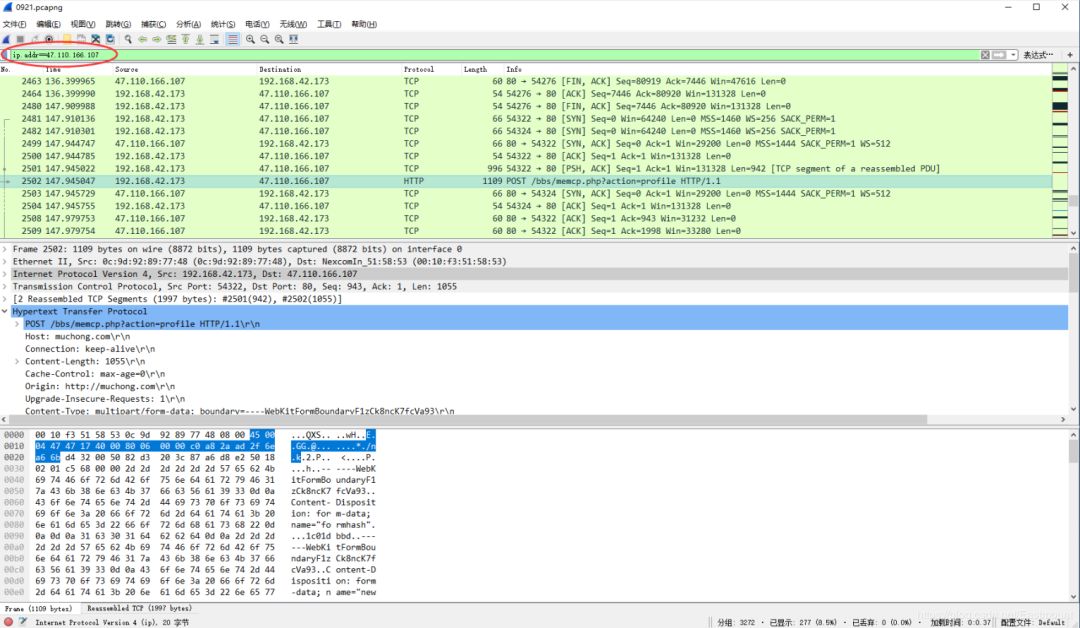
Here, the reader attempts to find the image form POST submission, locating the original image format of its TCP stream for analysis.

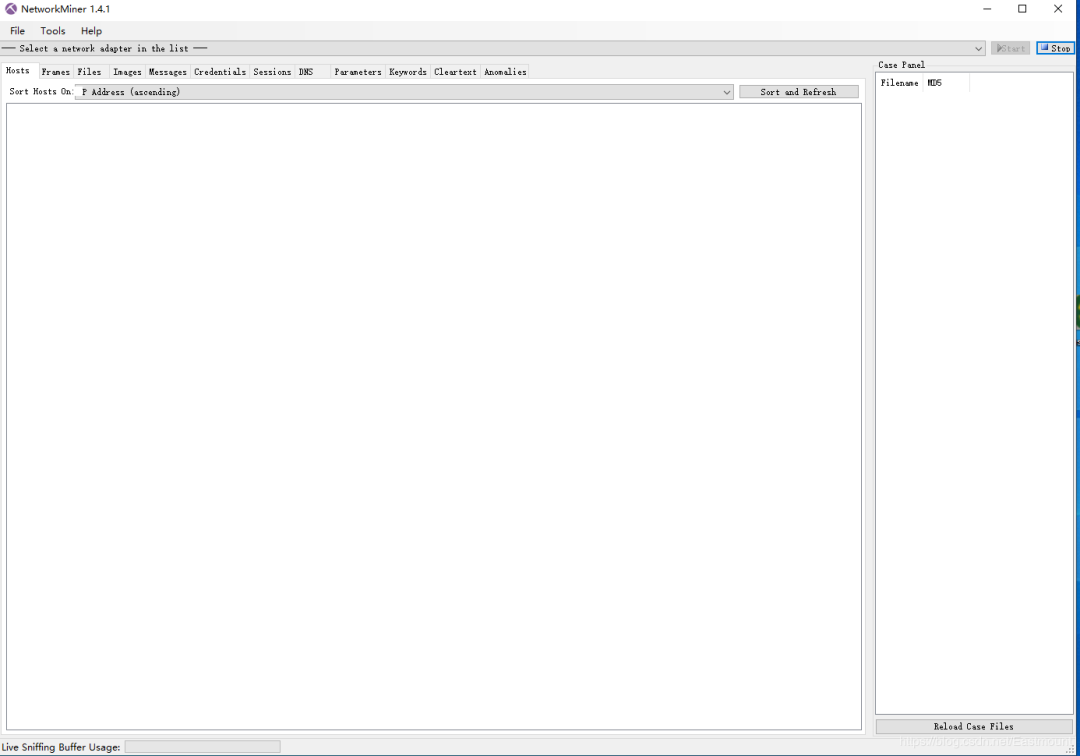

So far, this article has concluded. In summary, Wireshark is a very powerful tool, and I hope readers can learn to use it. In the future, we will share how to capture traffic in mobile apps. The author is also a newbie but continues to learn step by step, hoping you can walk alongside me.


