

1. Introduction
In two consecutive articles, we have detailed the use of tcpdump filtering.
Troubleshooting Computer Network Issues (I) — tcpdump Principles and Basic Parameters
Practical Troubleshooting of Computer Network Issues (II) — tcpdump Filtering Commands
However, the results generated by the tcpdump tool are complex and difficult to pinpoint the needed information among the vast data with the naked eye. At this point, a convenient and user-friendly visualization tool is especially important.
Currently, the most popular network packet analysis software is Wireshark. It includes packet capture analysis tools and also supports the analysis of pcap files. It can capture and analyze various network packets, displaying detailed packet information. With it, resolving network issues becomes much more manageable and efficient.
This article will provide a detailed introduction to the installation and use of Wireshark. For specific problem packet analyses, we will have a series of articles for detailed explanations—stay tuned.
2. Installing Wireshark
Installing Wireshark is very simple. Just download the installation package from the official website and follow the prompts to install:
3. Using Wireshark
3.1 Capturing Packets with Wireshark
The interface of Wireshark after opening is shown below:
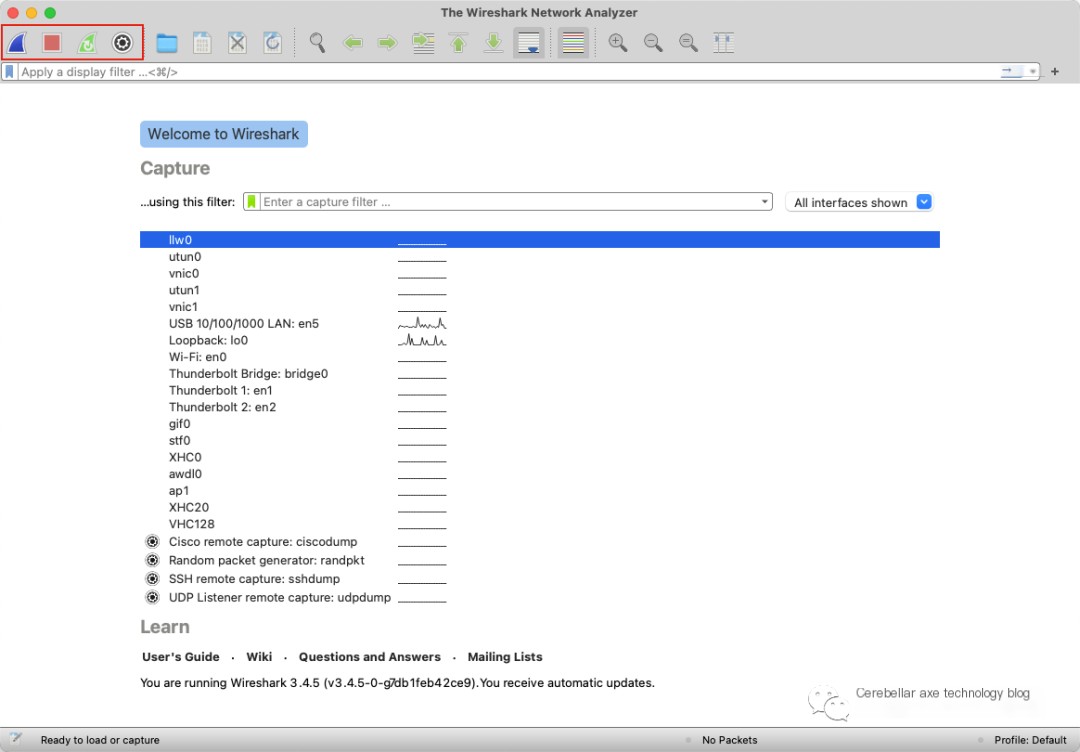
The buttons selected in the figure from left to right are: Start Capture, Stop Capture, Restart Capture, Capture Options.
If you want to use Wireshark for packet capture, you just need to do a simple configuration, select the network card you want to capture packets from, and click to start capturing.
Through the Capture Filters option in the Capture menu, you can set filters to apply during the capture process before capturing.
3.2 Analyzing pcap Files with Wireshark
Usually, we use Wireshark in the more common scenario of analyzing the raw pcap files generated by tcpdump using the -w parameter.
At this time, you just need to click File menu’s Open and select the pcap file we have prepared beforehand.
4. Wireshark Interface
Once the packet capture or pcap file loading is completed, you can see the following interface:
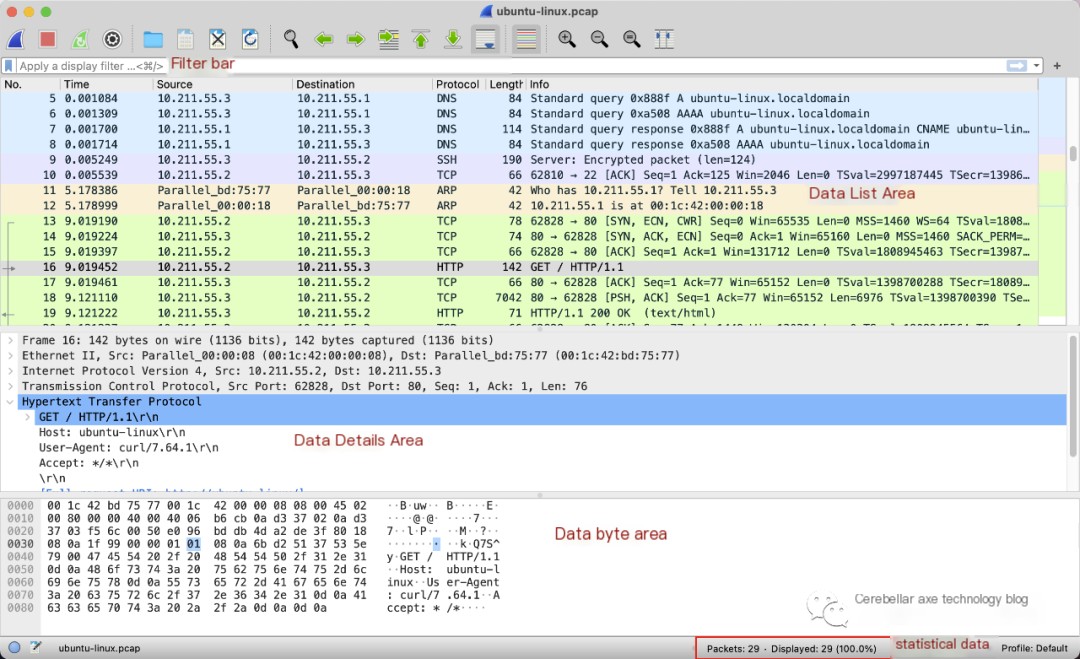
As shown in the figure, the Wireshark interface is mainly divided into the following areas:
- Filter Bar — Used to enter filter expressions to filter captured data.
- Packet List Area — Each line is a data packet, containing the number, timestamp, source address, destination address, protocol, length, and packet information.
- Packet Details Area — Displays detailed data information of the selected packet.
- Packet Bytes Area
- Packet Statistics Area — Displays statistics such as total packet count.
4.1 Packet List Area
Let’s first look at the Packet List Area. The interface is very intuitive, and you can see at a glance where each data packet is sent from and to, the protocol, packet size, and more information on the interface.
You can also see that different types of data packets are marked with different colors. You can view and modify the color scheme through the Coloring Rules option in the View menu.
4.2 Packet Details Area & Packet Bytes Area
The Packet Details Area displays detailed information of a packet:

As shown in the figure, the Packet Details Area displays five layers of details of the packet according to the OSI model:
- Frame: Overview of the physical layer data frame
- Ethernet II: Data link layer Ethernet frame header information
- Internet Protocol Version 4: Internet layer IP packet header information
- Transmission Control Protocol: Transport layer segment header information
- Hypertext Transfer Protocol: Application layer information
You can click the button on the left to expand and see the specific values of each or certain bytes.
In the Packet Bytes Area, you can see the specific hexadecimal and ASCII values of each byte.
5. Display Filter Rules
By simply filling in filter rules in the Filter Bar, you can filter the captured data in the Packet List.
5.1 Operators
Similar to most programming languages, the operators supported by Wireshark include the following:
- ==
- !=
- >
- <
- >=
- <=
- and
- or
5.2 Protocol Filtering
Just input the protocol name in lowercase, for example:
- tcp
- http
- icmp
5.3 IP Filtering
Wireshark supports filtering by source and destination IP:
- ip.src == 192.168.1.101
- ip.dst == 192.168.1.101
- ip.addr == 192.168.1.101
5.4 Port Filtering
Similarly, Wireshark also supports filtering by source and destination port:
- tcp.port == 80
- tcp.srcport == 80
- tcp.dstport == 80
5.5 HTTP Method Filtering
For HTTP packets, you can filter by HTTP methods:
http.request.method==”GET”