

1. Introduction to Wireshark Windows
Wiresharkis a highly powerful open-source network packet analyzer that can capture data from network interfaces in real-time. It displays captured data in great detail for users to inspect their content and supports multi-protocol network packet analysis.Wiresharkis compatible withWindowsandUNIXoperating systems. It can be used to inspect security issues and troubleshoot network problems, and also serves developers in debugging protocol implementations and learning the fundamentals of network protocols.
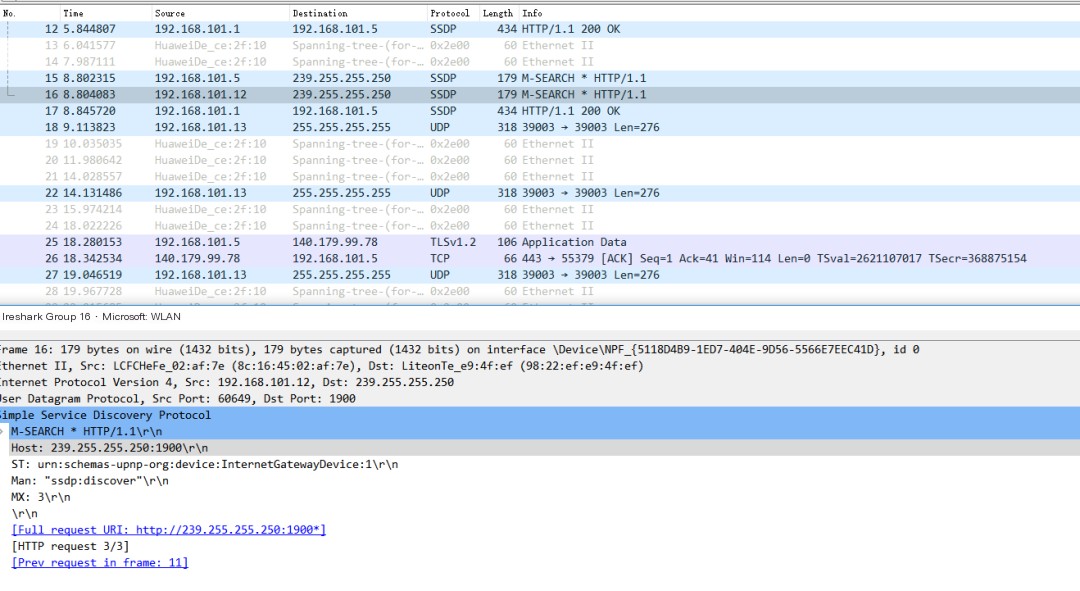
Wireshark Windows packet capture effect illustration
We used it during our university network courses, and in the corporate phase, Wireshark is heavily utilized if network protocol development is involved.
Now, the question arises, can the packet capture data from Wireshark be visually analyzed?
This piqued my curiosity and exploration desire greatly, so today I will lead everyone to explore it in depth.
2. Feasibility and Requirement Analysis of Wireshark Data Visualization
The discussion primarily covers the following questions:
2.1 Where does the data come from?
Data communication (e.g., logging into QQ, WeChat, browsing web pages, etc.) requires extensive data transmission and synchronization.
From a protocol perspective, it’s divided into: Network Interface Layer, Network Layer, Transport Layer, and Application Layer, each having a significant amount of data.
Therefore, data is not an issue, nor is the data volume.
The size of the data volume only depends on the matter of time.
2.2 How to obtain the data?
Wireshark on Windows is a tool for visual viewing and analysis but cannot support data retrieval for secondary processing and analysis.
However, the backend of Wireshark provides a command-line tool—tshark.

With tshark, data acquisition is just a matter of course.
2.3 How to choose a visualization architecture?
“When you have a hammer, everything looks like a nail.”
I use Elastic Stack quite often, so naturally, ELK remains the choice.
However, visualization goes beyond Kibana; for instance, Grafana based on Kibana is also a good choice.
- Data storage selection: Elasticsearch.
- Data visualization analysis selection: Kibana.
- Data synchronization has more than one solution: curl + bulk batch writing, Logstash, and Filebeat are all options.
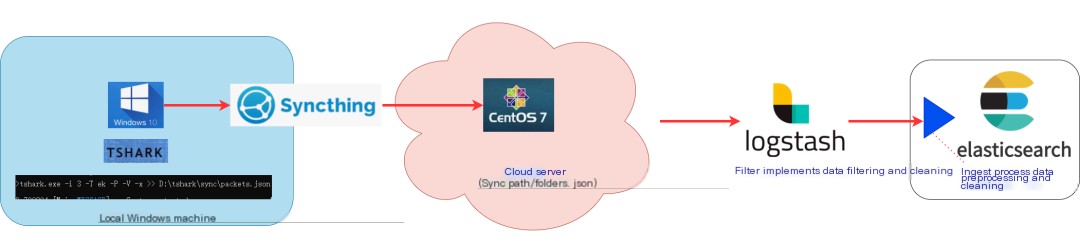
3. Overview of Wireshark Windows Data Visualization Architecture
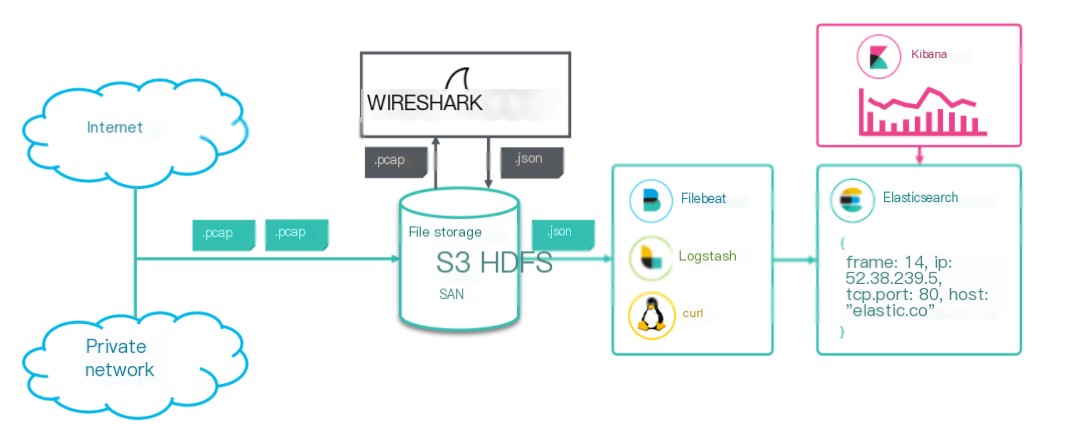
From the Elastic official blog
Each major component performs its duty, collectively accomplishing data collection, synchronization, storage, and visualization tasks.
- The
tsharktool ofWiresharkis responsible for collecting network protocol packet data, stored with suffixes: .pcap and JSON files. Filebeat,Logstash, orcurlimplements file data synchronization. Notably, only Logstash can perform preprocessing at intermediate stages through its built-in filter plugin.- Elasticsearch implements data storage, with data stored in ES as JSON documents.
- Kibana performs data visualization.
All implementations in this article are based on ELK version 8.X, with tshark using the latest 4.0.2 version (latest as of December 15, 2022).
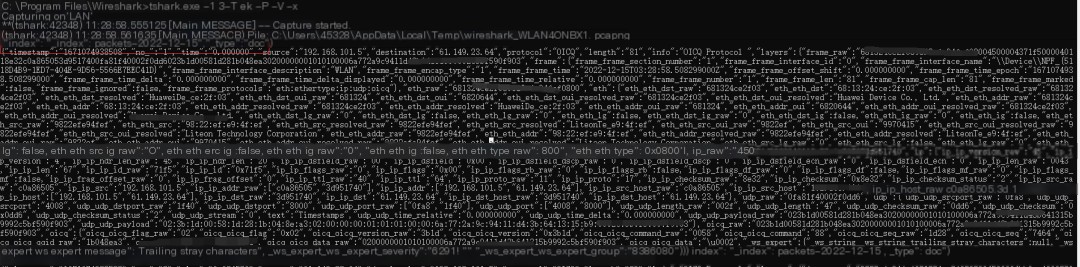
4. Wireshark Packet Capture Data Collection
The previous text analyzed the advantages of the tshark tool. The latest version of tshark more brilliantly provides a format supporting ES data bulk import, as illustrated below.
Core parameters of tshark:
- -i: Specifies the network interface;
eth0is common inLinux, while in Windows, it needs to be checked for retrieval. - -T: Specifies the packet format, ek represents the format for bulk writing to Elasticsearch.
- -j: Protocol type, e.g., “http tcp ip” represent different protocol types.
- -P, -V: If the -P option is used together with the -V or -O option, summary lines will be displayed alongside detailed information lines.
- -x: Prints the data packet data in hexadecimal form.
The data source, that is, the packet capture data object, is from my host: a Windows machine.
Getting network interfaces under Windows with tshark:
Code language: javascriptCopy
tshark.exe -D
Of course, the quickest way here is to have tshark capture packets on a Windows machine and write them into JSON files, then use Logstash to sync to Elasticsearch.
Yet, due to some specific reasons (like version incompatibility, etc.), I first realized JSON sync through a “circuitous rescue” by using synching, then achieved JSON data writing with Logstash.
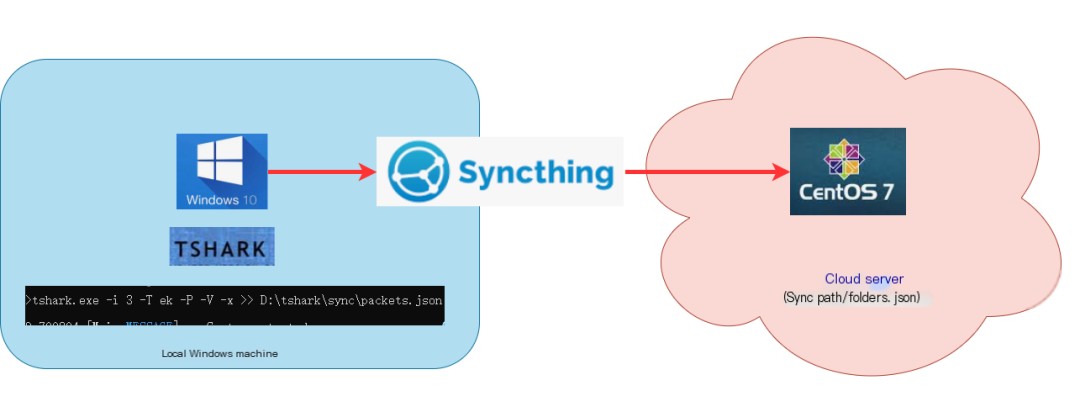
Cross-platform file sync demonstration
For the usage of tshark: https://www.wireshark.org/docs/man-pages/tshark.html
5. Wireshark Data Modeling
tshark packet capture is easy to use, but data fields number in the hundreds.
Only reasonable modeling can provide accurate, efficient data analysis and visualization. Therefore, this step is indispensable and very important.
tshark provides the function to specify protocol types and output mappings. This indeed clears up the confusion of our modeling.
Code language: javascriptCopy
tshark -G elastic-mapping --elastic-mapping-filter ip,udp,http,tcp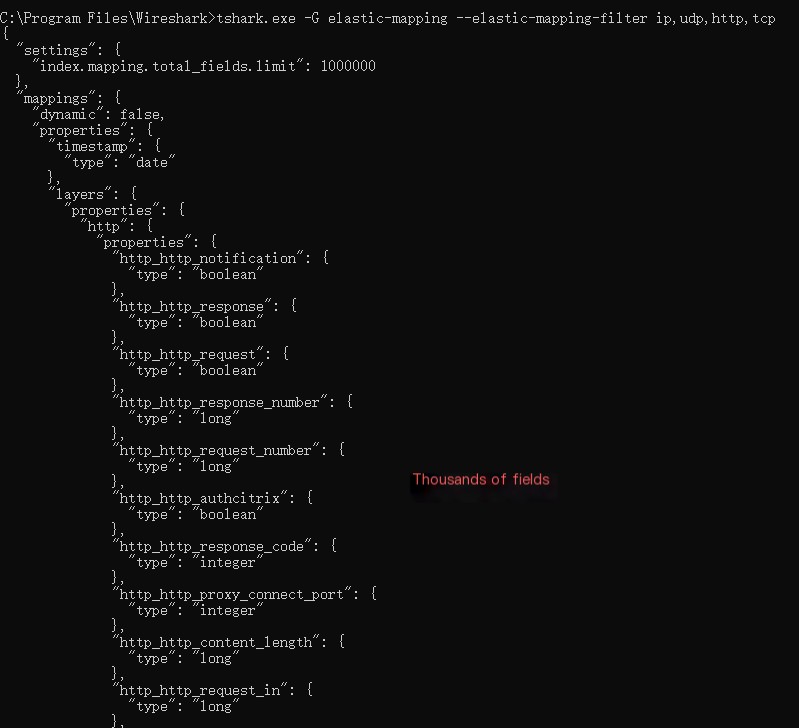
However, not all fields are what we want. It’s necessary to trace back the modeling’s rationality based on subsequent visualization analysis.
We have modeled a few core fields and ignored others, using the dynamic:false feature, where data is not indexed or searchable but can be displayed. This preserves data integrity and greatly facilitates modeling.
I’ve modeled only the following core fields:
|
Field |
Type |
Meaning |
|---|---|---|
|
geoip |
geo_point |
Longitude and latitude, used for mapping points |
|
source |
ip |
Source IP address |
|
destination |
ip |
Destination IP address |
|
protocol |
keyword |
Protocol |
|
info |
text |
Data information, not very useful |
|
layers.frame.frame_frame_len |
long |
Frame length |
|
layers.frame.frame_frame_protocols |
keyword |
Link layer protocol |
|
layers.ip.ip_ip_src |
ip |
Source IP |
|
layers.ip.ip_ip_dst |
ip |
Destination IP |
|
layers.udp.udp_udp_srcport |
integer |
Source port |
|
layers.udp.udp_udp_dstport |
integer |
Destination port |
6. Wireshark Data Preprocessing
All imported data without preprocessing are shown as below.
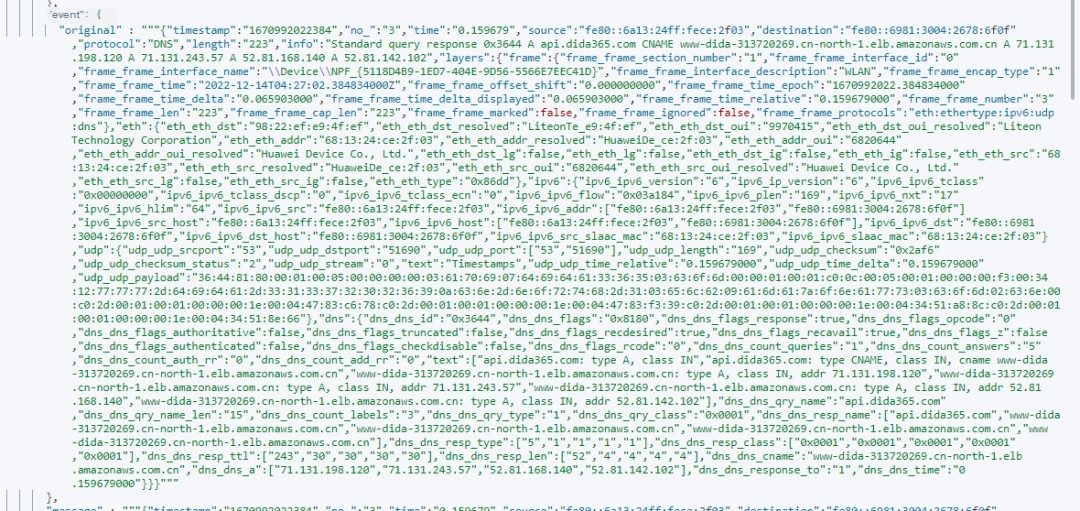
Screenshot of unprocessed data
Therefore, data needs to be preprocessed before writing.
- First, decompose JSON data.
- Second, delete unnecessary fields.
- Third, add necessary fields for later map dotting, achievable via ingest process.
First, second, and others can be implemented using Logstash’s filter stage in synchronization transition.
Emphasizing here that map dotting requires longitude and latitude information while most of our data is at IP address level.
A conversion is required here to transform IP addresses into longitude and latitude. This step is already integrated through GeoIp processor in Elasticsearch.
The GeoIp processor adds information about the geographical location of an IP address based on data from the Maxmind database.
By default, the GeoIp processor adds this information under the geoip field. GeoIp processor can parse both IPv4 and IPv6 addresses.
For more information about the Maxmind database, refer to:
https://dev.maxmind.com/geoip/geoip2/geolite2
The implementation is as follows:
Code language: javascriptCopy
PUT _ingest/pipeline/geoip_pipeline{ "description" : "Add geoip info", "processors" : [ { "geoip" : { "field" : "destination", "ignore_missing": true } } ]}7. Wireshark Data Insertion/Data Synchronization
Ways to insert data are as previously mentioned, divided into three methods:
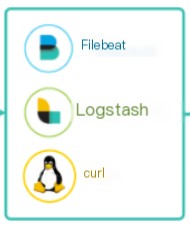
- First: Use Filebeat to sync JSON files.
- Second: Use Logstash for synchronization.
- Third: Use curl command line for synchronous insertion.
Highly recommended: Logstash, as Logstash’s “three-step approach”: input, filter, and output are more flexible, plugin-rich (most are internally integrated), supporting data processing at intermediate stages.
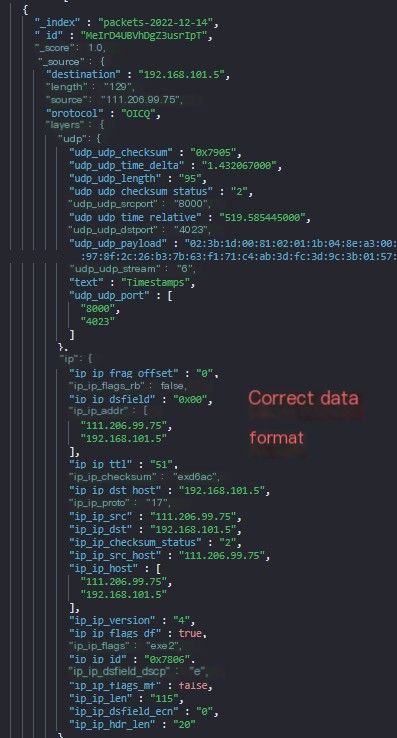
Once synchronization is complete, the data format seen at the Elasticsearch end is as follows.
Sample usage of the curl command line is as follows:
Code language: javascriptCopy
curl -H "Content-Type:application/json" --cacert /elasticsearch-8.1.0/config/certs/http_ca.crt -u elastic:changeme -XPOST "https://111.121.0.114:9200/packets-webserver01-2022-12-14/_bulk" --data-binary "@packes.json"Potential issue with curl: inability to handle large files. The limiting factor lies in the HTTP request constraint.
Two solutions:
- Firstly, increase the max_content_length value (default value: 100mb, where mb here actually means MB). It’s a static value, only modifiable in elasticsearch.yml and taking effect after a restart.
Code language: javascriptCopy
http.max_content_length: 500mbhttps://www.elastic.co/guide/en/elasticsearch/reference/current/modules-network.html
- Secondly: Split large files into multiple smaller files.
For example, split packets.json into multiple smaller files with 20,000 lines as a unit in a Linux environment.
Code language: javascriptCopy
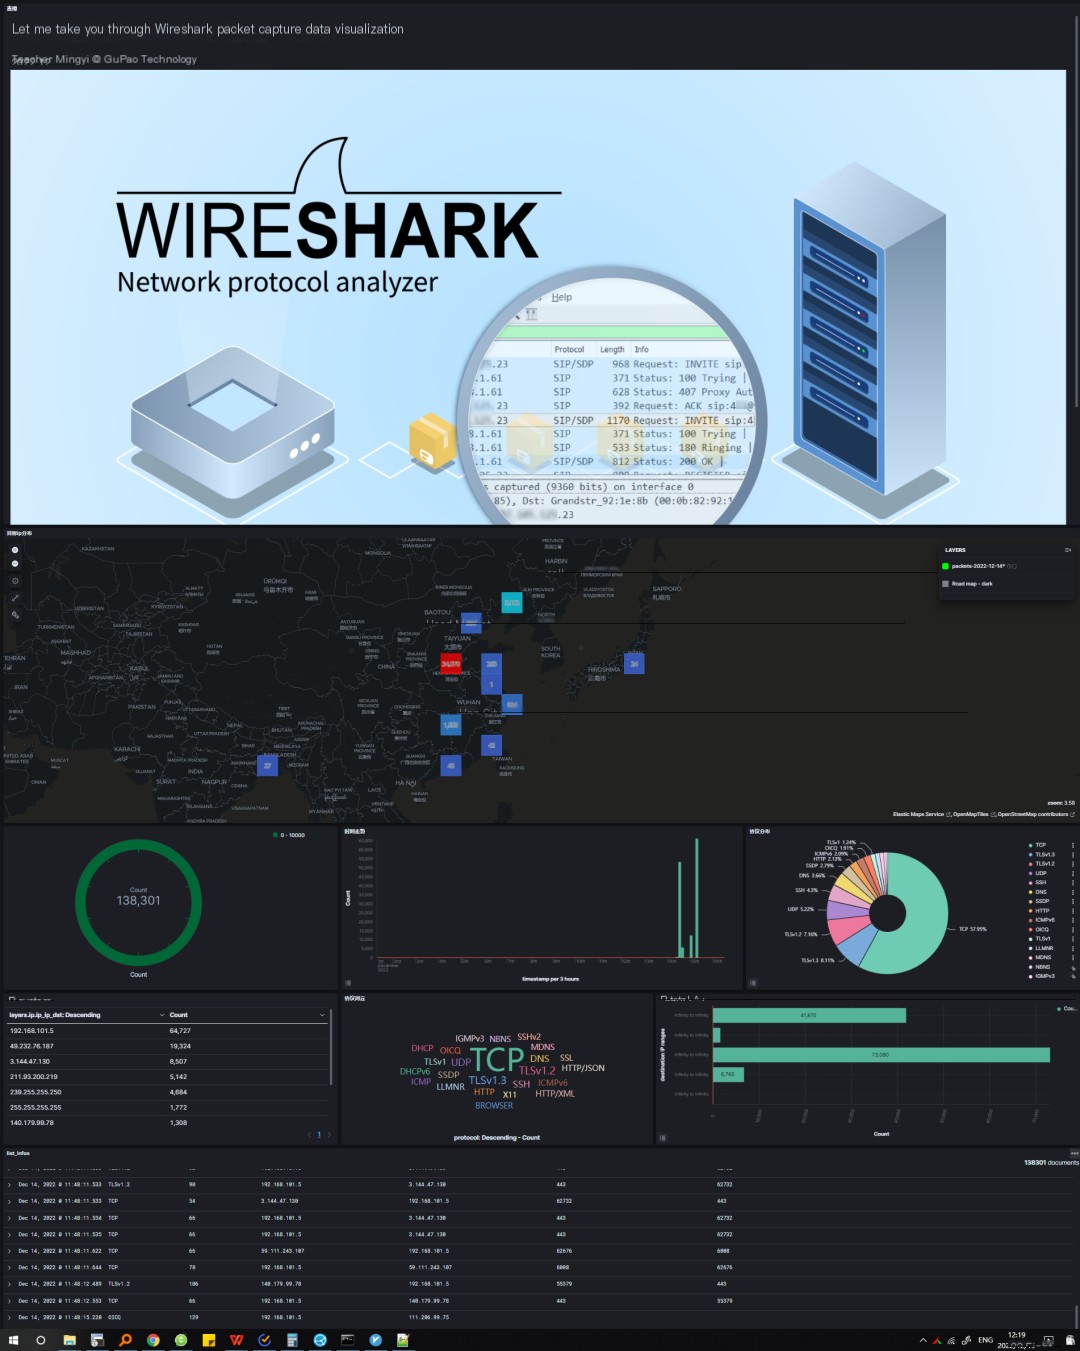
split -l 20000 packets.json 8. Wireshark Data Visualization
With the previous work, this step is just work volume. The practical effect is as follows:
9. Summary
- Big data is around us; capturing data with Wireshark for a week can practically fill the disk.
- I faced many challenges and took numerous detours. For example, issues with tshark versions, insufficiency of tshark packet formats for synchronization, selection issues of real-time data synchronization tools, issues with streamlined data modeling, etc.