

WSL2 Environment Preparation
I am using the WSL2 environment on Windows 10.
- Install tcpdump and netcat under WSL2
- Install Wireshark
The basic process in the example below is:
- Start tcpdump to capture packets, and write the capture results into a file
- Use netcat to start a simple TCP listening service
- Then use netcat to connect to this service, send several data packets, allowing tcpdump to capture traffic
- Use Wireshark on Windows to analyze the detailed data of the packets
Constructing an Example
Enter the WSL2 environment and use ifconfig to check network card information:
Code language: shellCopy
xiang@MSI:/mnt/c/Users/xiang$ ifconfig
eth0: flags=4163<UP,BROADCAST,RUNNING,MULTICAST>  mtu 1500
        inet 172.29.184.251  netmask 255.255.240.0  broadcast 172.29.191.255
        inet6 fe80::215:5dff:fe5e:ed92  prefixlen 64  scopeid 0x20<link>
        ether 00:15:5d:5e:ed:92  txqueuelen 1000  (Ethernet)
        RX packets 2091  bytes 306842 (306.8 KB)
        RX errors 0  dropped 0  overruns 0  frame 0
        TX packets 79  bytes 6426 (6.4 KB)
        TX errors 0  dropped 0 overruns 0  carrier 0  collisions 0
lo: flags=73<UP,LOOPBACK,RUNNING>  mtu 65536
        inet 127.0.0.1  netmask 255.0.0.0
        inet6 ::1  prefixlen 128  scopeid 0x10<host>
        loop  txqueuelen 1000  (Local Loopback)
        RX packets 371  bytes 4049004 (4.0 MB)
        RX errors 0  dropped 0  overruns 0  frame 0
        TX packets 371  bytes 4049004 (4.0 MB)
        TX errors 0  dropped 0 overruns 0  carrier 0  collisions 0
Since we will test directly on 127.0.0.1 later, we only need to listen to this IP’s data.
Code language: shellCopy
sudo tcpdump -i lo # Add -w filename to write the captured content to a file; you can first view the results on the command line without writing to a fileEnter WSL2, execute the command, and start a TCP service listening on port 8000.
Code language: shellCopy
nc -l 8000Open a new WSL2 window, execute the command, and connect to the machine’s port 8000
Code language: shellCopy
nc 127.0.0.1 8000Now, we see output under tcpdump:
Code language: shellCopy
12:07:24.920952 IP localhost.47152 > localhost.8000: Flags [S], seq 2397915828, win 65495, options [mss 65495,sackOK,TS val 2047998107 ecr 0,nop,wscale 7], length 012:07:24.920972 IP localhost.8000 > localhost.47152: Flags [S.], seq 3312485390, ack 2397915829, win 65483, options [mss 65495,sackOK,TS val 2047998107 ecr 2047998107,nop,wscale 7], length 012:07:24.920979 IP localhost.47152 > localhost.8000: Flags [.], ack 1, win 512, options [nop,nop,TS val 2047998107 ecr 2047998107], length 0This is the TCP three-way handshake:
01 Port 47152 on the local machine sends a SYN flag data packet to port 8000 on the local machine
- [S] represents SYN
- seq represents the initial sequence number of the client
- win is the advertised window size
- options include
- mss, the Maximum Segment Size of TCP
- sackOK indicates support for sack feature
- wscale is 7, indicating that the actual advertised window size is the win value multiplied by 2 to the power of 7. This feature is added in TCP options to facilitate high-speed transmission as the TCP header’s advertised window size is only 16bit, with a maximum of 65536, inadequately utilizing bandwidth in high-speed networks
- TS val is the timestamp of the current TCP segment (not an actual timestamp, but merely to distinguish when the packet is created, preventing it from being received)
- ecr – Echo Reply, is the TS val of the previous packet. Here it is 0 as this is the first SYN
- nop is padding for alignment with no actual significance
- length 0, indicating no actual data is transmitted
02 The server on port 8000 sends an ACK response to SYN and also sends SYN
- [S.] represents SYN + ACK
- seq is the server’s initial sequence number
- ack is the client’s initial sequence number +1
- …
- options
- sackOK indicates that the server supports sack as well, enabling communication using sack feature
- ecr is the TS val value from the previous packet
03 The client’s third ack
- [.] represents ACK
We type hello in the nc client and press enter. The server will receive hello, and tcpdump data:
Code language: javascriptCopy
12:34:34.016955 IP localhost.47152 > localhost.8000: Flags [P.], seq 1:7, ack 1, win 512, options [nop,nop,TS val 2049627203 ecr 2047998107], length 612:34:34.017003 IP localhost.8000 > localhost.47152: Flags [.], ack 7, win 512, options [nop,nop,TS val 2049627203 ecr 2049627203], length 001 The client sends hello
- [P.] represents PUSH + ACK, indicating the client is pushing data to the server
- seq 1:7 indicates the bytes of data sent
- The actual seq value is not 1:7; the TCP client subtracts the initial sequence number for easier viewing
- The win here is 512, and the actual advertised window size is 512 * 2^7 (7 is the wscale from the handshake) = 65536
02 The server’s ack
Press ctrl + c on the nc client to disconnect. tcpdump data:
Code language: javascriptCopy
12:43:32.214698 IP localhost.47152 > localhost.8000: Flags [F.], seq 7, ack 1, win 512, options [nop,nop,TS val 2050165400 ecr 2049627203], length 012:43:32.214879 IP localhost.8000 > localhost.47152: Flags [F.], seq 1, ack 8, win 512, options [nop,nop,TS val 2050165401 ecr 2050165400], length 012:43:32.214949 IP localhost.47152 > localhost.8000: Flags [.], ack 2, win 512, options [nop,nop,TS val 2050165401 ecr 2050165401], length 0There’s only a three-way handshake! Therefore, TCP disconnection is generally a four-way handshake. Here it is three because steps 2 and 3 are combined traditionally.
01 The client initiates disconnection by sending FIN + ACK
02 The server receives it and sends ACK (=client seq+1) and FIN (since the server has no data to send, it combines them)
03 The client sends the last ack
Analyzing Packet Details
The output of tcpdump in the command line is only a brief overview. To view the entire data packet content, you can first write the packet to a file and then analyze it with Wireshark.
Use the command to monitor the lo network card and write into the dumpexample file.
Code language: shellCopy
sudo tcpdump -i lo -w dumpexampleFollow the above steps: start listening, connect, send hello, and disconnect.
Then stop monitoring in dumpexample by ctrl+c to obtain the dumpexample file.
Open the file with Wireshark.
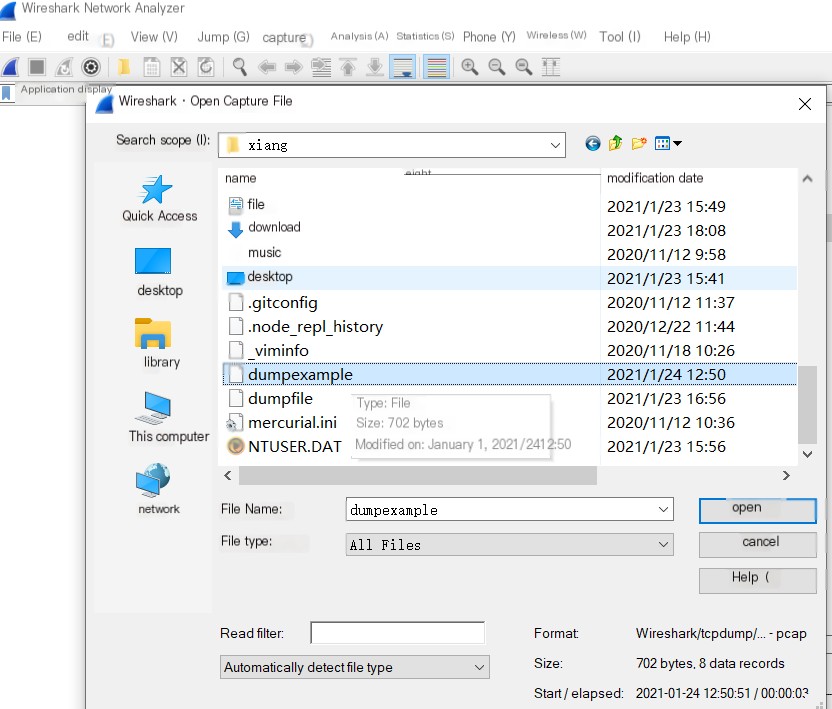 />
/>
You can see very detailed information about each request, including the data link layer header, the network layer header, and the complete TCP layer header.
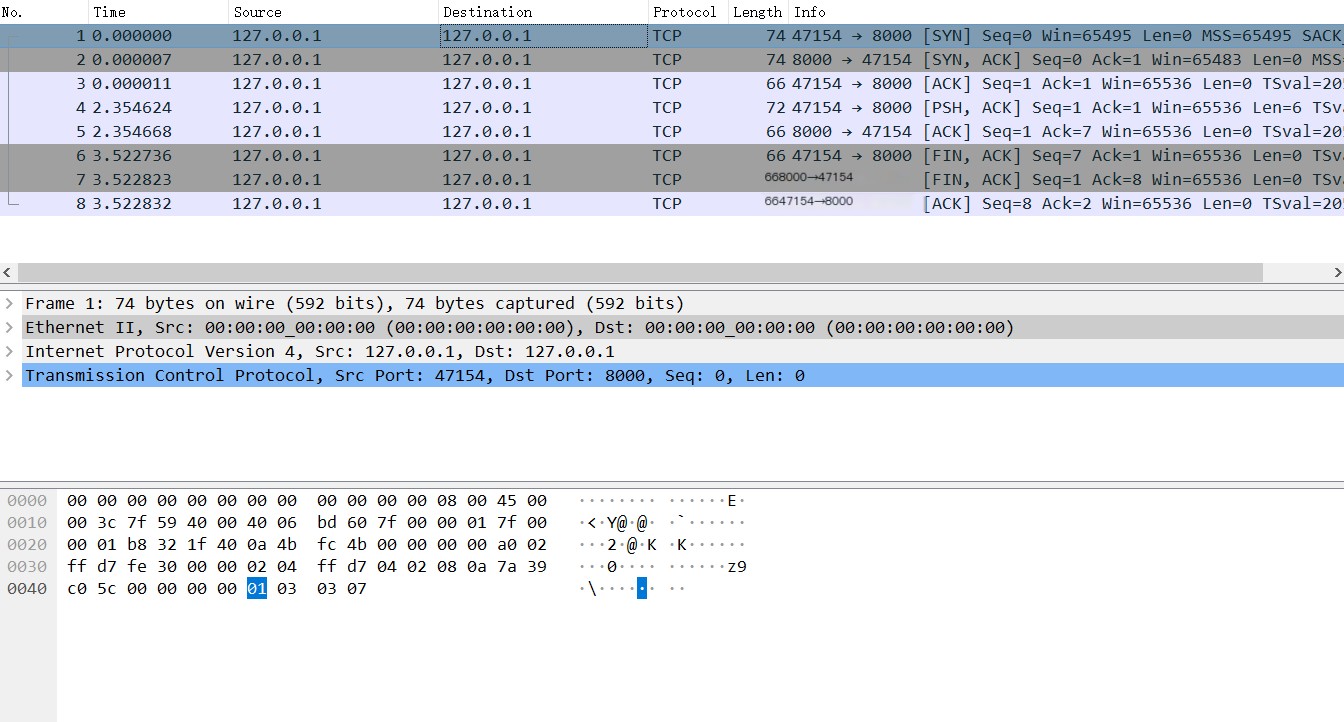 Dump the request content
For example, this time’s three-way handshake’s flag changes:
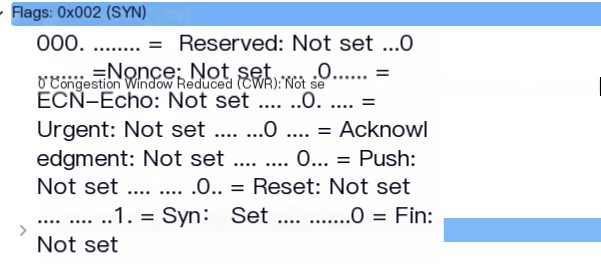 Handshake 1: SYN
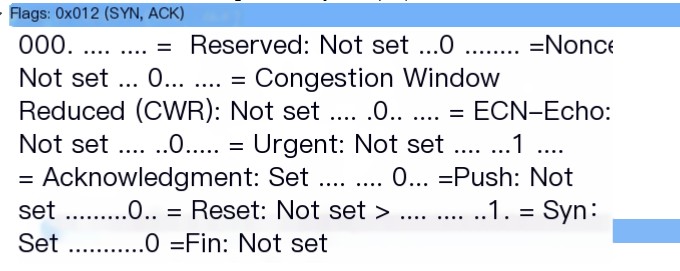 Handshake 2: ACK + SYN
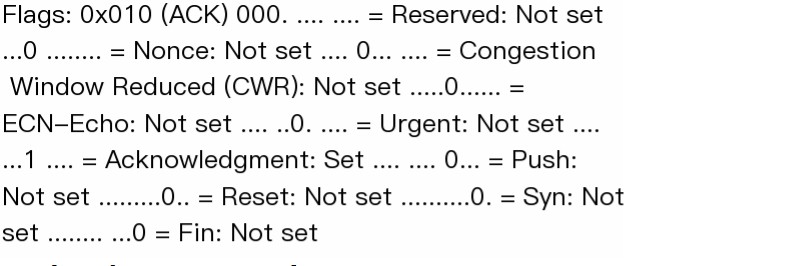 Handshake 3: ACK
These are the flag changes during the three-way closing:
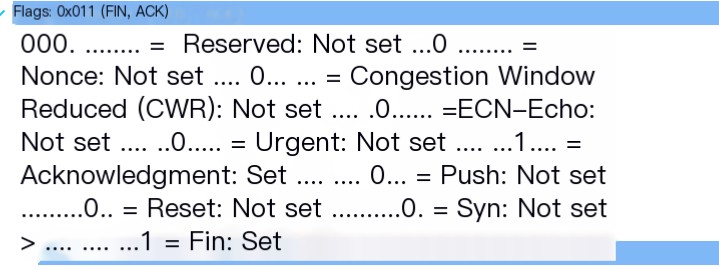 Closing 1: FIN
 Closing 2: ACK + FIN
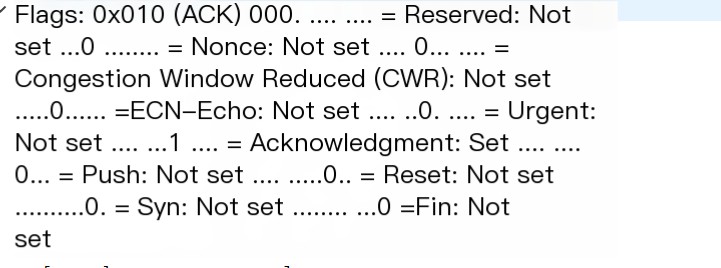 Closing 3: ACK
This is the message for sending the hello data:
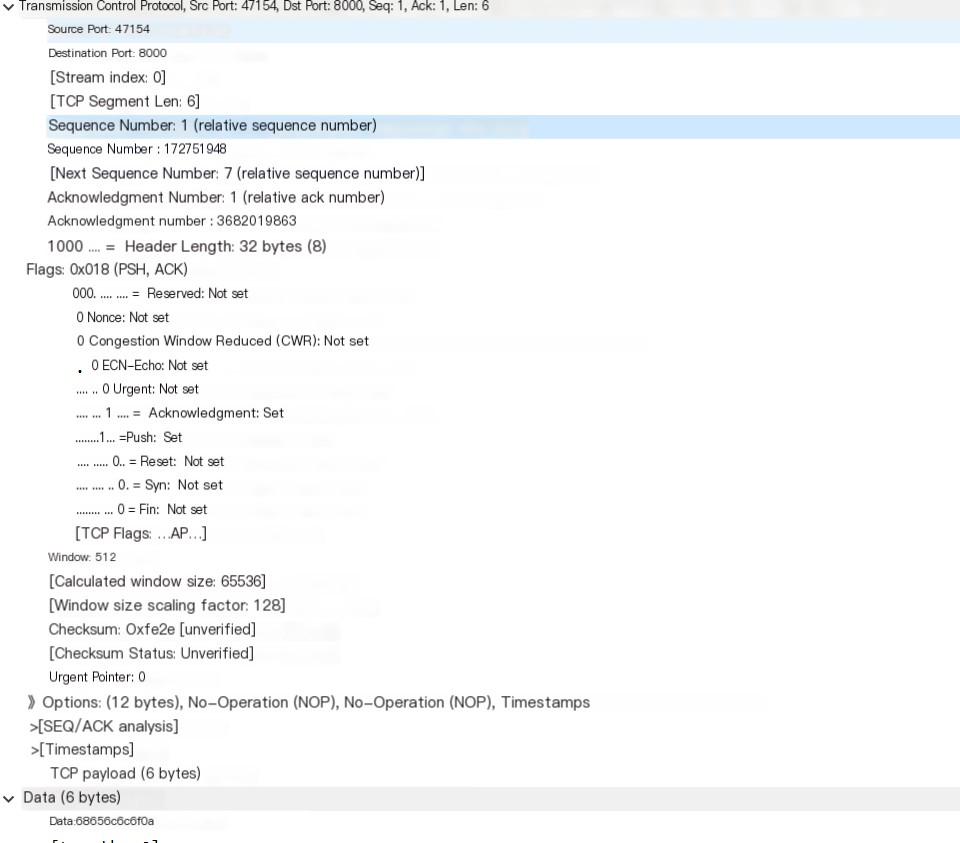 TCP partial data
Conclusion
Using netcat, tcpdump, and Wireshark allows easy construction of TCP requests, and monitoring and analyzing TCP packets. (netcat -u specifies UDP sockets)
Analyzing real TCP packets provides insightful observations into the detailed workings of TCP.
The above is just a simple example, with many TCP technical points not addressed, such as:
- Using nc host port < filename can request with the filename content; if the file is large enough, you can see TCP requests segmented according to MSS
- You can observe changes in the advertised window during data transmission, including when it drops to 0
- During nc transmission, forcibly ending with ctrl+c will send a packet with the RST flag, immediately disconnecting the connection
Practice is the sole criterion for testing truth. Give it a try.