In everyday work, performance issues with requests often arise. These can occur at any stage: client-side, network, or server-side. We generally need to use packet capture to pinpoint where the problem lies. This article briefly introduces a small technique that can quickly list the time used by all HTTP request headers, helping identify requests with abnormal time consumption and further analyze the cause of the issue.
1. Use Wireshark to open the packet capture file and enter “http” in the filter to filter out all HTTP requests.
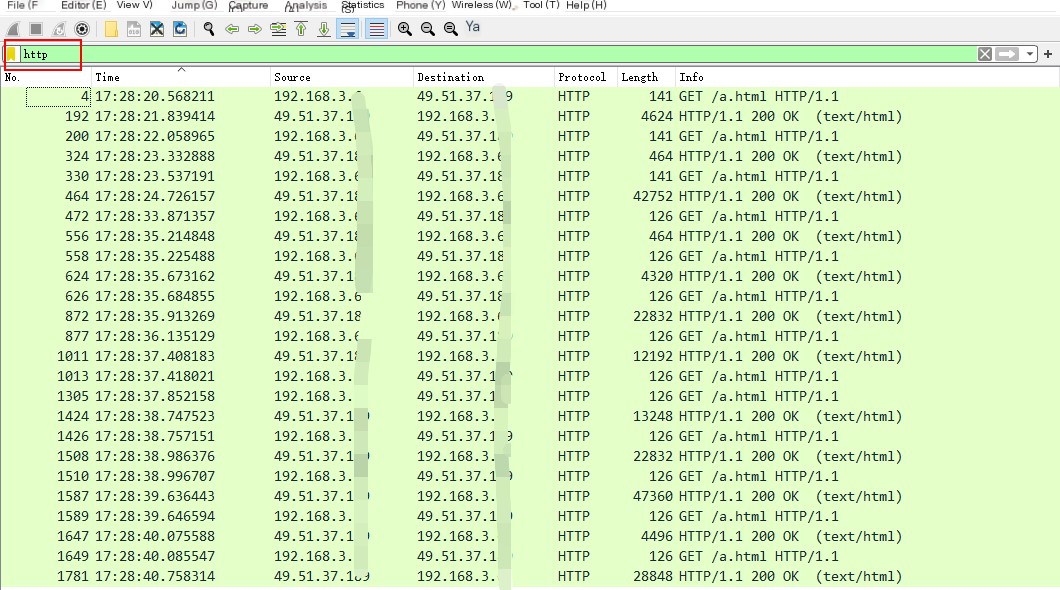 >Filter out HTTP requests
2. Right-click at the position shown in the picture below and open “Column Preferences.”
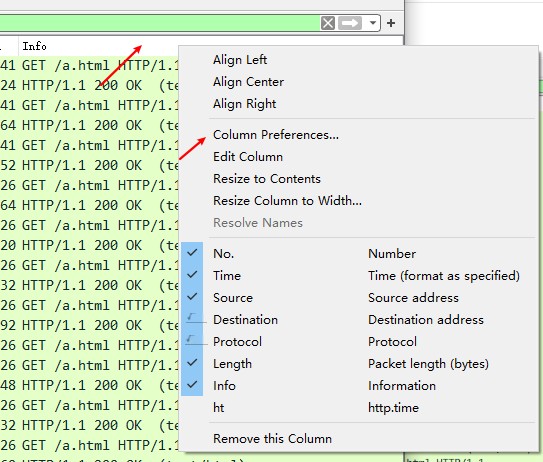 >Open column configuration
3. Add a custom field http.time.
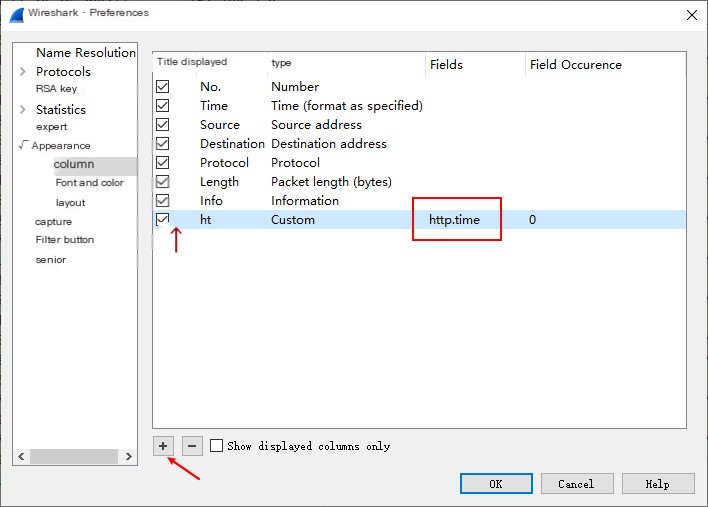 Add designated field http.time
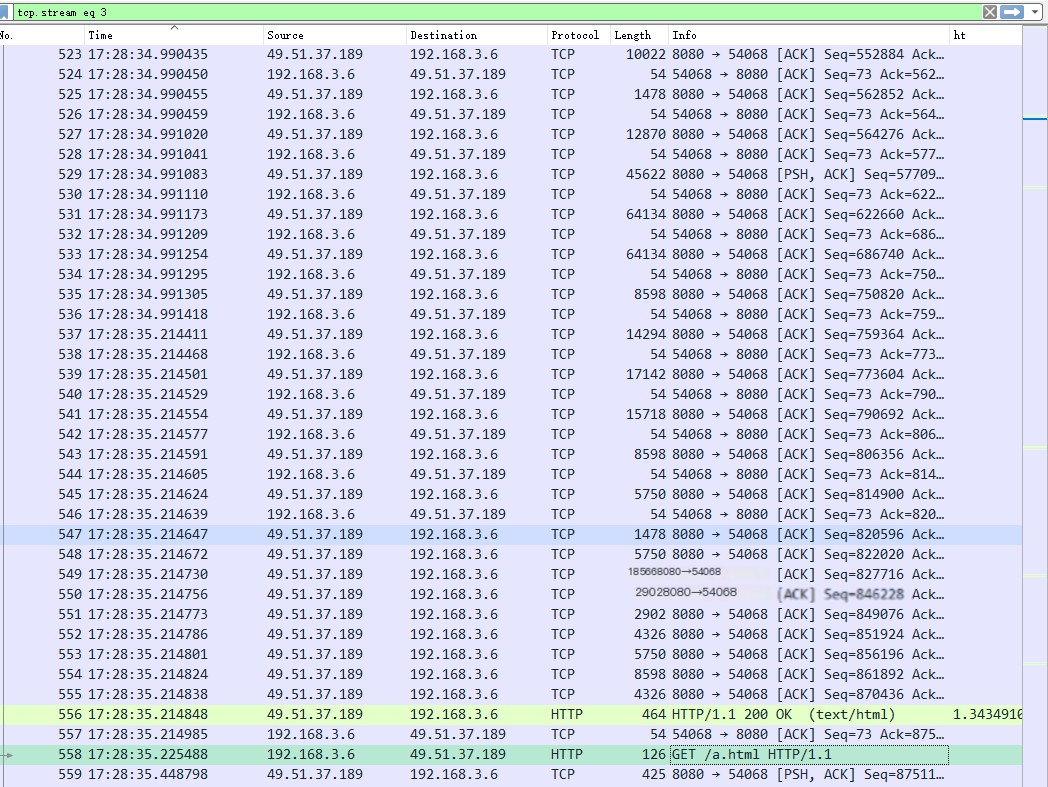
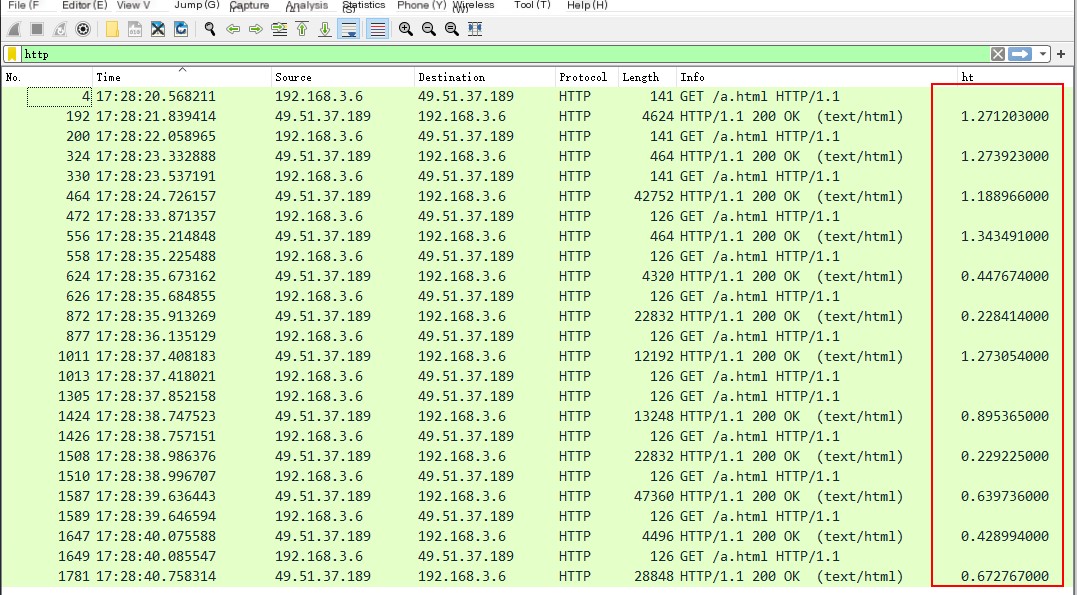
4. As shown in the picture below, each response header now has the request’s response time appended.
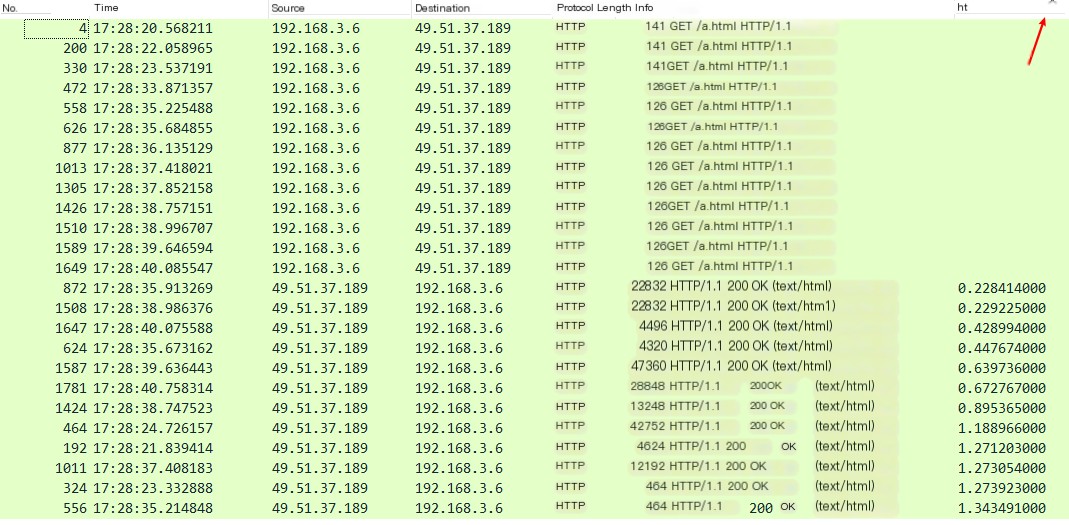
5. You can sort the field by clicking the respective column as needed, for example, clicking the http.time field to find the maximum and minimum response times.
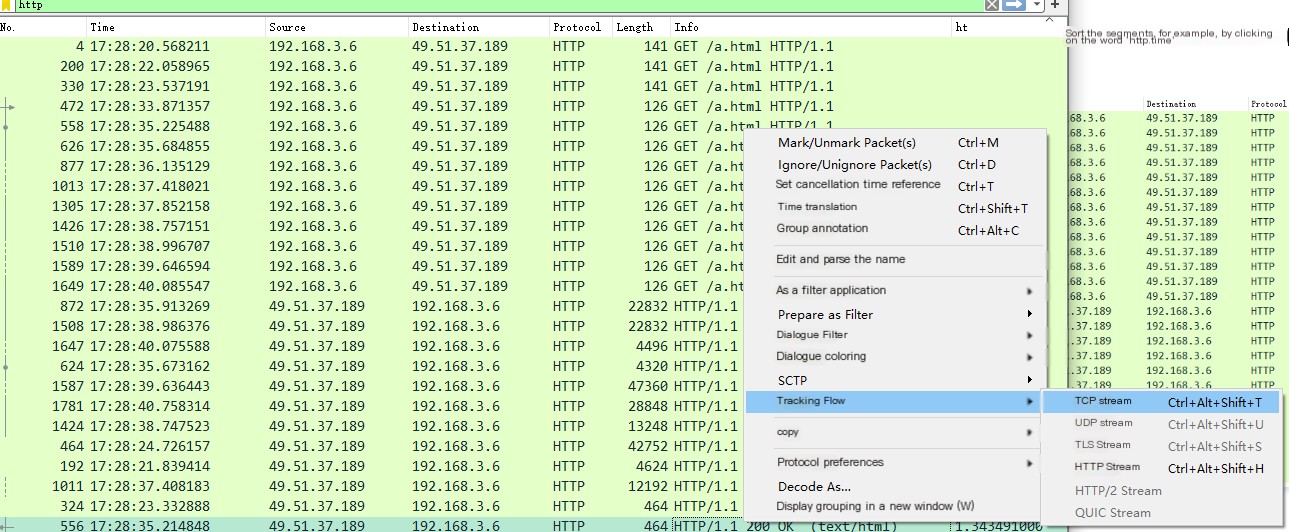
6. Finally, find the stream you are interested in and filter it through the final stream for detailed analysis.
 Locate TCP stream through the final stream
It can be seen here that this request is a single request within a long TCP connection.