I. Background
Operations Monitoring Tools are vital for ensuring the smooth functioning of business processes. These tools enable organizations to track, analyze, and optimize operations in real time, leading to increased efficiency and reduced downtime. By leveraging Operations Monitoring Tools, businesses can proactively identify potential issues and address them before they affect performance.
If operations engineers do not have effective management tools at their disposal, it becomes challenging to rapidly handle failures. There are numerous operations monitoring tools available on the market, such as the commercial versions of Solarwinds, ManageEngine, and WhatsUp, as well as open-source options like MRTG, Nagios, Cacti, Zabbix, OpenNMS, Ganglia, etc.
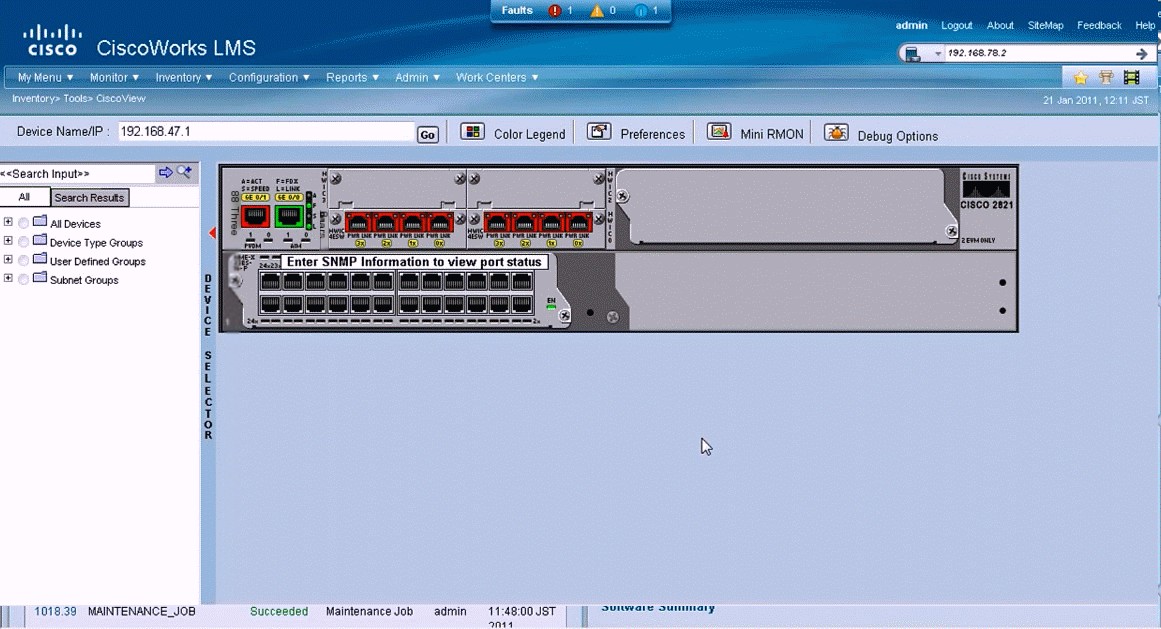 Traditional Network Management Software
Because the data generated by these tools lacks interconnection and cannot be shared, even if these tools are deployed, many operations personnel do not truly get relieved, with thousands of alert messages piling up, making it difficult to identify the root cause of issues and instead getting overwhelmed by the log deluge.
Furthermore, in a traditional operations environment, checking various monitoring systems requires multiple logins, viewing numerous interfaces, and most update management work is manual. Even for a simple system change, operations personnel have to log in to each system one by one. If problems arise, administrators may resort to searching keywords across various platforms manually, continuously repeating this working model. Enterprises need an integrated and secure operations platform that meets professionalization, standardization, and streamlined needs to achieve automated management of operations work, and quickly identify potential faults through correlation analysis. Such an excellent open-source platform is called OSSIM, which stands for Open Source Security Information Management; let’s get acquainted with the basic structure and components of OSSIM.
In terms of architecture, the OSSIM system is an open framework. Its core value lies in innovatively integrating the strengths of various open-source software. Its modules include both C/S architecture and B/S architecture, but as the end-user, mastering the OSSIM WebUI, which primarily adopts the B/S architecture is key. The web server uses Apache. The OSSIM system’s structural diagram appears in Figure 1.
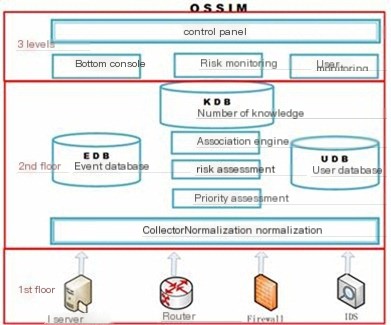
Figure 1 OSSIM System Structure
Layer 1 belongs to the data collection layer, utilizing various collection technologies to gather traffic information, logs, and various asset information which, after normalization, are transferred to the core layer. This layer reflects the sources of security events; intrusion detection, firewall, and critical host logs are all sources of security events. They are divided into two categories based on their emission mechanism: pattern detectors and anomaly monitoring (both gather warning information and serve complementary functions). The security events they collect are then converted by an Agent into a unified format and sent to the OSSIM server. This is the content that the Sensor needs to complete at this layer.
Layer 2 belongs to the core processing layer, focusing on in-depth processing of various data, including operational monitoring, security analysis, policy management, risk assessment, correlation analysis, security object management, vulnerability management, event management, report management, etc. Within this layer, the OSSIM Server plays a central role. Its primary function is the centralization of security events and the correlation analysis, risk assessment, and significance annotation of these centralized events. Centralization refers to organizing all system-generated security event alert information (Alarms) into a unified format and storing all network security event alerts into a database, thereby completing a comprehensive view of events occurring within the network. The system enhances its ability to identify false positives and detect attacks better through event sequence correlation and heuristic algorithm correlation.
OSSIM essentially processes alerts produced by various detectors and monitors in a formatted manner, followed by correlation analysis. These subsequent processes enhance detection performance by reducing the number of alerts and relieving the burden on the correlation engine, thereby improving the overall quality of alerts.
Layer 3 belongs to the data presentation layer, mainly responsible for completing the interaction with the user, achieving a unified display of security warnings and event monitoring, security operation monitoring, and comprehensive analysis in a graphical form presented to the user. The Web framework (Framework) console interface is the OSSIM Web UI (Web User Interface), serving as the external portal of the OSSIM system. It mainly consists of parts like dashboards, SIEM consoles, Alarm consoles, asset vulnerability scan management, reliability monitoring, reports, and system policies.
II. Relationship between Main Modules
The OSSIM system primarily uses four programming languages: PHP, Python, Perl, and C. From a software perspective, the OSSIM framework system comprises five main modules: Agent module, Server module, Database database module, Frameworkd module, and Framework module, with the logical structure illustrated in Figure 2.
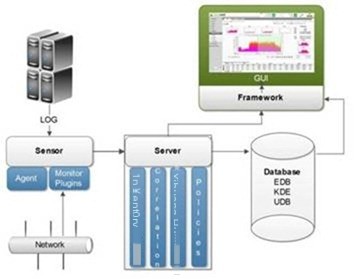 Figure 2 OSSIM System Logical Structure
The data flow between the five modules above is shown in Figure 3:
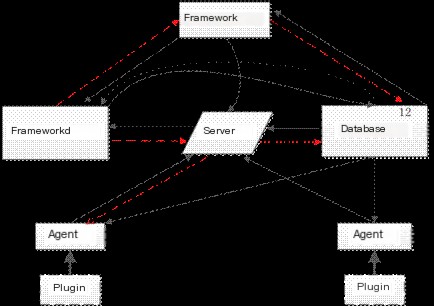 Figure 3 Data Flow of the Five Major Modules
① From Agent to Server: Security events from various sensors are formatted by the corresponding Agent and sent to the Server as encrypted strings.
② From Server to Agent: Sending request commands in string form to Agents, mainly requesting the Agent to start/stop plugins and retrieve information.
③ From Server to Frameworkd: Sending request commands, asking Frameworkd to take corresponding actions for the Alarm, such as executing external programs or sending emails to notify administrators.
④ From Framework to Server: Sending request commands to the Server, requesting the Server to notify the Agent to start/stop operations of plugins (Plugins).
⑤ From Framework to Frameworkd: Sending request commands, asking Frameworkd to start OpenVas scanning processes.
⑥ From Frameworkd to Framework: Transmitting OpenVas scanning results for display on the frontend page.
⑦ From Database to Agent and Server: Providing data to the Agent and Server.
⑧ From Server to Database: The Server needs to store Events, Alarms, etc., into the database for indexing or updating operations.
⑨ From Database to Frameworkd: Openvas scanning and actions in Frameworkd need to invoke the data from the database.
⑩ From Frameworkd to Database: Openvas scan results stored in the database during the execution process in Frameworkd.
⑾ From Database to Framework: PHP page display needs to invoke alarm event data from the database.
⑿ From Framework to Database: User parameter setting information needs to be stored in the database.
III. Security Plugins
The plugins are abundant in OSSIM, beyond your imagination, and can roughly be divided into Collection and Monitor plugins. Each plugin is further subdivided into ID and SID. Collection plugins primarily collect data through protocols like SNMP, Syslog, WMI, etc. Commonly seen collection plugins in the Sensor include ossec-single-line, ssh, syslog, wmi-system-logger, etc., among which SNMP and WMI protocols require the Agent to actively capture the collected data; the Syslog protocol passively receives collected data, specifically shown in Figure 4.
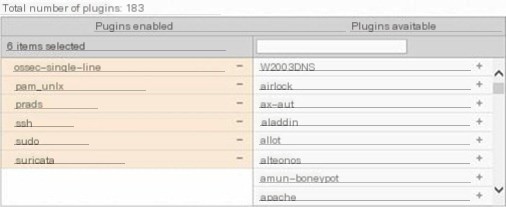 Figure 4 Viewing Plugins
Monitor plugins include malwaredomainlist, nessus, nmap, ntop, ocs, ossim, etc., as shown in Figure 5.
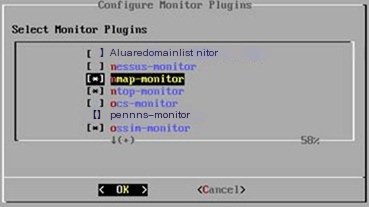 Figure 5 Setting Monitor Plugins
After these plugins are loaded, we can go to the Web UI under Configuration→Deployment→Components→Sensors where “Sensor Status” is to view the working status of the added monitor plugins, as shown in Figure 6. Figure 6 Viewing Sensor Monitor Plugin Working Status
Note: The monitor serves as the “supervisory team,” and if anyone (critical service process) “goes on strike,” it will restart the process within the set time to protect critical processes.
In the UNIX/Linux environment, most systems are equipped with SNMP and Syslog tools. If the target system from which data is to be collected is Windows, consider using the WMI protocol, in which only configuration is required on Windows to allow remote access without needing to install extra tool software.
IV. Differences between Collection and Monitor Plugins
In the OSSIM system, the Sensor end includes both Collection and Monitor plugins collectively referred to as security plugins, which are all installed on the Sensor. Although both are called plugins, their working principles differ. Detector plugins generate information after detection, which is automatically sent to the server by the agent, including Snort, Apache, etc. In contrast, detector plugins actively collect information on security devices’ interfaces. Such plugins can be divided into Snort, P0f, Prads, Arpwatch, Apache, SSH, Sudo, etc.
Monitor plugins, on the other hand, require servers to actively initiate query requests. Monitor plugins have defined the security device interfaces that need to be actively collected. This module receives commands and queries from the control center. Typical Monitor plugins in the OSSIM system include Ntop, Nmap, Nessus, etc. Readers can view the Configure Monitor Plugins in the Sensor configuration from the Alienvault console. The main security plugins of OSSIM are shown in Table 1.
Table 1 OSSIM Main Plugin Distribution
|
Category |
Function |
Plugin Names |
|---|---|---|
|
1 |
Access Control |
csico-acs, cisco-acs-idm, cisco-asa |
|
2 |
Antivirus |
Avast, gfi security, mcafee, clamav |
|
3 |
Firewall |
fw1-alt, cisco-pix, ipfw, m0n0wall, netscreen-igs, Motorola-firewall, iptables, pf(openbsd project) |
|
4 |
HIDS |
Ossec, ossec-single-line Osiris |
|
5 |
Load Balancing |
Allot, cisco-ace, citrix-netscaler, f5, heartbeat |
|
6 |
Network Monitoring |
ntop-monitor, p0f, prads, session-monitor, tcptrack-monitor |
|
7 |
Virtualization |
vmware-esxi, vmware-vcenter, vmware-vcenter-sql |
|
8 |
Vulnerability Scanner |
Nessus, Nessus-detector, Nessus-monitor |
Explanation of OSSIM plugin location: During installation, the system will copy all the supported plugins to the directory /etc/ossim/agent/plugins/, such as the Nagios plugin, which is a text file with the “.cfg” extension that can be modified with any editor. In each plugin configuration file, the most challenging part to understand is the regular expression (RegExp). The main plugins under OSSIM are as shown in Figure 7.
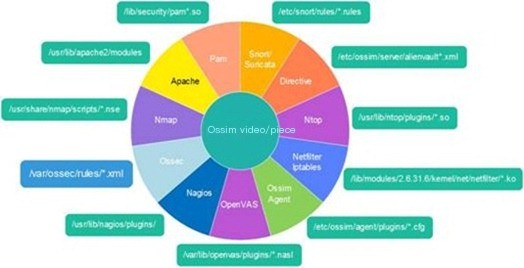 Figure 7 Rules and Plugin Path
In future installation processes, the number of plugins selected will determine how many are loaded at boot time (the more plugins loaded, the more memory it occupies). To view plugin details specifically, visit the /etc/ossim/agent/config.cfg configuration file, and in the system’s /etc/ossim/ossim_setup.conf file, the [sensor] section also lists the monitor plugins and detector plugins to see what each contains. Regarding plugins, OSSIM by default provides over a hundred plugins, covering 8 major categories, of which only a small portion is listed in Table 1-2. From the distribution and quantity of plugins, the OSSIM system almost covers the common plugin types. For example, operational devices like Cisco, CheckPoint, F5, Fortigate, Netscreen, Sonicwall, Symantec, etc. If the plugin for an unrecognized device is not detected, writing one’s own plugin is the only option, which will be discussed in detail in subsequent sections. The loaded plugins are as shown in Figures 8 and 9.
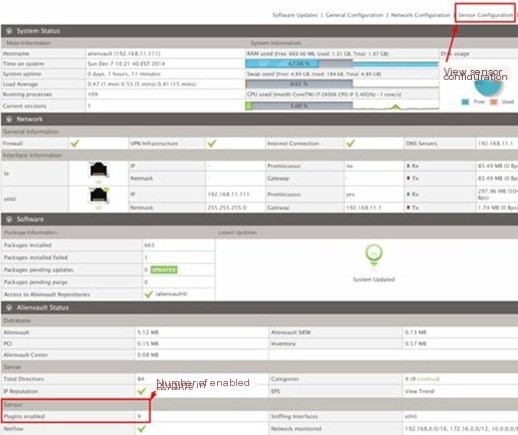 Figure 8 View Sensor-Enabled Plugins
As can be seen in Figure 8, this Sensor system enabled 9 plugins. How is this displayed on the Web? As shown, there are a total of 184 plugins, and 9 plugins were enabled in “Plugins enabled.”
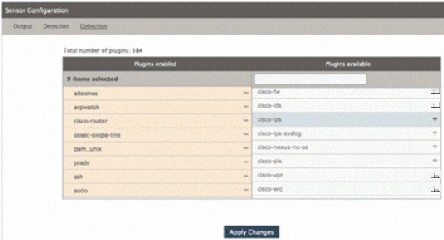 Figure 9 View Loaded Plugin Details
Figure 10 also shows where 9 plugins are displayed, and we can open the /etc/ossim/ossim_setup.conf file to view it.
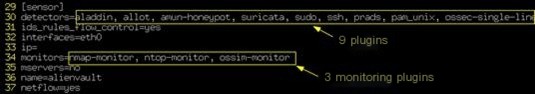 Figure 10 View Plugins from Ossim Configuration File
V. Detectors
Detectors in OSSIM play a role in collecting resource information and listening to data packets on the current network segment, mainly including ntop, prads, suricata, ossec, etc. The related content will be detailed in subsequent chapters.
VI. Agents
Agent processes (as the Agent is written in Python, it can run in a Python Shell environment without compilation) will run on multiple hosts, responsible for collecting relevant information (such as alarm logs) from security devices and unifying the formats of the collected various information before transferring this data to the Server.
In terms of collection method, the Agent is actively collecting and can be pictorially understood as “eyes and ears” assigned by the OSSIM Server in each monitored network segment, collecting data and actively pushing it to the Collector, which then connects to the message queuing system, cache system, and storage system.
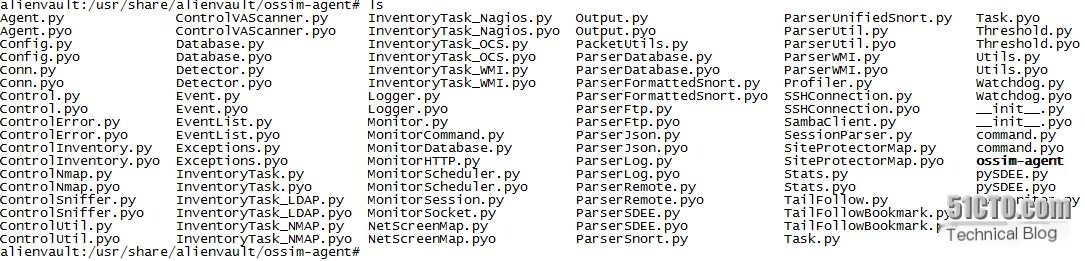
The agent scripts in OSSIM are located under /usr/share/alienvault/ossim-agent/, the scripts are encrypted with the .pyo extension.
For example, the OSSIM agent (ossim-agent) directly reads the log stored in /var/log/suricata/unified2.alert.1428975051.
The alarm output file for suricata is /var/log/suricata/unified2.alert, which is defined for use with Barnyard2 by /etc/suricata/suricata.yaml configuration file line 111 # alert output.
The primary function of the Agent is to receive or capture logs sent or generated by Plugins, handle them with normalization, then orderly transmit them to the OSSIM Server. Its functionality is complex as its design must take into account possible scenarios like network interruption, congestion, packet loss, etc., between the Agent and the Server.
In the free version of the OSSIM system, the real-time processing of logs is often not possible, but near real-time (Firm Real-Time) can usually be achieved. Typically, logs are buffered on the Agent side for a period before being sent to the Server side. The Agent actively connects two ports for external communication: one connects to the Server’s 40001 port (the communication port set in the [output-server] option in the /etc/ossim/agent/config.cfg configuration file shows as 40001), and the other connects to the database’s 3306 port, as shown in Figure 11.

Figure 11 Normalization, Log Collection, and Storage
The raw logs are divided into sections filled into respective fields, such as:
l date, sensor, interface, plugin_id, plugin_sid, priority, protocol, src_ip, src_port, dst_ip, dst_port
l username, password, filename, userdata1, userdata2, userdata3, userdata4, userdata5, userdata6, userdata7, userdata8, userdata9
In fact, the output data of the Sensor is the “raw material” input for the Ossim Server, and we can view the Sensor’s output on the WebUI. As shown in Figure 12.
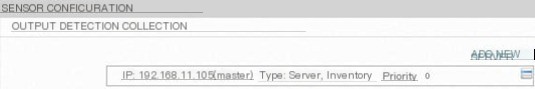 Figure 12 Sensor Output
VII. Alarm Format Decoding
During the reception of alarms, to handle changes in alarm formats, OSSIM uses regular expressions to match alarm messages and extract key information from the alarm events. Regular expressions are sequences of code that define text rules for matching. They are used for matching text patterns, such as blank characters, numeric characters, characters in multiple languages, IP addresses, and emails, basically serving as a text search string.
For example, a Snort alarm message can be matched using a regular expression:
5/26-01:02:17.670721 [**] [1:1419:9] SNMP trap udp [**] [Classification: Attempted Information Leak] [Priority: 2] {UDP} 20.20.13.17:162 -> 20.20.20.78:162
snort
net_socket
^(\d+/\d+-\d+:\d+:\d+).\d+\s+[**] [\d:(\d+):\d+] .+[Classification: (.+)]
[Priority: (\d)] {(.+)} (\d+.\d+.\d+.\d+)\p*(\d*)->(\d+.\d+.\d+.\d+)\p*(\d*)
time,id,classtype,priority,protocol,srcip,srcport,dstip,dstport
snort_classtype,snort_id
By using regular expressions, time, id, classification, alert level, protocol, source IP, source port, destination IP, and target port information can be extracted. These fields are then stored individually into a standardized table, eventually presented via the Web interface.
VIII. OSSIM Agent
The Agent runs in the Sensor, responsible for collecting relevant information (e.g., IIS service logs, Snort alarm logs, etc.) from plugins in various security devices and tools, standardizing the collected information, and transmitting it to the Server, for example, collecting and storing the alarm information generated by the Snort system in the OSSIM Server.
All scripts in the OSSIM Agent are written in Python. The related directory is /etc/ossim/agent/, the agent plugin directory is /etc/ossim/agent/plugins/, and the configuration file path is: /etc/ossim/agent/config.cfg. Information regarding the agent in the OSSIM system can be viewed through Analysis→Detection under the HIDS tab in Agents. The structure is as shown in Figure 13.
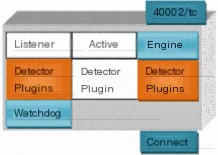 Figure 13 Agent Logical Structure
l 40002/tcp: Listens to the original requests from the server.
l Listener: Receives server connection requests.
l Active: Receives server input and performs host scanning based on requests.
l Engine: Manages threads and handles monitor requests.
l Detector Plugin: Reads logs and performs normalization.
l Monitor Plugin: Requests monitor data.
l DB-Connect: Connects to local/remote OSSIM database.
l Watchdog: Monitors startup/stop processes of plugins, checks if each plugin has started running, and restarts processes if abnormalities are detected. It auto-checks every 180 seconds and restarts at 3600-second intervals, which can be modified in the /etc/ossim/agent/config.cfg configuration file.
Note: The OSSIM system not only introduces HIDS (implemented via OSSEC) but also NIDS (implemented via Suricata), because host-based intrusion detection systems alone cannot completely fulfill network security needs. NIDS captures and analyzes network packets and analyzes protocols. NIDS can be deployed in various network segments to monitor only the monitored segments without affecting network operations. However, as a Sensor, it has the drawback that if network traffic exceeds the threshold, packet loss will occur.
Most plugins defined in OSSIM have their logs stored by default in /var/log/syslog, so custom plugins often require modifying the log storage locations. Detailed examples will be explained in later chapters.
Table 2 Plugin Log Path
|
OSSIM Agent Plugins |
ID |
Log Location |
|---|---|---|
|
Apache |
1501 |
/var/log/apache2/access.log /var/log/apache2/error.log |
|
Arpwatch |
1512 |
/var/log/ossim/arpwatch-eth0.log |
|
Avast |
1567 |
/var/log/avast.log |
|
bind |
1577 |
/var/log/bind.log |
|
bluecoat |
1642 |
/var/log/bluecoat.log |
|
Cisco-asa |
1636 |
/var/log/cisco-asa.log |
|
Cisco-pix |
1514 |
/var/log/cisco-pix.log |
|
cisco-route |
1510 |
/var/log/syslog |
|
cisco-*** |
1527 |
/var/log/syslog |
|
Exchange |
1603 |
/var/log/syslog |
|
Extreme-switch |
1672 |
/var/log/extreme-switch.log |
|
F5 |
1614 |
/var/log/syslog |
|
fortigate |
1554 |
/var/log/fortigate.log |
|
Fw1ngr60 |
1504 |
/var/log/ossim/fw1.log |
|
gfi |
1530 |
/var/log/syslog |
|
heartbeat |
1523 |
/var/log/ha-log |
|
iis |
1502 |
/var/log/iisweb.log |
|
ipfw |
1529 |