Introduction
Suricata network detection is a tool used to inspect and process network traffic. It utilizes signature sets (rules) created by the community and defined by users. When it detects suspicious packets, Suricata can trigger alerts.
By default, Suricata stores log files in /var/log/suricata. Here is a basic introduction:
eve.json: One of Suricata’s most detailed and useful log files. The eve.json log format is JSON, recording event information generated by all installed detection engines and other modules, such as alerts, HTTP requests/responses, TLS handshakes, and SSH handshakes. Each event includes important metadata like timestamps, traffic interface, event type, source/destination IP and ports, protocol, and application information.
eve.log: Similar to eve.json but formatted as single-line text rather than JSON. This format might be more convenient if integrating Suricata with other logging aggregation systems.
fast.log: A simple text-format file containing basic information about service requests and responses in network traffic, such as protocol, port, source/destination addresses, and event counts. Unlike eve.json, fast.log is not as detailed but offers lightweight performance benefits during high traffic volumes.
stats.log: Contains data related to Suricata’s statistics, such as CPU usage, memory consumption, and processed packet/traffic volumes. This is typically used to monitor Suricata’s performance and health status.
The goal of this article is to import the eve logs generated by Suricata into Elasticsearch and use Kibana for visual display, rapid searching, querying, and analysis.
Basic Configuration
In this practical environment, we deploy Suricata on a dual-network card server and then configure the core switch to mirror network traffic ports to Suricata’s network card for traffic detection.
Configuration requirements: The more traffic inspected, the more resources need to be allocated to Suricata. We plan to use a 4-core CPU and 16GB of memory, with a 1T hard drive.
Prepare a machine with dual network cards – one for providing web services and background management, and the other for collecting traffic in promiscuous mode for monitoring.
Configure Network Card Promiscuous Mode
ifconfig // Execute to view network card name and MAC address, use the MAC address to determine which network card to monitor ifconfig ens224 promisc // Select the card to use for monitoring and execute the check again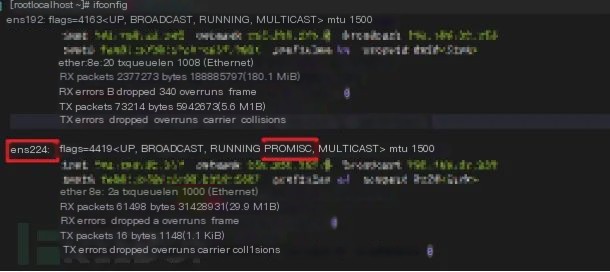
As shown in the above image, we plan to use the ens224 network card for traffic monitoring. Then, inform the network management team of the network card’s MAC address to enable traffic mirroring to your listening network card.
Next, use a utility tool to test the configuration results.
yum install dstat -y // Install dstat dstat -tnf // Check the traffic flow size of the two network cards, evaluating whether it was successfully enabled based on the values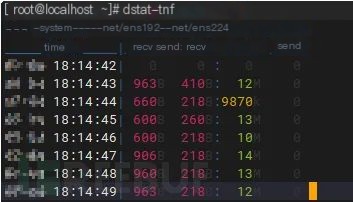
As shown in the image above, there is approximately 12MB of traffic received per second on the ens224 network card, which proves that the configuration is effective.
Configure Suricata
Edit Suricata’s configuration to change the network card name and configure it to monitor our traffic port mirror network card. For details, see the previous article.
# Linux high speed capture support af-packet: - interface: ens224 # Number of receive threads. "auto" uses the number of cores #threads: auto # Default clusterid. AF_PACKET will load balance packets based on flow. cluster-id: 99 (scroll to the right to see more)Elastic Stack Configuration
To ensure environmental consistency and stability, we use Docker to deploy the latest Elastic Stack 8.7. First, pull the image and create a Docker internal network.
docker pull docker.elastic.co/elasticsearch/elasticsearch:8.7.0 docker network create elastic docker pull docker.elastic.co/kibana/kibana:8.7.0 (scroll to the right to see more)Start Elasticsearch and mount eve.json to the Docker container.
docker run --name es-node01 --net elastic -d -v /var/log/suricata/eve.json:/var/log/suricata/eve.json -p 9200:9200 -p 9300:9300 -t docker.elastic.co/elasticsearch/elasticsearch:8.7.0(scroll to the right to see more)Start Kibana
docker run --name kib-01 --net elastic -d -p 5601:5601 docker.elastic.co/kibana/kibana:8.7.0(scroll to the right to see more)Access the management network card’s IP at your_ip:5601 (https), where a security token is required.
Previous Elasticsearch configurations did not enable any authentication, often leading to data breaches. The new es8.0 has now enabled xpack by default, making the configuration a bit more complex, but greatly improving security.
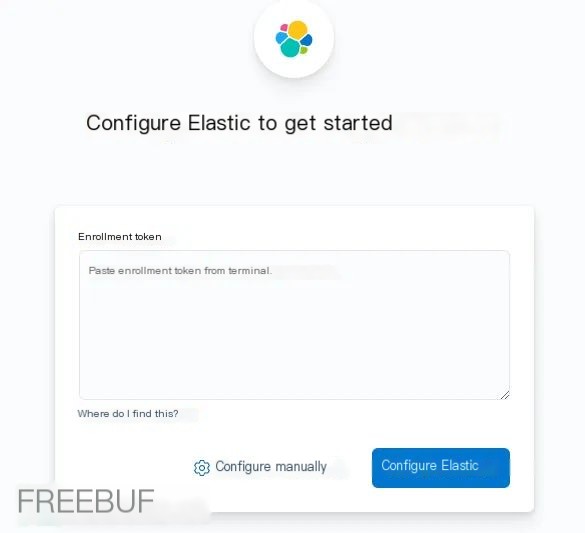
Execute on the host: docker exec -it es-node01 /usr/share/elasticsearch/bin/elasticsearch-create-enrollment-token -s kibana, enter the echoed output, and click configure elastic.
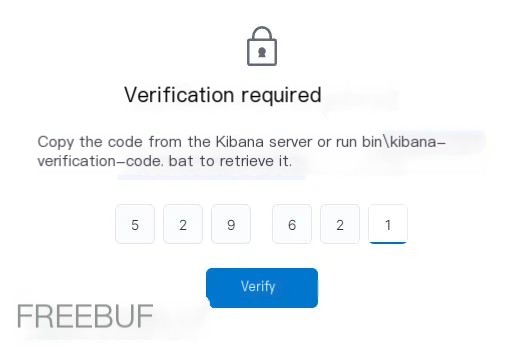
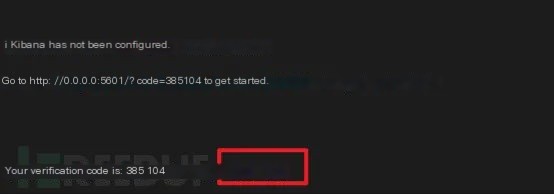
Then enter a 6-digit verification code, execute docker logs kib-01 on the host and enter the echoed output.
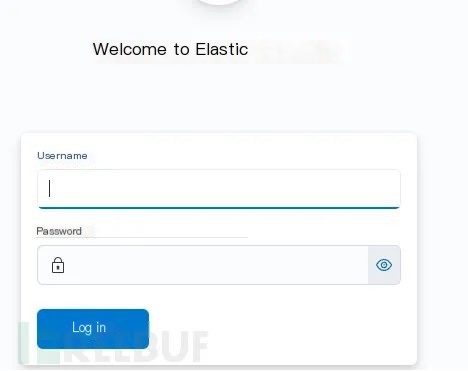
Then it prompts for a username and password
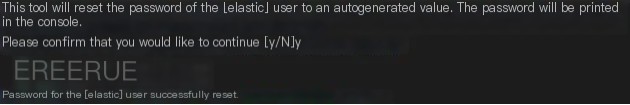
Execute on the host: docker exec -it es-node01 /usr/share/elasticsearch/bin/elasticsearch-reset-password -u elastic to get the username and password. This needs to be remembered.
Log in and enter Kibana.
Suricata Integration with Elasticsearch
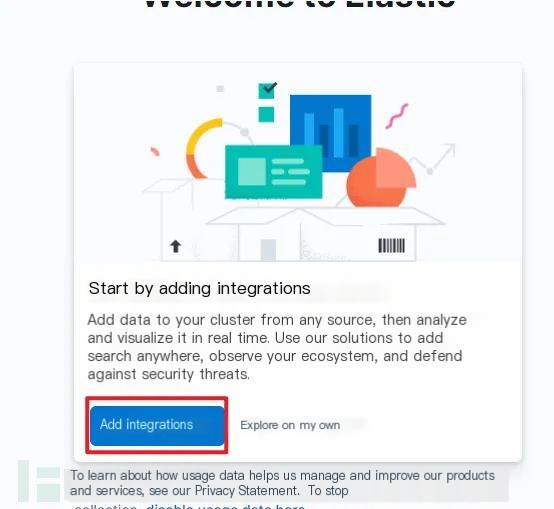
Click to add data
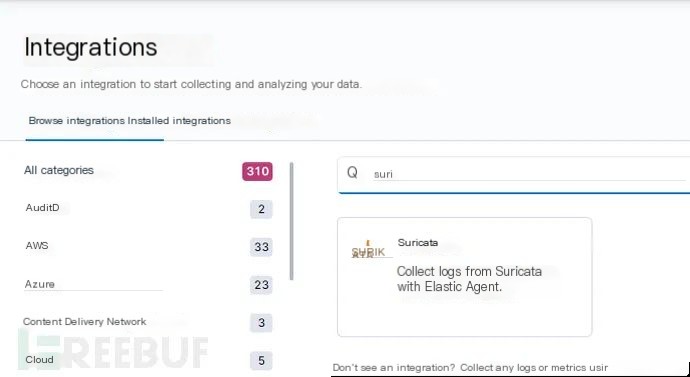
Search for Suricata
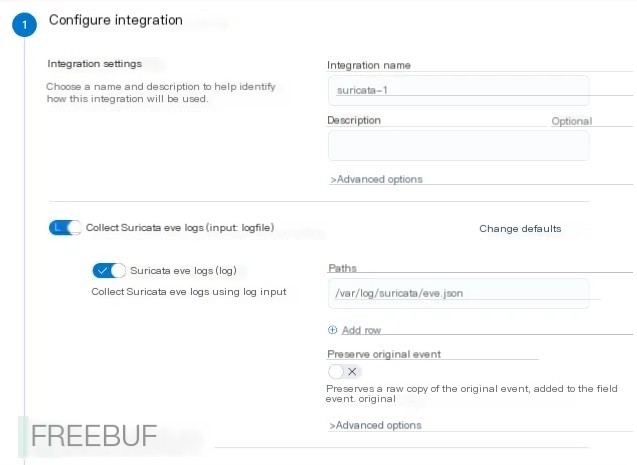
No need for changes here
Add an agent, select Run standalone, modify the configuration file content from the first step and save it
hosts: - 'https://127.0.0.1:9200' // Change to [local:9200] ssl.ca_trusted_fingerprint: '7****************************3'//Do not change this line username: 'elastic'//Change to the account obtained above password: 'Gxq*************qeaI' ////Change to the password obtained above (scroll to the right to see more)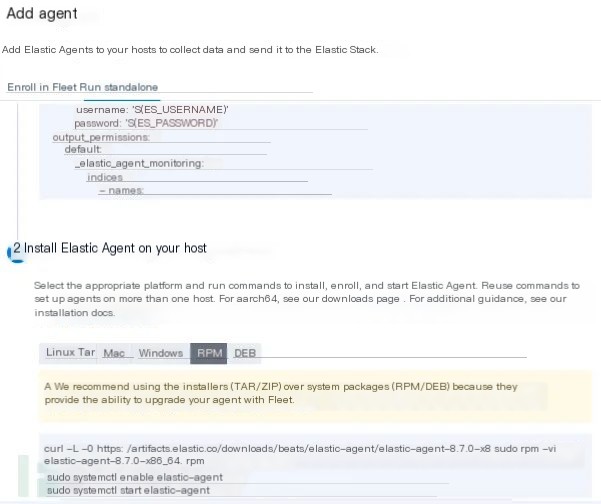
Execute on the host as instructed
curl -L -O https://artifacts.elastic.co/downloads/beats/elastic-agent/elastic-agent-8.7.0-x86_64.rpm sudo rpm -vi elastic-agent-8.7.0-x86_64.rpm sudo systemctl enable elastic-agent sudo systemctl start elastic-agent (scroll to the right to see more)Backup the original vim /etc/elastic-agent/elastic-agent.yml and save all the copied configuration file content into it.
systemctl restart elastic-agent # Restart systemctl status elastic-agent # Check running status (scroll to the right to see more)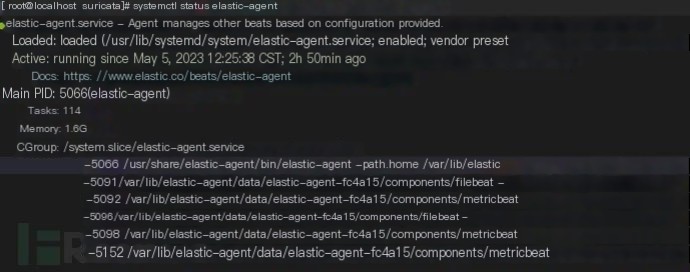
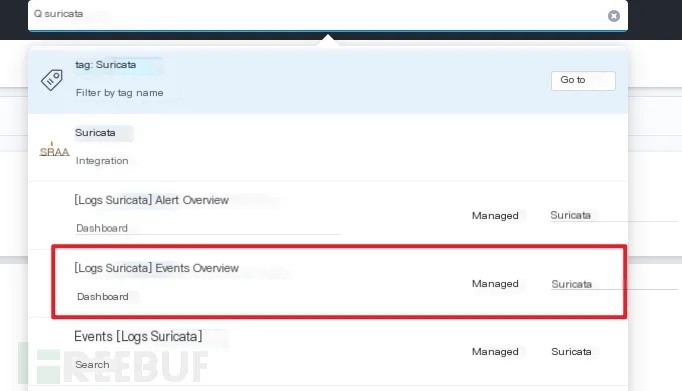
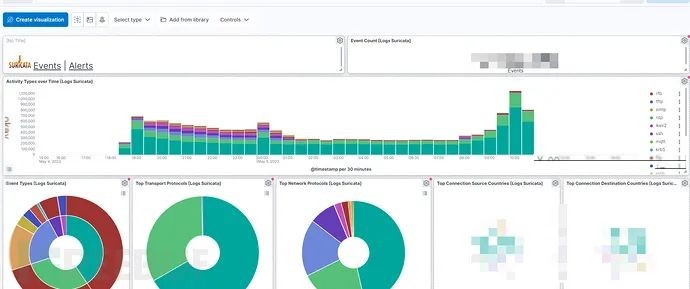
Then search for Suricata in Kibana to view the dashboard
Configuration is complete. If data is minimal, it could be due to low network traffic, and the agent may need time to transfer logs to Elasticsearch, among other reasons.
In future discussions, we will explore how to optimize Suricata rules, add additional alerts, and create dashboards with higher information density.