

Background on Website Slow Loading
This case study comes from a friend’s experience shared on an official account, detailing the troubleshooting process of a website slow loading issue. Users reported that the website took a long time to open from various Internet sources, suggesting the problem was server-related. This article focuses on diagnosing the issue using Wireshark analysis, as well as providing insights into utilizing browser developer tools and Fiddler for HTTP/HTTPS troubleshooting.
Regarding http/https problem troubleshooting, browser developer tools or Fiddler tools are also useful analysis tools. This article focuses on Wireshark analysis.
Analyzing the Problem of Slow Website Response Times
Since the website is bound to open slowly, it is relatively easy to troubleshoot. First, simply check it through the browser developer tools.
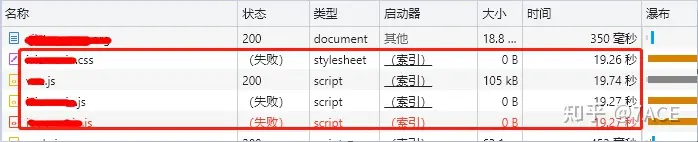
Some css and js files failed to load, taking more than 19 seconds, which basically matches the phenomenon and time of opening the page in the browser. Basically, the web page can be opened after more than 19 seconds.
Let’s continue with the Wireshark packet capture results. The main analysis is as follows: TCP Stream 0
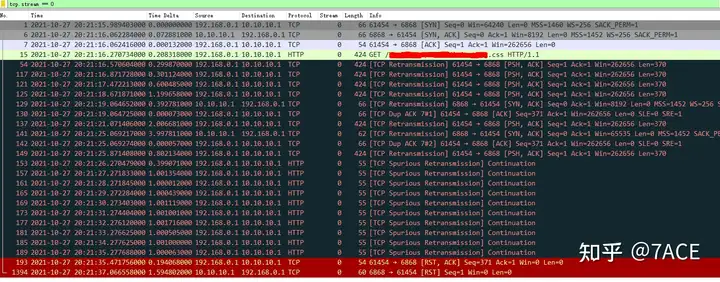
After the normal TCP three-way handshake, the client initiated a GET request for a css file, but did not receive a response from the server. It then kept retransmitting (No. 54, 117, 121, 125, 137, and 149 respectively). At the same time, after a certain period of time, the server also retransmitted SYN/ACK (No. 129 and 141 respectively), but the connection was still not formed normally. Then, starting from No. 153, the client sent TCP Keepalive packets (Wireshark marked them as suspected retransmissions). After 10 attempts without a response, the client RST’d the connection, and then the server also RST’d the connection.
Upon further inspection, TCP Stream 1
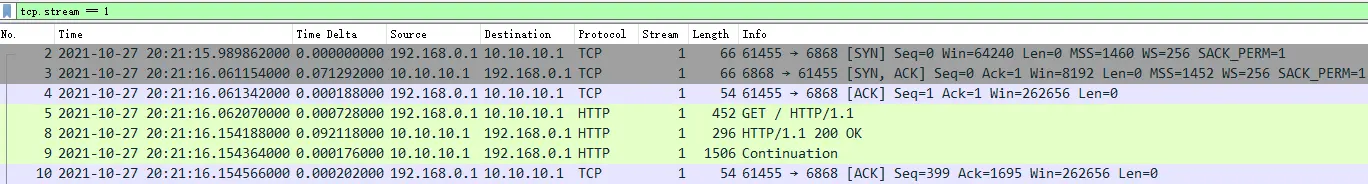
At similar times, TCP stream 1 was able to connect normally.
TCP Stream 2
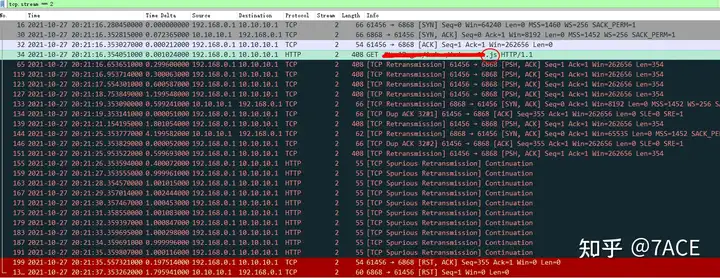
The same phenomenon as TCP Stream 0, the requested file type is js, which also matches the file status failure seen in the browser developer tools.
Looking at the overall phenomenon, there may be two reasons why the connection cannot be established normally on the server side:
- The server did not receive the third TCP handshake data packet, but in fact the client’s data request immediately afterwards could also allow the server to establish a connection normally. The client sent a GET data request, but the server did not receive it normally.
- The server received the third TCP handshake packet, but the server enabled the TCP option
TCP_DEFER_ACCEPT, so the connection was not established normally. It also waited for the client to send a GET data request, but the server did not receive it normally.
Combined with the normal results of TCP stream 1, the problem phenomena on TCP streams 0 and 2 are more consistent with the reasons in the above analysis 2.
TCP_DEFER_ACCEPT, please refer to the previous article
“Wireshark TS | Server sends RST after three-way handshake? ! “
Further analysis shows that the website opens the basic page TCP Stream 6 after 19 seconds

The CSS file requested in TCP stream 6 is the same as that in TCP stream 0, and the time required to connect to the file is about 19 seconds different, which matches the time consumed by the file request as seen in the browser developer tools.
Summary of Wireshark Findings on Website Slow Loading
For each attempt to open the website, the server failed to receive the request data packets of css, js and other types of files. It is inferred that some security policies on the server may have triggered, blocking the relevant request data packets, causing the first request file to fail. Due to the lack of some page files, the overall loading of the website page is slow.