When dealing with network issues, two essential elements come into play: understanding how data packets travel across the network and pinpointing the nodes responsible for directing traffic. These steps form the foundation of Traceroute Network Diagnostics.
The first step in Traceroute Network Diagnostics is tracking the exact route that data packets follow. The second step involves locating the nodes or devices that distribute traffic, such as routers and load balancers, which can be critical for identifying potential bottlenecks.
The traceroute command serves as an essential tool in Traceroute Network Diagnostics, functioning like a navigator to map the path data packets take across the network. By providing a hop-by-hop analysis of each intermediate node, it helps diagnose traffic flow issues.
01 Explanation of 2 technical terms
01 Load Balancing
Load balancing is actually a very smart way to ensure that the traffic in the network can be evenly distributed to different servers or network devices.
The advantage of doing this is that it can prevent a single node from crashing due to excessive traffic, while also improving the efficiency and reliability of the overall network.
Imagine that you go to a supermarket to buy something. If there is only one checkout counter, the line may be very long and you will have to wait for a long time.
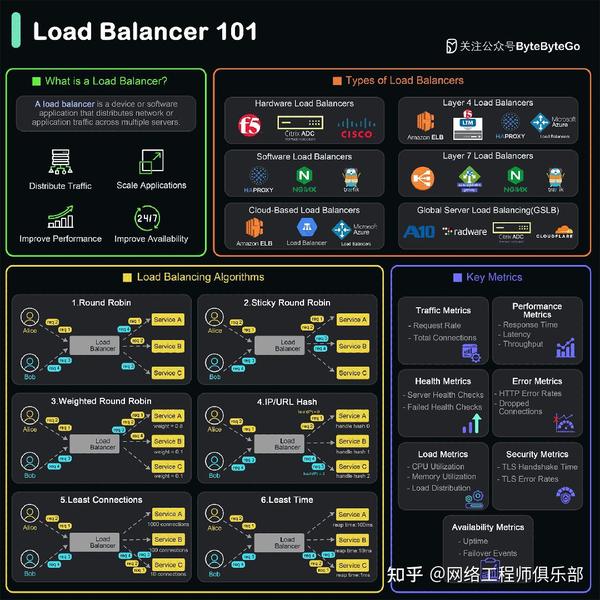
But if the supermarket opens several checkout counters, customers can go to different counters to check out, so that everyone doesn’t have to crowd in front of one checkout counter, and the waiting time will be greatly shortened.
This is the basic idea of load balancing – distribute the tasks so that each part can handle them more easily.
In a network environment, especially in websites and large online services, load balancing is particularly important.
It uses some technical means, such as polling, least number of connections, source address hashing and other algorithms, to decide which server should handle the request from the user (client).
This way, no server is overwhelmed by too many requests and response times are kept at a reasonable level.
Simply put, load balancing is the “traffic diversion expert” in the network world, ensuring that everyone can enjoy a happy Internet experience.
02 traceroute command
You can think of the traceroute command as a detective tool in the network world. Its main function is to help you find out the entire journey route of a data packet from the starting point to the end point in the network.
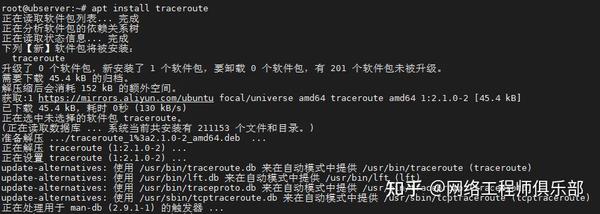
This command can tell you which intermediate nodes, such as routers or switches, the data packet passed through, and how long each journey took.
To use a metaphor close to life, it is like you buy something online, and then through the courier company’s tracking system, you can see that your package starts from the seller, passes through several distribution centers, and finally arrives at your address.
Every time you pass a station, a timestamp will be recorded.
In actual use, when you find that there is a problem with the network connection, such as the Internet access is very slow, or you cannot connect to a certain website at all, you can use the traceroute command to diagnose where the problem lies.
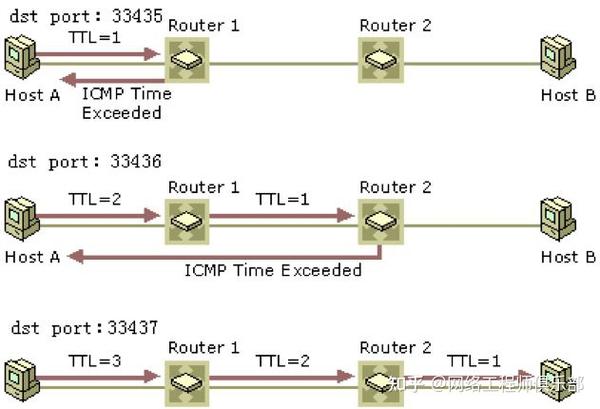
It may show that the latency is particularly high on a specific node, or that it cannot connect at all. Then you will know roughly where the problem may be, and then you can take appropriate measures to solve the problem.
So, to put it simply, the traceroute command is a powerful tool that allows you to see the route map and timetable of data packets “traveling” on the Internet, helping you locate network problems.
02 How to use the traceroute command?
To use the traceroute command, you need to enter the following command in a terminal or command prompt window:

Where <target URL or IP address> is the IP address of the target website or device you want to trace. For example, if you want to trace the path to www.example.com, you would enter:

After executing this command, traceroute will send a series of data packets to the target address and record the response time of each intermediate node (such as routers, switches, etc.). It will display the IP address of each node and the time required to reach the node (in milliseconds).
The output is similar to the following format:

Each line represents a hop point. The number indicates the number of hops. The IP address in brackets indicates the IP address of the hop point. The number behind it indicates the time required to reach the hop point.
Please note that the traceroute command may require administrator privileges to run. On some operating systems, you may need to use the `sudo` prefix to elevate privileges.
Additionally, different operating systems may have different traceroute implementations, so the specific command line interpretation may vary.
When the traceroute command is run, it outputs a series of lines, each line showing information about the routing nodes (hops) that the packet passes through. Here’s how to interpret this information step by step:
01Hop Count
The hop count is the sequential number of intermediate nodes that the data packet passes through. The first number represents the first hop, which is usually your local router or gateway; the second hop may be your ISP’s router, and so on.
02 IP address
Each hop is followed by an IP address, which is the address of the router or network device that the packet passed through.
03Round trip time
There are usually three round trip time values behind each IP address, in milliseconds (ms). These three values are the delay time of the three packets sent by traceroute. These values can help you understand the response speed of each hop.
04Average
Sometimes, after three round-trip time values, you might see an average value, which is the arithmetic mean of the three round-trip times.
05Packet Loss
If the round trip time value for a particular hop is shown as asterisks (*), this usually means that that particular packet was not received in return, i.e., packet loss occurred.
06Host Name
Some traceroute implementations will attempt to resolve the hostname for each IP address and display it in parentheses after the IP address. This can help you better identify the device or network at each hop.
07 Pay attention to abnormalities
If you see particularly high latency at a particular hop, or multiple consecutive asterisks (*), it may mean that there is a problem with the network connection at that hop, or it may be misconfigured, overloaded, or faulty.
08Destination
Normally, traceroute will run until the maximum number of hops is reached or the packet reaches its destination. If it does not reach its destination, you will see a series of asterisks after the last hop, indicating that all subsequent packets were lost.
09Maximum hop count
The traceroute tool has a built-in maximum hop limit, usually 30. This means that if the packet does not reach the destination within 30 hops, the traceroute will stop.
03 How to identify load balancing through traceroute ?
To identify the load balancer using the traceroute command, you can follow these steps:
1. Open a terminal or command prompt window.
- In Windows, you can open the Command Prompt window by pressing Win key + R, then typing “cmd” and pressing Enter.
- On Mac and Linux, you can open a Terminal window by using Spotlight Search (press Command + Space) and typing “Terminal”.
2. Enter the traceroute command followed by the target URL or IP address.

3. Press Enter to execute the command. traceroute will start sending packets and record the response time of each intermediate node (such as routers, switches, etc.).
4. Observe the output results. In the results, you may see some consecutive hops showing the same IP address, which may mean that these hops are part of a load balancer or router.
5. Pay attention to those hops with higher latency. If the latency of one hop is significantly higher than other hops, it may be where the load balancer is located.
6. If you find that multiple hops show the same IP address and the latency between these hops is high, then it is likely that these hops are load balancers.
The following is an example of using traceroute to identify load balancing, for your reference:
Suppose there is a domain name http://www. loadbalanced.com, you suspect there is a load balancer behind it.
1. Run traceroute
We first run the traceroute command:

The output is as follows:
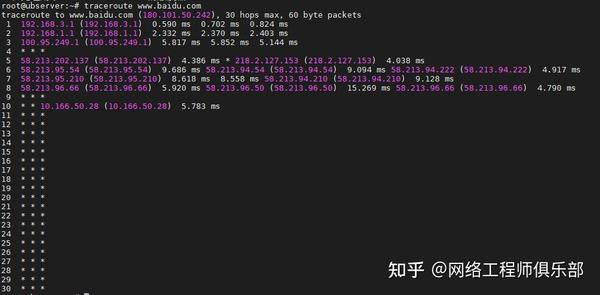
2. Run traceroute multiple times
To confirm the presence of the load balancer, we ran the traceroute command multiple times and compared the results.
Second run:
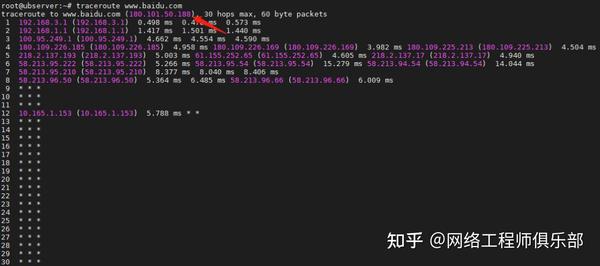
I found that the public IP address corresponding to Baidu’s domain name has changed. The domain name means load balancing, or the use of CDN.
To verify the traceroute load balancing, we directly traceroute 180.101.50.188:
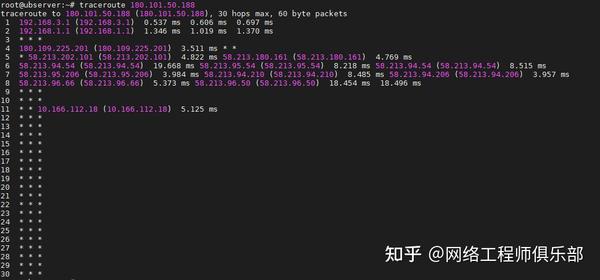
Note that the IP addresses of hops 3 and 4 change, indicating that the path passes through different backend nodes.
We can further confirm the presence of the load balancer by analyzing the response times of multiple runs of the traceroute command.
For example, if the response time of hop 4 varies significantly between runs, this could be because the load balancer is adjusting the path based on traffic conditions.


