

Locust Performance Evaluation and Optimization Explained
This article aims to address the gaps left in the previous article. After analyzing Locust’s overall process, we need to bring it back to a practical level to evaluate if Locust performance testing is truly useful and usable.
Performance Evaluation
In the article Performance Testing Tools Locust Source Code Analysis, we performed an analysis of the main process. This time, we will conduct an actual evaluation of Locust. Before the specific evaluation, to ensure the accuracy of the results, we need to establish the following benchmarks:
• No performance bottleneck on the server side (assumed to have unlimited capacity) • No restrictions set in the system environment (unlimited network connections, TIME_WAIT reclaimed promptly) • No additional consumption from the external environment (network monitoring software, rate-limiting software not started) • No bottleneck in network bandwidth • Tools under evaluation are tested on the same machine (leaving enough time for resource recovery between tests)
Environment Preparation
1. Stress Test Environment Preparation
• Machine Configuration: 4 cores, 8GB • Operating System: CentOS (preferably Linux) • Network Environment: Gigabit LAN • File Handle Limit: 65536 • Socket connection recovery time: 30ms
2. Service Environment Preparation
• Server Service: nginx 8 worker hosting a static file (hello world) • Machine Configuration: 4 cores, 8GB • Operating System: CentOS (preferably Linux) • Network Environment: Gigabit LAN • File Handle Limit: 65536 • Socket connection settings: net.ipv4.tcp_tw_reuse=1, net.ipv4.tcp_timestamps=1, net.ipv4.tcp_tw_recycle=1, net.ipv4.tcp_fin_timeout = 30
3. Stress Testing Tools Preparation
• Locust • Jmeter • ab • http_load
Start of Stress Testing
Using different tools on the same environment to perform requests of the same scenario, sending only one request for the static file “hello world”. After different tests, wait over 10 minutes to ensure recovery of resources on both machines.
• CPU, Memory • Load Avg (system queue length) • Socket connection count • Window Size (TCP window)
Locust
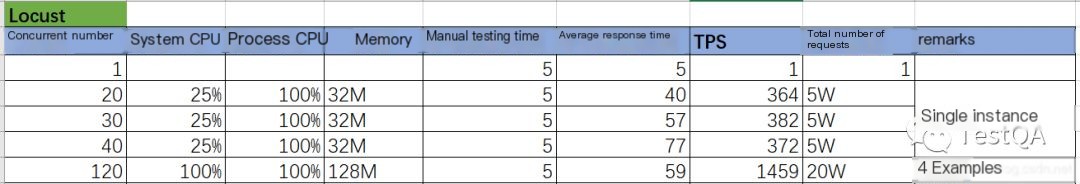
Begin the stress test with a single instance of Locust, setting min_wait and max_wait to 0 in the script. Since Locust uses requests.session for requests, it supports HTTP’s keep-alive by default. After the single instance test, use 4 instances for the same scenario.
The specific stress test script is as follows:
from locust import HttpLocust, TaskSet, taskclass WebsiteTasks(TaskSet): @task def index(self): self.client.get("/")class WebsiteUser(HttpLocust): task_set = WebsiteTasks host = "http://10.168.xx.xx" min_wait = 0 max_wait = 0The command to start Locust is as follows:
# Single instancelocust -f performance.py --no-web -c 2 -r 2 -t 5s# Distributedlocust -f performance.py --masterlocust -f performance.py --slave# Visit http://127.0.0.1:8089 to start the stress testStress test results with different concurrency and instances are as follows:
 >
>
Note: In a distributed scenario, there seems to be a bug where Locust’s default client won’t stop, and the web endpoint cannot be stopped.
Jmeter
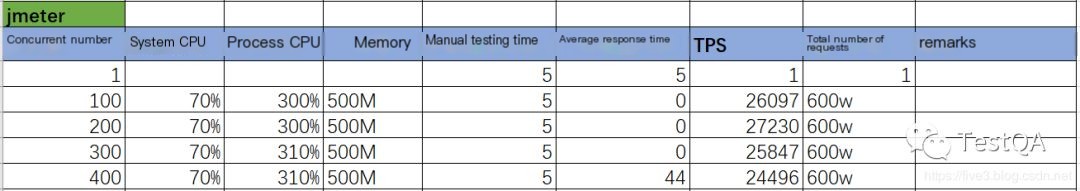
Initially, set the JVM heap size to a fixed 2GB for the Jmeter tool, without setting think time, and default to check keep-alive. Perform scenario stress tests with different concurrency levels to eventually evaluate the optimal concurrency user count and the maximum QPS.
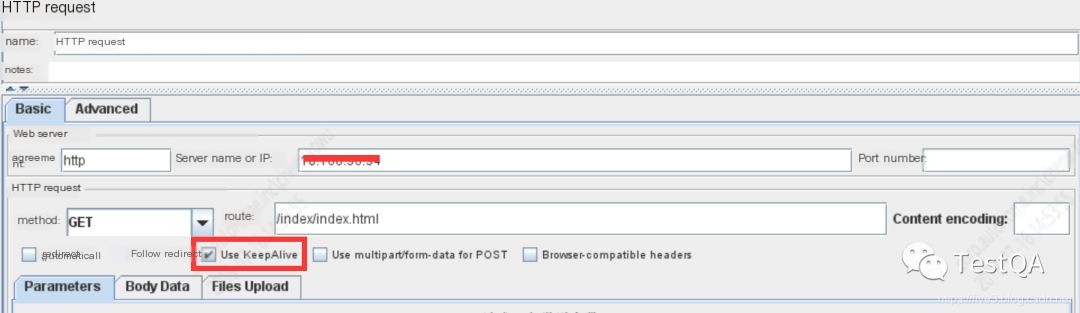
Jmeter’s HTTP request settings are as follows:
 >
>
The command to start Jmeter is as follows:
sh jmeter -n -t ../xxx.jmx -l /data/xxxx.jtlStress test results under different concurrency levels are as follows:
ab
ab is a stress testing tool in the Apache server. If you don’t want to install the entire Apache, you can just install the httpd-tools. You can enable the keep-alive mode with the -k parameter while specifying concurrency and the total number of requests.
The startup command and parameters for ab are as follows:
./ab -n 6000000 -c 150 http://10.168.xx.xx/index/index.htmlAb’s stress test results under different concurrency levels are as follows:
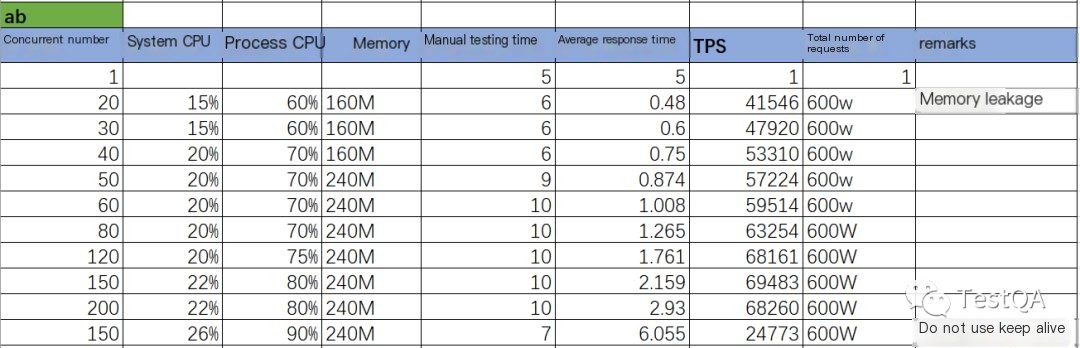
Why did ab perform so many tests? Originally, there was no expectation to achieve such high concurrency. Additionally, it can be observed that using keep-alive greatly enhances performance.
http_load
The http_load tool needs to be downloaded and compiled locally. Since http_load does not support keep-alive settings, you can only specify concurrency and total number of requests. The specific stress test command is as follows:
./http_load -p 100 -f 6000000 http://10.168.xx.xx/index/index.htmlThe stress test results of http_load under different concurrency levels are as follows:
Since http_load does not support setting keep-alive, its data is similar to ab when not using keep-alive.
Stress Test Explanation
Since the stress test scenario is quite singular, the data can only represent the differences in the stress testing ability of each tool in this scenario. If another scenario is used, the performance of the tools may vary. However, in general, there shouldn’t be much variability.
The stress testing ability of the tools is basically proportional to the execution efficiency of the language they are implemented in. C > JAVA > Python. Additionally, when using keep-alive, communication performance is indeed improved.
To determine the maximum concurrent ability of a stress testing tool, judge based on the QPS curve while ensuring manual test time is close to the baseline time. If manual test time is significantly greater than the baseline time during stress testing, it indicates that the server encountered performance issues first.
Many tools show a response time statistic of 0, so simply obtaining response time from the tool end is not accurate. It requires manual access and timing during the stress test, combined with the server-side QPS, response time, etc., for a comprehensive conclusion.
Performance Optimization
Through the simple evaluations of several tools above, from this set of data, Locust is the weakest. Jmeter closely matches the evaluation results on the network. However, since Locust belongs to the Python series, there is still hope to see if Locust has optimization potential.
Locust Optimization Items
To try to enhance Locust’s performance, think and attempt the following ways:
• Set think time to 0 (default is 1 second, as mentioned above) • Use keep-alive mode (default is keep-alive, need to confirm its effectiveness) • Replace with the urllib3 base library (requests is a wrapper based on urllib3) • Switch to using the socket library for requests • Switch to using a client implemented in Go
Testing If Locust’s Default Is Keep-Alive
To check if keep-alive is used, use wireshark to capture packets and see if different requests reuse a TCP connection; if yes, it is keep-alive, otherwise, it’s not the keep-alive mode.
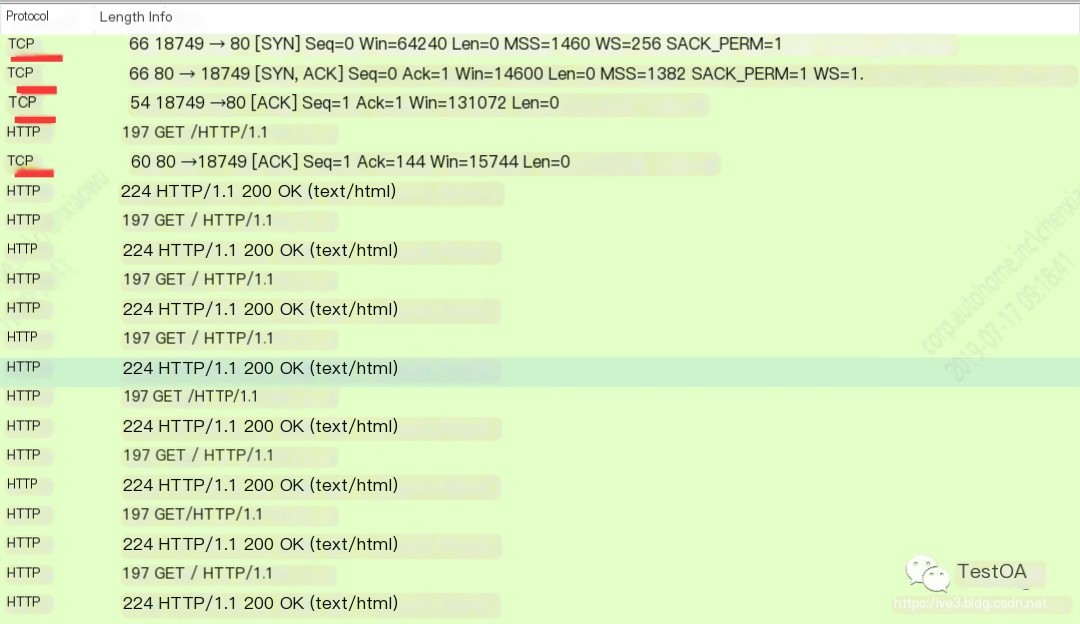
The results show that requests.session indeed supports keep-alive by default. Therefore, if using Locust’s default client, this part does not require optimization.
Replacing with a Client Implemented by urllib3
Since the underlying library used by requests is urllib3, here we also try to directly use urllib3 as Locust’s client to see if there is a performance improvement. The client code is as follows:
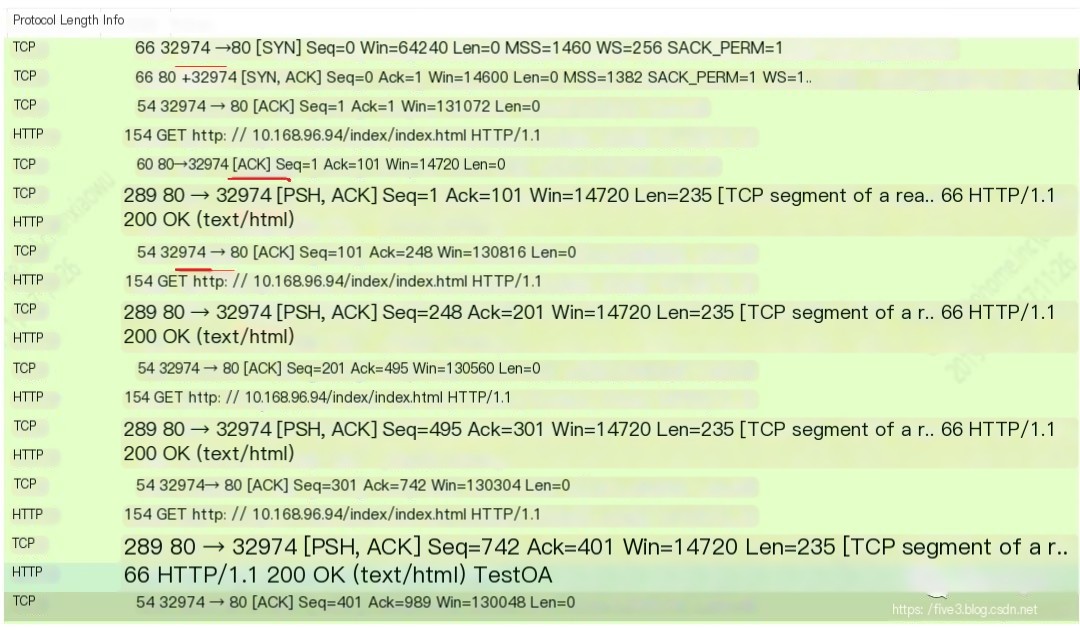
import timeimport urllib3from locust import Locust, eventsfrom locust.exception import LocustError# from requests import Responseclass Response: def __init__(self, url): self.url = url self.reason = 'OK' self.status_code = 200 self.data = Noneclass FastHttpSession: def __init__(self, base_url=None): self.base_url = base_url # self.http = urllib3.PoolManager() self.http = urllib3.HTTPConnectionPool(base_url) def get(self, path): full_path = f'{self.base_url}{path}' return self.url_request(full_path) def url_request(self, url, name="hello world"): rep = Response(url) start_time = time.time() try: # r = self.http.request('GET', url) r = self.http.urlopen('GET', url) total_time = int((time.time() - start_time) * 1000) events.request_success.fire(request_type="urllib3", name=name, response_time=total_time, response_length=0) except Exception as e: total_time = int((time.time() - start_time) * 1000) events.request_failure.fire(request_type="urllib3", name=name, response_time=total_time, exception=e) rep.status_code = r.status rep.reason = r.reason rep.data = r.data return repclass FastHttpLocust(Locust): client = None def __init__(self): super(FastHttpLocust, self).__init__() if self.host is None: raise LocustError( "You must specify the base host. Either in the host attribute in the Locust class, or on the command line using the --host option.") self.client = FastHttpSession(base_url=self.host)The TCP communication recorded during urllib3 requests shows that it also defaults to keep-alive mode.
The specific stress test results are as follows:
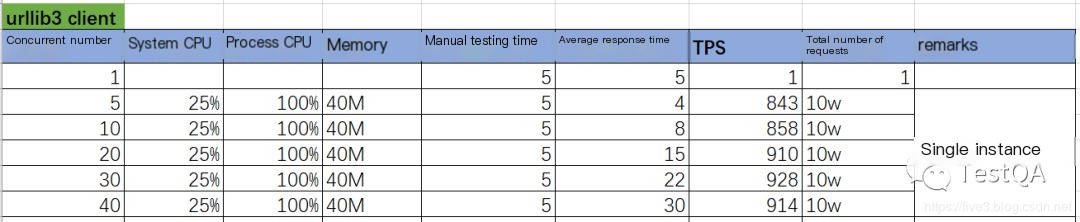
The stress test results indicate that the concurrent capability of using urllib3 nearly doubled; however, compared to implementations in other languages, there is still a gap.
Replacing with a Client Implemented by Socket
Initially intended to continue using sockets to implement the client; however, there are pitfalls in TCP protocol programming that did not achieve the desired effect, leaving this pitfall for later!
Replacing with a Go Client
While searching for Locust optimization solutions, a Go language client was found to have been implemented. The GitHub repository: https://github.com/myzhan/boomer, with simple installation steps that can be quickly completed following the project instructions.
Using the Go client is also convenient; simply replace the slave startup command with the Go program startup. The specific command is as follows:
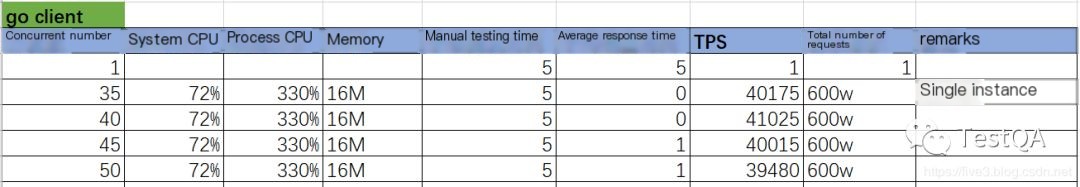
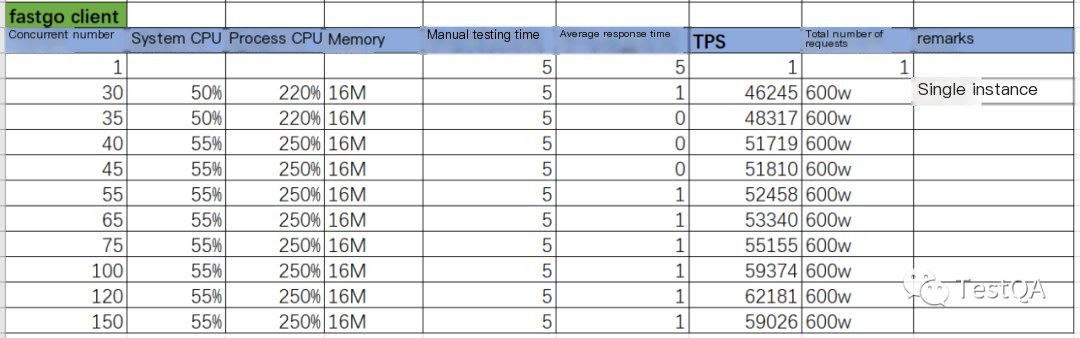
locust -f performance.py --master./http.out --url http://10.168.xx.xx/index/index.htmlThe stress test results under different concurrency levels are as follows:
The boomer project includes two versions of the Go client; apart from the aforementioned one, there’s also a fast version, and the startup command is as follows:
locust -f performance.py --master./fasthttp.out --url http://10.168.xx.xx/index/index.htmlThe stress test results under different concurrency levels are as follows:
Note: The regular client and fast client corresponding Go files are examples/http/client.go and examples/fasthttp/client.go, respectively.
Conclusion
From the current evaluation results, the client implemented in Python does not have an advantage in generating stress; tools like ab do not offer sufficient support for scenarios; if you want to have both, the Go version of the Locust client might be a good choice!
An issue on Locust’s official GitHub states that Locust’s insufficient pressure capability explanation is: “Locust primarily addresses scene development efficiency, not pressure generation issues, since human efficiency costs far exceed hardware costs”.