

Recently started exploring Android automation testing methodologies and have compiled a basic overview of some tools, methods, and frameworks, including the Android Testing Framework, CTS, Monkey, MonkeyRunner, Benchmark, and other test tools, etc. Since I’ve only been involved for a short time, there are many areas lacking depth, and I hope to engage with everyone for more extensive discussions.
1. What is Monkey
Monkey is a command-line tool in Android that can run on an emulator or actual devices. It sends a stream of pseudo-random user events to the system (such as key inputs, touch screen inputs, gestures, etc.) to perform stress testing on applications in development. Monkey testing is a quick and effective method for assessing the stability and robustness of software.
2. Features of Monkey
1. The object of the test is limited to the application package, which has certain limitations.
2. The event stream data flow used for Monky testing is random and cannot be customized.
3. You can configure the settings for MonkeyTest, including the number of objects, events, types, and frequency.
3. Basic Usage of Monkey
The basic syntax is as follows:
$ adb shell monkey [options]
By default, if no options are specified, Monkey will launch in a no-feedback mode and randomly send events to all the packages installed in the target environment. Below is a more typical command line example, where it launches the specified application and sends 500 pseudo-random events to it:
$ adb shell monkey -p your.package.name -v 500
4. An Instance of Monkey Testing
Through this example, we can understand the steps of Monkey testing and determine which applications can be tested using Monkey.
On Windows (Note: Steps 2-4 are to see which application packages we can test and may be omitted):
1. Launch an Android emulator through Eclipse.
2. Enter the following in the command line: `adb devices` to check the connection status of the devices.
C:\Documents and Settings\Administrator>adb devices
List of devices attached
emulator-5554 device
3. Under the condition that a device is connected, enter the command line: adb shell to access the shell interface.
C:\Documents and Settings\Administrator>adb shell
#
4. View the application packages in the data/data directory. Note: The application packages we can test are all located in this directory.
C:\Documents and Settings\Administrator>adb shell
# ls data/data
ls data/data
com.google.android.btrouter
com.android.providers.telephony
com.android.mms
com.android.providers.downloads
com.android.deskclock
com.android.email
com.android.providers.media
com.android.settings
jp.co.omronsoft.openwnn
com.android.providers.userdictionary
com.android.quicksearchbox
com.android.protips
com.android.browser
com.android.launcher
com.android.term
com.android.speechrecorder
com.android.server.V
com.android.defcontainer
com.svox.pico
com.android.customlocale
com.android.development
com.android.soundrecorder
com.android.providers.drm
com.android.spare_parts
com.android.providers.downloads.ui
com.android.fallback
com.android.providers.applications
com.android.netspeed
com.android.wallpaper.livepicker
android.tts
com.android.htmlviewer
com.android.music
com.android.certinstaller
com.android.inputmethod.pinyin
com.android.providers.subscribedfeeds
com.android.inputmethod.latin
com.android.gallery
com.android.systemui
com.android.contacts
com.android.phone
com.android.sdksetup
com.android.calculator2
com.android.packageinstaller
com.android.camera
com.android.providers.settings
com.thestore.main
com.android.providers.contacts
5. Conduct a Monkey Test targeting com.android.calculator2.
#monkey -p com.android.calculator2 -v 500
`-p` stands for the object package and `-v` indicates the verbosity level.
During execution, the application in the Emulator continuously switches screens.
According to the selected level of feedback, you can also view its execution process reports and the generated events in Monkey.
Note: For specific parameter settings, refer to:http://developer.android.com/guide/developing/tools/monkey.html
5. Conditions for Stopping a Monkey Test
The Monkey Test will automatically stop under the following three conditions during execution:
1. If Monkey is restricted to run on one or several specific packages, it will monitor attempts to switch to other packages and block these actions.
2. If the application crashes or receives any unhandled exceptions, Monkey will stop and report an error.
3. If the application generates an “application not responding” error, Monkey will stop and report an error.
Only after conducting multiple Monkey tests under various configurations can it be considered a sufficiently stable program.
6. Monkeyrunner tool
6.2 What is monkeyrunner
The monkeyrunner tool provides an API that enables programs to control Android devices and emulators from outside the Android codebase. With monkeyrunner, you can write a Python program to install an Android application or test package, launch it, send simulated keystrokes to it, capture its user interface screenshots, and save these screenshots on a workstation. The primary design purpose of the monkeyrunner tool is for testing applications and devices at the functional/framework level or to execute unit test suites, though you can certainly use it for other purposes as well.
6.2. Differences Between the Monkeyrunner Tool and the Monkey Tool
I’m here to assist you with translating text content from WordPress posts into American English. If you could provide the text that needs translation while keeping the HTML intact, I’ll get started right away!
The Monkey tool runs directly on the device or emulator.adbIn the shell, generate streams of pseudo-random events for user or system actions.
monkeyrunner:
The monkeyrunner tool is used on workstations to control devices or emulators via specific commands and events defined by the API.
Three: Types of Testing with monkeyrunner
1. Multi-Device Control: The monkeyrunner API allows you to implement test suites across multiple devices or emulators. You can connect all devices simultaneously or launch all emulators at once (or all together), sequentially connect to each one according to the program, and then run one or more tests. You can also launch a configured emulator with the program, run one or more tests, and then close the emulator.
2. Functional Testing: Monkeyrunner can automatically conduct a functional test for an application. You provide input values for key or touch events, and then observe the output results through screenshots.
3. Regression Testing: Monkeyrunner can execute an application and capture screenshots of its results, which are then compared with known correct screenshots. This process tests the application’s stability.
4. Scalable Automation: Since monkeyrunner is an API toolkit, you can develop an entire suite of systems based on Python modules and programs to control Android devices. In addition to using the monkeyrunner API, you can also use standard Python os and subprocess modules to invoke Android tools like the Android Debug Bridge.
Section Four: Running monkeyrunner
You can directly run monkeyrunner with a code file or input monkeyrunner statements in an interactive session. Regardless of the method you choose, you need to invoke the monkeyrunner command located in the tools subdirectory of the SDK directory. If you provide a filename as an execution parameter, monkeyrunner will treat the file content as a Python program and execute it; otherwise, it will offer an interactive dialogue environment.
The command syntax for monkeyrunner is:
monkeyrunner -plugin <><><></></></>
V. Examples
Using the ApiDemos from the sample, first generate the ApiDemos.apk.
Prerequisite: A device has already been connected.
1. Place the `ApiDemos.apk` in the `$Android_Root\tools` directory.
2. In the $Android_Root\tools directory, create a new file named monkeyrunnerprogram.py. The content inside should be:
1 # Imports the monkeyrunner modules used by this program
 2
 3  from com.android.monkeyrunner import MonkeyRunner, MonkeyDevice, MonkeyImage
 4
 5  # Connects to the current device, returning a MonkeyDevice object
 6
 7 device = MonkeyRunner.waitForConnection()
 8
 9  # Installs the Android package. Notice that this method returns a boolean, so you can test
10
11  # to see if the installation worked.
12
13 device.installPackage('./ApiDemos.apk')
14
15
16  # Runs the component
17
18 device.startActivity(component='com.example.android.apis/.ApiDemos')
19
20
21  # Presses the Menu button
22
23 device.press('KEYCODE_MENU','DOWN_AND_UP')
24
25
26  # Takes a screenshot
27
28 result = device.takeSnapshot()
29
30
31  # Writes the screenshot to a file
32
33 result.writeToFile('./shot1.png','png')
Note: There are some errors in the examples on the SDK. Do not directly copy them, as executing the commands may result in errors. You can compare this with my code above for specifics.
3. Open the command line and navigate to the Android_Root\tools directory, then execute the following command:
monkeyrunner monkeyrunnerprogram.py
110307 15:33:19.625:I [main] [com.android.monkeyrunner.MonkeyManager] Monkey Command: wake.
110307 15:33:20.625:I [main] [com.android.monkeyrunner.MonkeyManager] Monkey Command: wake.
110307 15:33:21.625:I [main] [com.android.monkeyrunner.MonkeyManager] Monkey Command: wake.
110307 15:33:22.718:S [pool-1-thread-1] [com.android.monkeyrunner.adb.AdbMonkeyDevice] Error starting command: monkey –port 12345
110307 15:33:22.718:S [pool-1-thread-1] [com.android.monkeyrunner.adb.AdbMonkeyDevice]com.android.ddmlib.ShellCommandUnresponsiveException
110307 15:33:22.718:S [pool-1-thread-1] [com.android.monkeyrunner.adb.AdbMonkeyDevice] at com.android.ddmlib.AdbHelper.executeRemoteCommand(AdbHelper.java:408)
110307 15:33:22.718:S [pool-1-thread-1] [com.android.monkeyrunner.adb.AdbMonkeyDevice] at com.android.ddmlib.Device.executeShellCommand(Device.java:276)
110307 15:33:22.718:S [pool-1-thread-1] [com.android.monkeyrunner.adb.AdbMonkeyDevice] at com.android.monkeyrunner.adb.AdbMonkeyDevice$1.run(AdbMonkeyDevice.java:89)
110307 15:33:22.718:S [pool-1-thread-1] [com.android.monkeyrunner.adb.AdbMonkeyDevice] at java.util.concurrent.Executors$RunnableAdapter.call(UnknownSource)
110307 15:33:22.718:S [pool-1-thread-1] [com.android.monkeyrunner.adb.AdbMonkeyDevice] at java.util.concurrent.FutureTask$Sync.innerRun(Unknown Source)
110307 15:33:22.718:S [pool-1-thread-1] [com.android.monkeyrunner.adb.AdbMonkeyDevice] at java.util.concurrent.FutureTask.run(Unknown Source)
110307 15:33:22.718:S [pool-1-thread-1] [com.android.monkeyrunner.adb.AdbMonkeyDevice] at java.util.concurrent.ThreadPoolExecutor$Worker.runTask(Unknown Source)
110307 15:33:22.718:S [pool-1-thread-1] [com.android.monkeyrunner.adb.AdbMonkeyDevice] at java.util.concurrent.ThreadPoolExecutor$Worker.run(UnknownSource)
110307 15:33:22.718:S [pool-1-thread-1] [com.android.monkeyrunner.adb.AdbMonkeyDevice] at java.lang.Thread.run(UnknownSource)
110307 15:33:57.437:I [main] [com.android.monkeyrunner.MonkeyManager] Monkey Command: press KEYCODE_MENU.
110307 15:33:59.171:I [main] [com.android.monkeyrunner.MonkeyManager] Monkey Command: quit.
Note: We can ignore the exception messages inside, because we can see that Monkey Command: press KEYCODE_MENU was executed successfully.
4. You can view the screenshot of shot1.png generated under Android_Root\tools.
Section 6: Example Extension
Because when the MENU key is pressed on the ApiDemos home page there is no menu appearing, to make it more illustrative, continue experimenting based on example five:
Create a new file named `monkeyrunnerprogram1.py` under `$Android_Root\tools`, with the following content:
1 # Imports the monkeyrunner modules used by this program
 2
 3  from com.android.monkeyrunner import MonkeyRunner, MonkeyDevice, MonkeyImage
 4
 5 # Connects to the current device, returning a MonkeyDevice object
 6
 7 device = MonkeyRunner.waitForConnection()
 8
 9 # Takes a screenshot
10
11 result = device.takeSnapshot()
12
13 # Writes the screenshot to a file
14
15 result.writeToFile('./shotbegin.png','png')
16
17 # Presses the Down button
18
19 device.press('KEYCODE_DPAD_DOWN','DOWN_AND_UP')
20
21 device.press('KEYCODE_DPAD_DOWN','DOWN_AND_UP')
22
23 device.press('KEYCODE_DPAD_DOWN','DOWN_AND_UP')
24
25 device.press('KEYCODE_DPAD_DOWN','DOWN_AND_UP')
26
27 device.press('KEYCODE_DPAD_DOWN','DOWN_AND_UP')
28
29 # Takes a screenshot
30
31 result = device.takeSnapshot()
32
33 # Writes the screenshot to a file
34
35 result.writeToFile('./shotend.png','png')
2. Position the screen on the Apidemos homepage and place the cursor on the first item.
3. Execute the following command in the $Android_Root\tools directory:
monkeyrunner monkeyrunnerprogram1.py
4. During execution, we can see the cursor continuously moving downward, and we can view our customized screenshot in the current directory:
Run before: shotbegin.png
After execution (performed five down moves): shotend.png
A Brief Discussion on Monkey’s Specialized Testing
Foreword
In fact, at the end of last year, I mentioned that many companies had already completed much of their functional testing. The next steps would involve tackling performance testing, security testing, continuous integration, and hybrid approaches, among others. As expected, many colleagues in testing have recently started asking me about performance-related issues. From a professional standpoint, these are referred to as specialized testing. In specialized testing, it’s important to differentiate who is tasked with these responsibilities. Both the tools team and the business team engage in this work, although their approaches and focal points differ significantly. Many colleagues might also be curious about what I actually do and how I go about it, especially considering my extensive experience with different companies. I’ll provide a brief overview here.
What did you do?
Well, let me think about what I did. Actually, now it seems like whenever the company thinks about mobile wireless application testing, they think of me. Over the past year, I’ve been handling continuous integration, BDD, functional regression automation, API testing, both static and dynamic scanning, and client-initiated API testing, among other things. Honestly, up to this point, I still don’t quite understand how I ended up on this specialized testing path. It seems like one day, the company decided I should do it, and then it became my role.
How to do it?
Actually, let’s not discuss other things for now. Let’s start with discussing special projects. The key points of a special project lie in several aspects.
1. How to Manually Retrieve Data
2. How to Automate Data Retrieval
3. How to Analyze Data
4. How to Identify Issues
5. How to Optimize
Certainly, I need to vent here—everyone, wake up. Is it meaningful to spend a few years researching UI functionality automation? There’s too much to learn, so wake up already. In fact, many people are unaware of the important aspects I’ve mentioned above. Moreover, there’s even more they don’t know, such as
At what stage should I proceed? What should be done at each stage, and to what level of granularity? How does one define completion? … Perhaps there are many more questions, but I don’t want to list them all. Actually, what I want to say is that there’s nothing absolute. It depends on your team, your project, your goal this time, the project stage, and so on. Strategies vary at different times. Alright, let’s tackle them one by one.
What stage to do it, what to do at each stage, and at what level of granularity
If you have the time and the project is in its initial stages, it’s necessary to conduct a specialized evaluation on a weekly basis. During this process, you must ensure that tools like `mvn`, `gradle`, or `pod install`, among others, are successful before proceeding. During this phase, you should analyze the code modifications from both the business and technical perspectives to provide specialized data. The nature of this data will depend on the positioning of the new features and the product, so avoid thinking there’s a fixed model to follow. For example, while products like Tencent QQ and Alipay might not differ much in terms of specialized technology, the objectives and scenarios for specialized testing are vastly different—understand? As functionality improves, eventually, a comprehensive specialized test across all integrated modules is necessary. Remember, the granularity, scope, and method of data collection depend entirely on the strategy of the test owner.
Conversely, if you lack the time, you can directly conduct a targeted integration assessment upon the completion of the functionality based on the success. Although the results won’t be significantly different, the downside of this method is that if issues arise, there might be limited time for development modifications, and the targeted testing itself can be time-consuming. Therefore, it’s best to proceed step by step rather than conducting the integration afterwards, as there often isn’t enough time.
Real-world Scenario Simulation
For instance, when there’s a new project that’s just getting started and the code compilation is all good, there are certain specifics we can tackle, but we cannot do them all. This limitation is due to your team’s size and the completeness of the functionality. It might be best to focus on the most critical aspects first, like Code Review (CR), comparing functionality experience paths, memory consumption comparisons, and data comparisons across different networks. These are considered the most important aspects for a mobile application. The remaining aspects can be evaluated gradually in future iterations. In terms of granularity, as mentioned, aside from power consumption, most other data can be accessed through various methods (instrumentation, jailbreaking, calling native APIs, hooking, etc.).
How is it considered complete?
This is indeed quite an pressing issue. That’s why I say assessment isn’t just done by producing an APK or IPA. Instead, it’s something that should be continuously done throughout the project’s iterations. Once the functionality is 100% complete, we can probably do a comprehensive round of testing. But then another issue arises, as most applications will continue to be modified. What should we do then? That’s why I advocate for Code Review (CR). You need to assess the impact of each modification based on the business value, functionality importance, and code changes. It’s impractical to conduct a special review every time, so this is a necessary skill to develop.
All right, we’ve explained these points. Now, let’s continue to look at the specific key points I mentioned at the very top. I’ll use the keynote I wrote in Xi’an as an example for this.
Monkey
Alright. This is not me, it’s the tool. Let me clarify first.
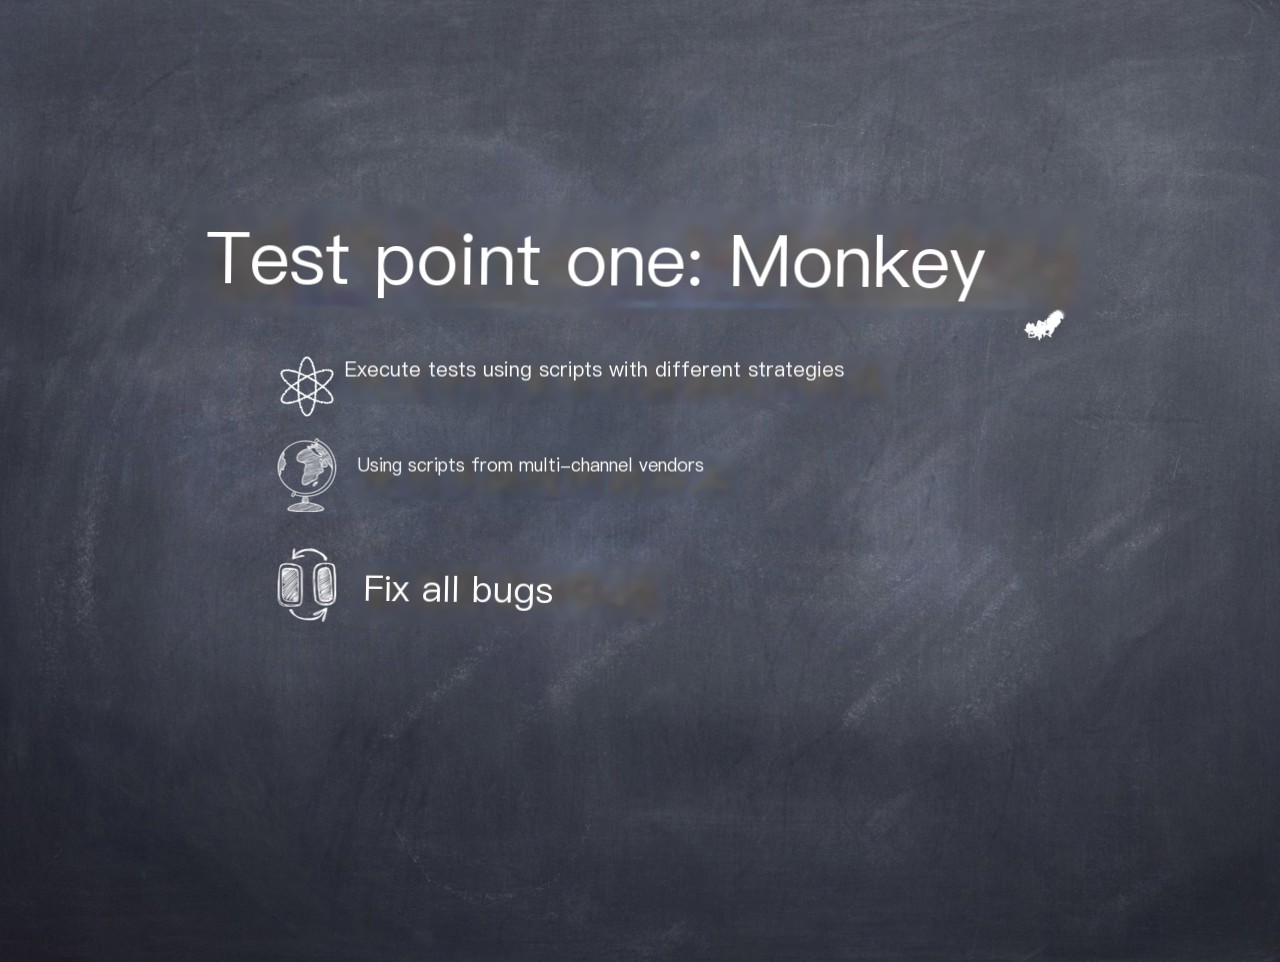
Using Different Strategies: The idea is to develop scripts based on your own strategies (with varying operational weights among different actions), including simple secondary development if needed. A popular approach nowadays involves reading all current Views and iterating through them to ensure the monkey test can execute in every Activity.
Using Scripts from Different Channel Vendors: Currently, each channel vendor has its own monkey script for testing. If a test fails, it will be rejected. Therefore, it’s better to proactively address this by using these scripts in advance.
Fixing All Bugs: This is the standard requirement—achieving 0 crashes and 0 ANRs (Application Not Responding). Both of these are unacceptable.
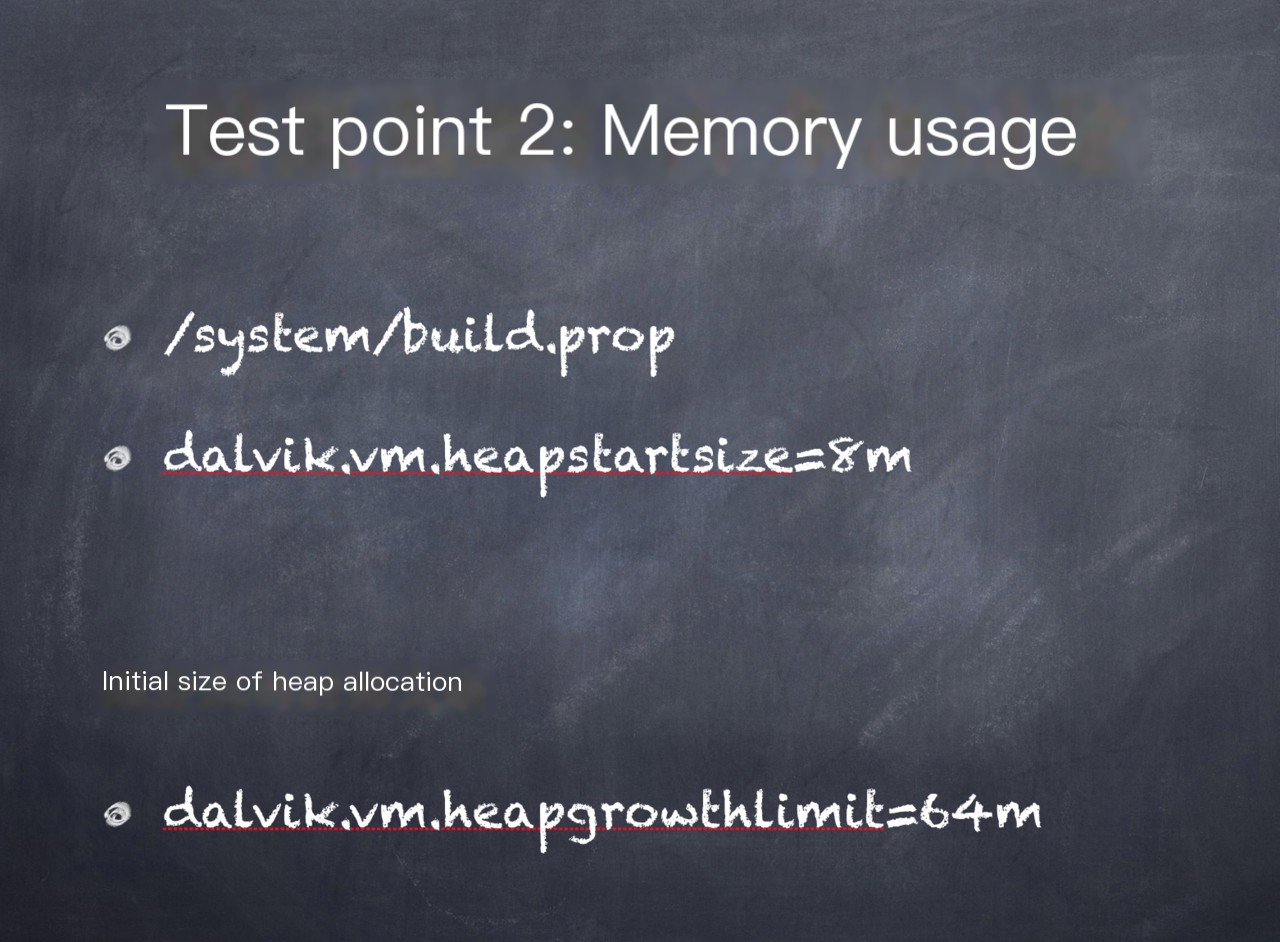
Memory
This is actually a very important data. Therefore, before we start, we first need to see how much memory each machine’s operating system has allocated to each application. Otherwise, how do you know whether the data is more or less?
The method provided here is what I recommend, because it outputs data in a structured matrix, making it easy to analyze. However, not all machines can utilize this command. If you receive a message indicating it’s unavailable, most likely it’s because the procrank file is missing. You can search online to download it and then push it onto your phone. Of course, it seems like it won’t work without root access.

Of course, we also have other ways.

Certainly, we have other methods as well, such as the `adb shell dumpsys` command, which can also provide comprehensive memory information.
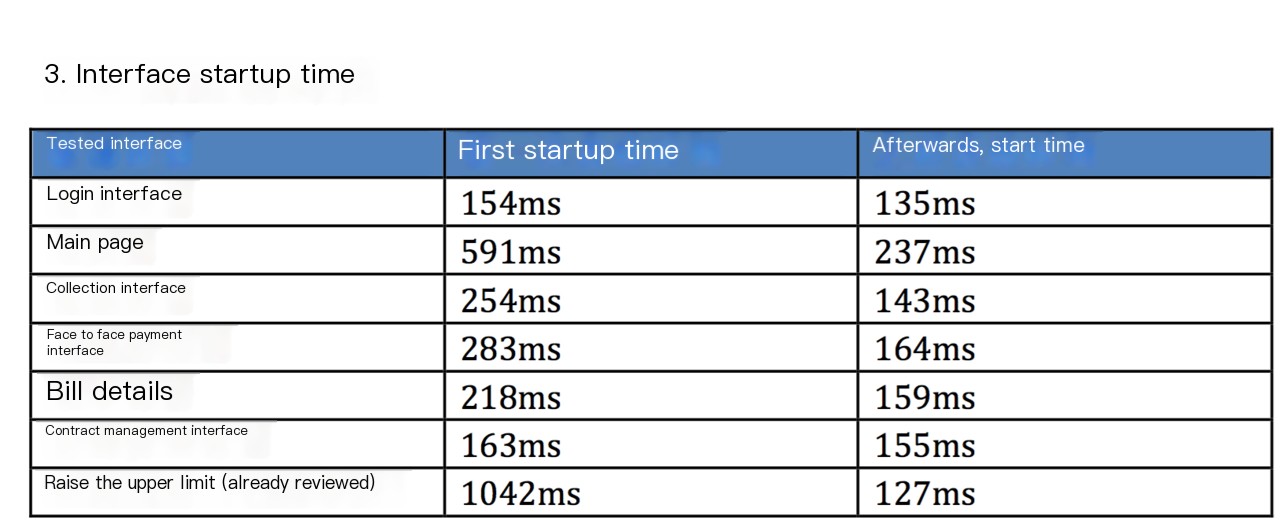
Startup Performance
Startup performance falls into these two categories, after all, there’s a significant difference between having cache and not having cache. So here’s the question: although there are only two types, there are numerous dimensions.
Native Launch Time
Using instrumentation or grep with ActivityManager or ActivityLauncher is acceptable. Of course, for more detailed analysis, there might be other methods available.Hybrid Launch Time
For this, refer to my QCon presentation. There are numerous points of instrumentation needed to accurately capture this.Network Consumption Time for Business Functionality
This is crucial. We need to focus not only on the duration but also on how many interfaces each business function needs to call. Additionally, assess whether CSS, JS, and PNG files have different strategies tailored to network conditions and if they have been compressed. Time data is merely the final display of performance analysis.Damn, someone told me today they wouldn’t dare to disclose the company’s stuff, but I’m showing it this time.
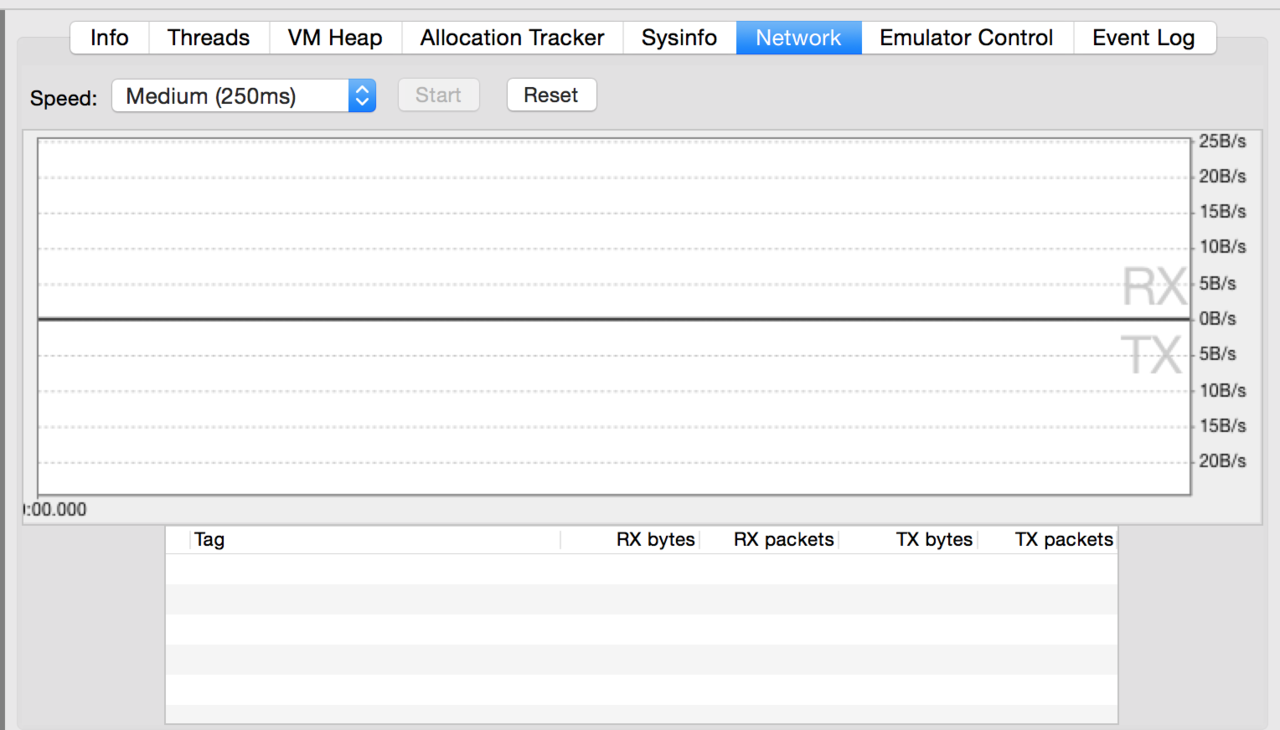
Traffic
It’s time for traffic. There are several methods, right? The first is through DDMS; I’m not going to teach you the specifics—I don’t like hand-holding.
The second approach is to obtain it from the OS. The new method is as follows:
String rcvPath = "/proc/uid_stat/" + uid + "/tcp_rcv"; String sndPath = "/proc/uid_stat/" + uid + "/tcp_snd"; Of course, you don’t necessarily have to use Java; you can also extract it directly using shell or Python scripts.
The third method involves directly calling the native interface to retrieve data, which essentially follows the same logic as DDMS.
@SuppressLint("ShowToast") public void getAppTrafficList() { PackageManager pm = getPackageManager(); List<> pinfos = pm .getInstalledPackages(PackageManager.GET_UNINSTALLED_PACKAGES | PackageManager.GET_PERMISSIONS); for (PackageInfo info : pinfos) { String[] premissions = info.requestedPermissions; if (premissions != null && premissions.length > 0) { for (String premission : premissions) { if ("android.permission.INTERNET".equals(premission)) { int uId = info.applicationInfo.uid; long rx = TrafficStats.getUidRxBytes(uId); long tx = TrafficStats.getUidTxBytes(uId); if (rx < 0 || tx < 0) { continue; } else { Log.e(info.packageName.toString() + "Traffic", (rx + tx) + "kb"); } } } } } } </>The fourth option is using a proxy. Packet capturing to obtain traffic size and network data. Of course, there’s also the last method, which is very important—using tcpdump to capture data and Wireshark for analysis. Detailed instructions are not provided here.
Application usage amount
As the frequency of application usage increases, the size of the application at the time of release might still be acceptable, but over time it becomes unbearable for users. Therefore, the growth in application usage is a point of concern for me as well.
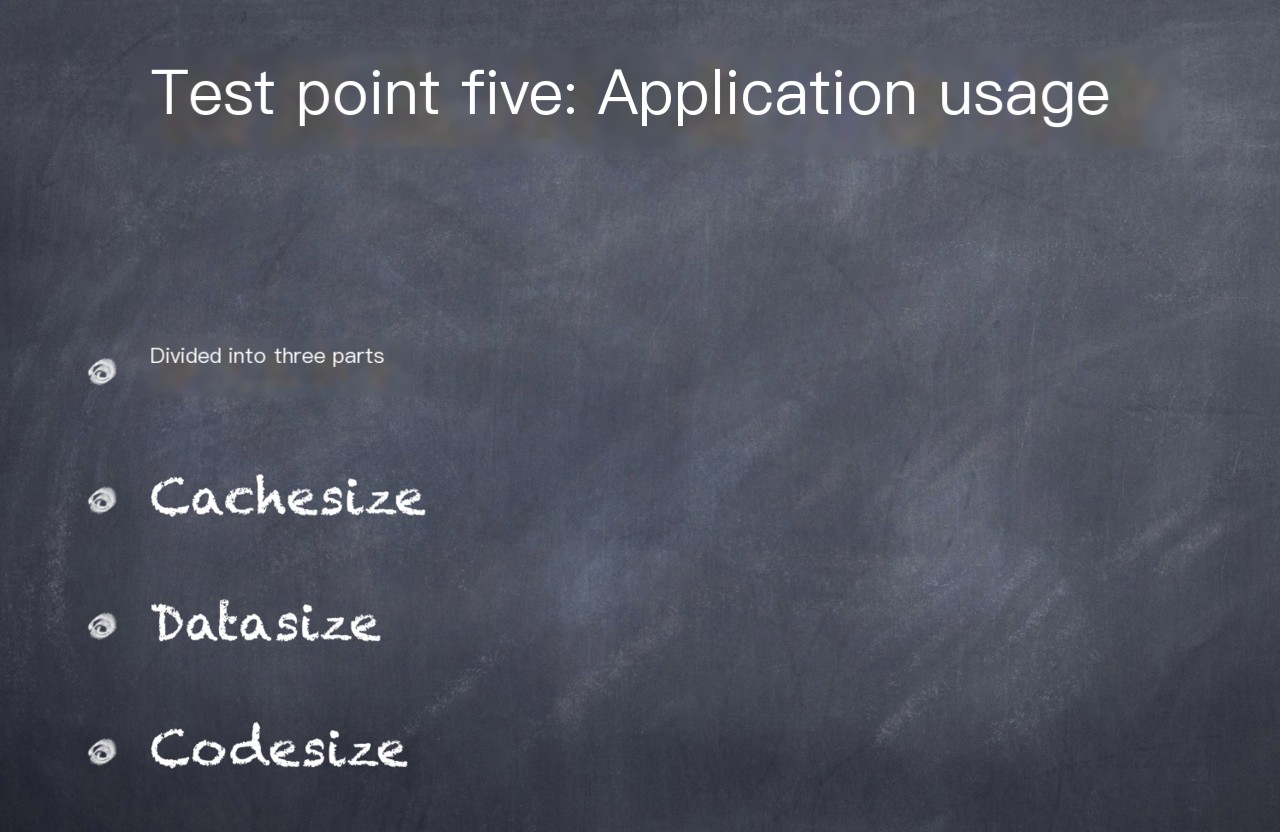
“I have developed an application to monitor the size of three data sets within the application under test. Core code:”
@SuppressLint("NewApi") public void queryPacakgeSize(String pkgName) throws Exception { if (pkgName != null) { PackageManager pm = getPackageManager(); try { Method getPackageSizeInfo = pm.getClass().getDeclaredMethod( "getPackageSizeInfo", String.class, int.class, IPackageStatsObserver.class); getPackageSizeInfo.invoke(pm, "< name="">", Process.myUid() / 100000, new PkgSizeObserver()); } catch (Exception ex) { Log.e(TAG, "NoSuchMethodException"); ex.printStackTrace(); throw ex; } } } </>Then we can see rows and rows of logs!
Battery Level
There are indeed also three ways now.
1. Power Meter (Agilent) – Offers the highest precision, but incurs significant costs and is inconvenient to use. Automation is not feasible.
2. Calculates power consumption based on various data such as CPU, with the unit being mA – Precision is not as high as the power meter, but I cannot disclose the formula here.
3. Acquired through messaging – Offers the lowest precision, with the unit being percentage. Core code.
new BroadcastReceiver() { @Override public void onReceive(Context context, Intent intent) { // TODO Auto-generated method stub int level = intent.getIntExtra(BatteryManager.EXTRA_LEVEL, -1); int scale = intent.getIntExtra(BatteryManager.EXTRA_SCALE, -1); int status = intent.getIntExtra("status", 0); // if (status == BatteryManager.BATTERY_STATUS_CHARGING) else } }; CPU
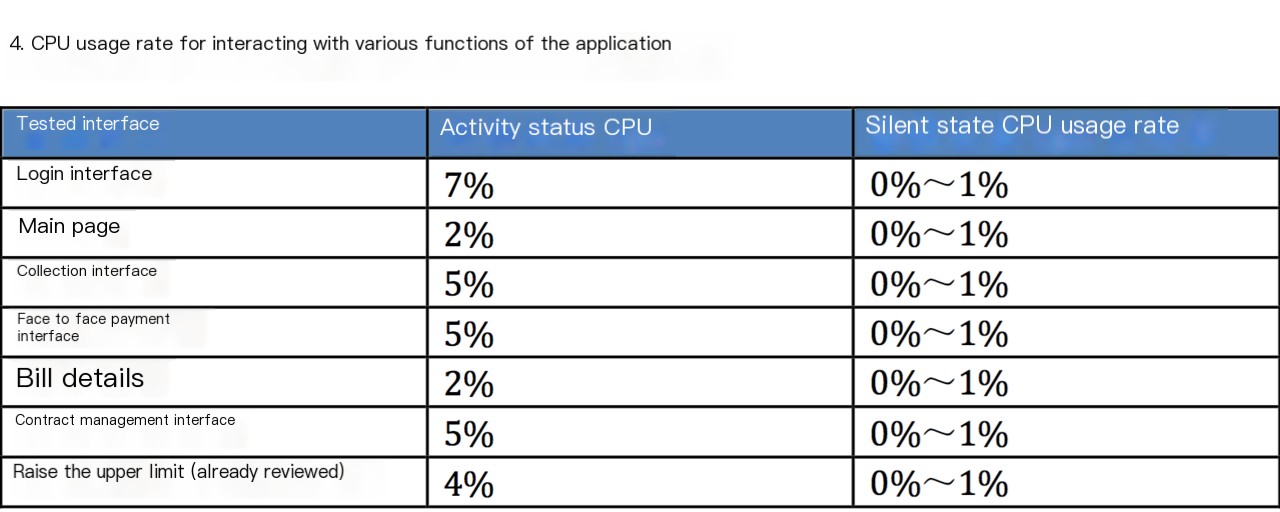
There are also two types, similar to launch performance. Active state and silent state.
Memory Leak
According to unreliable sources, some have mentioned on Stack Overflow that even if you add this parameter, it won’t appear under /misc/data in newer versions of Android OS. I’m still in the process of verifying this. Therefore, the primary source of hprof files is DDMS. However, the reason to emphasize scenarios is because extracting this data alone doesn’t hold significant meaning. MAT analysis typically involves conducting diff comparisons, and these diff comparisons must be based on scenarios.
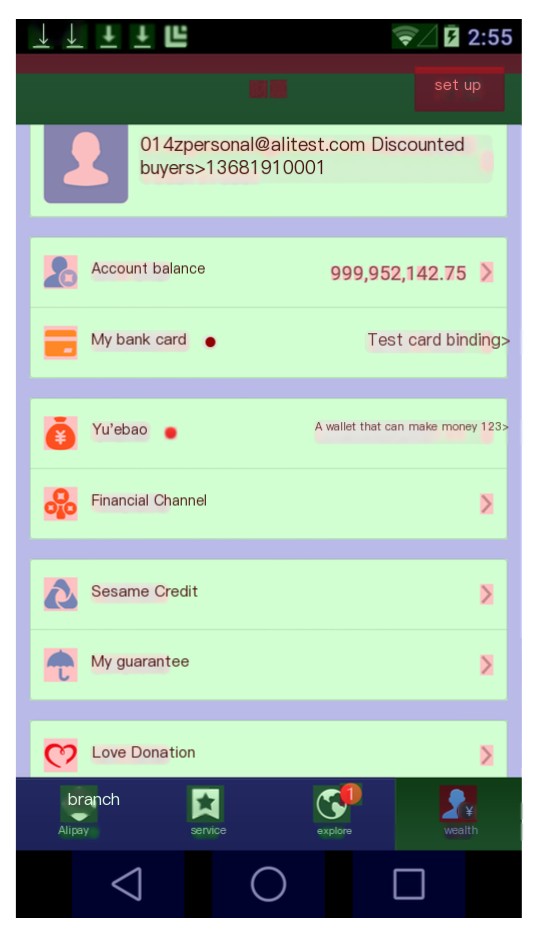
GPU Overdraw Rendering
Before testing, we must always know the standards, right?
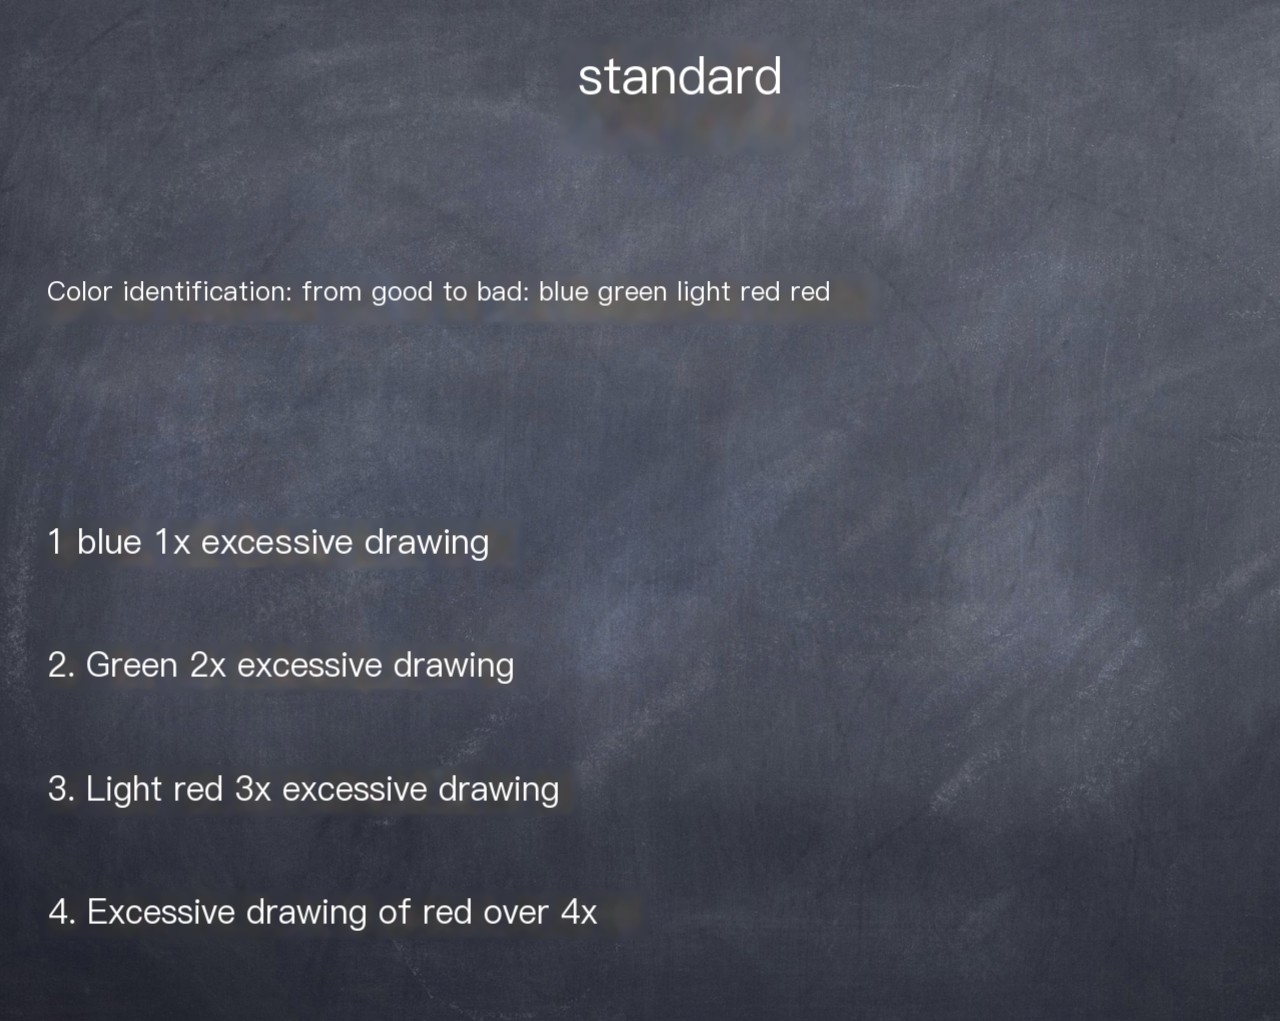
Similarly, testing and analysis will be conducted based on different scenarios. On one hand, comparisons will be made with our own previous versions, and on the other hand, comparisons will be made with competitors. If any aspect exceeds the standards, it will warrant further analysis down to the code.
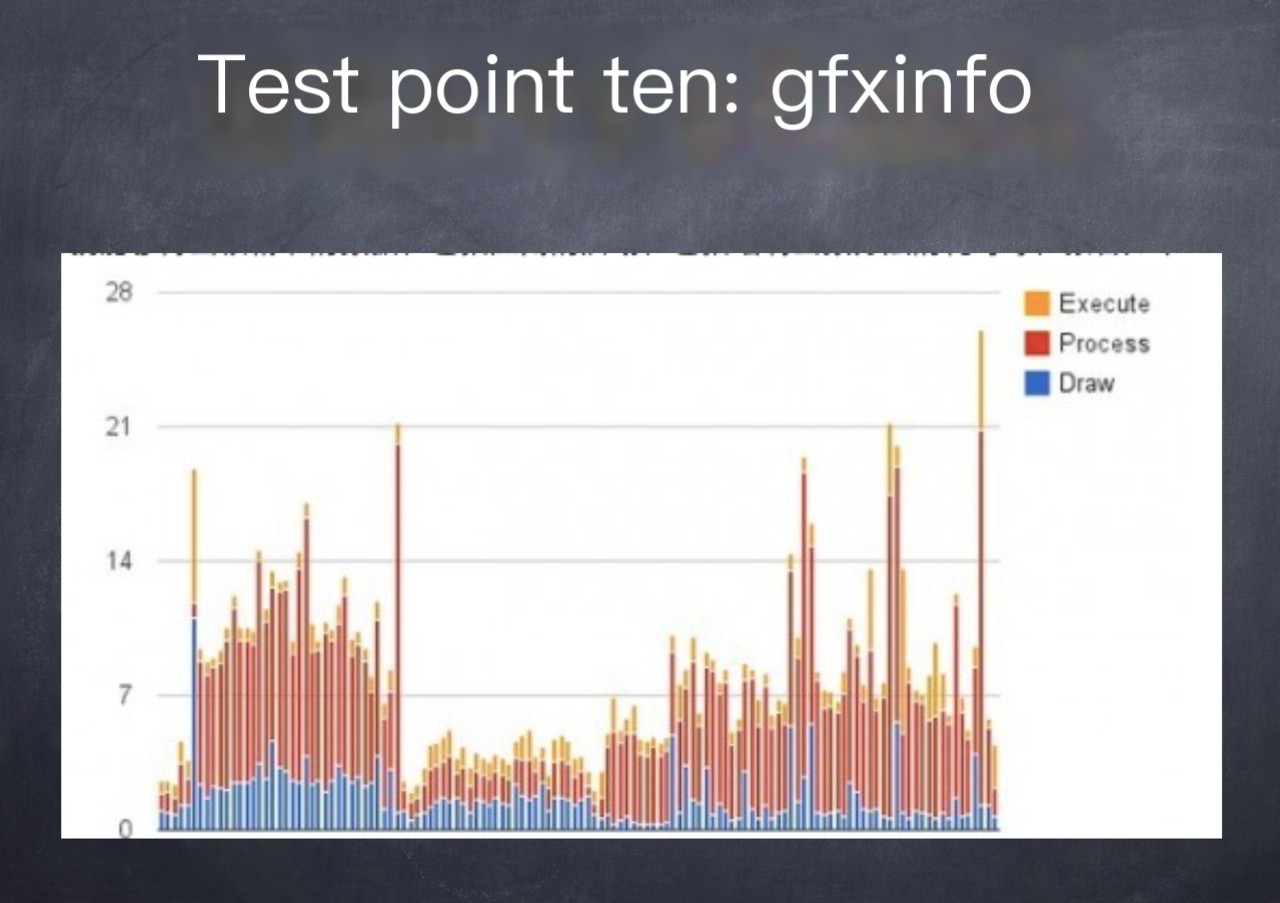
gfxinfo
Similarly, it’s necessary to analyze according to the scenario. Since this feature is dynamic, we need to select the scenario. For example, the listview scenario, or a scenario with tab buttons, where the user performs actions like swiping, scrolling, or switching interfaces to dynamically fetch data.
systrace
It’s essentially something I’ve given up on. Due to various limitations. However, the effectiveness is still quite commendable, and it can uncover more in-depth issues.
I/O Performance
This requires some degree of secondary development. IO performance can significantly enhance the overall performance of the app, potentially improving it by up to 30%. Android primarily uses Xposed, focusing on hooking methods within the target application. For iOS, however, on a jailbroken device, you would use methods like IOStringBuffer to monitor IO header files for analysis. No detailed case study available.
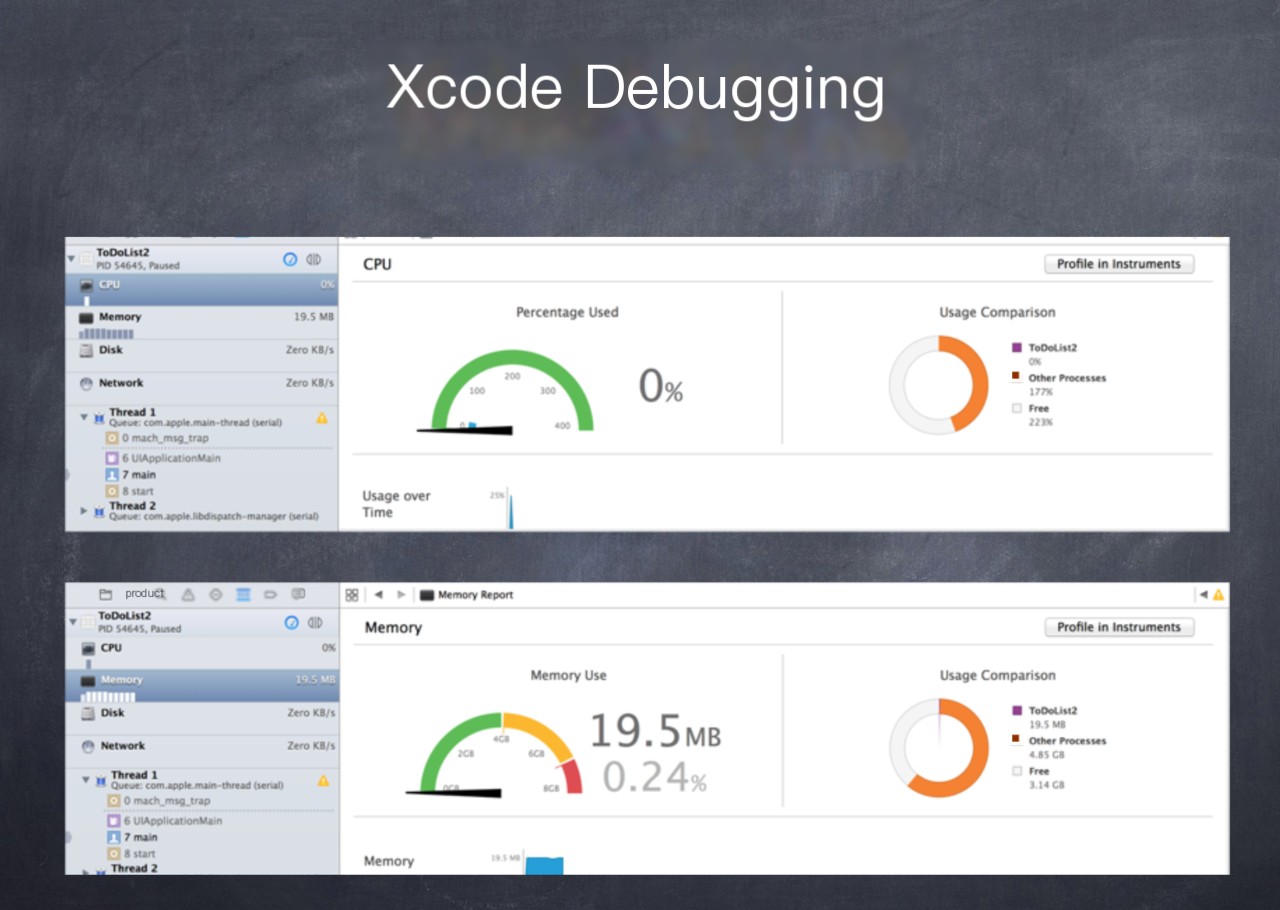
iOS
When it comes to iOS, there’s not much more I want to say. It’s really just about two images.
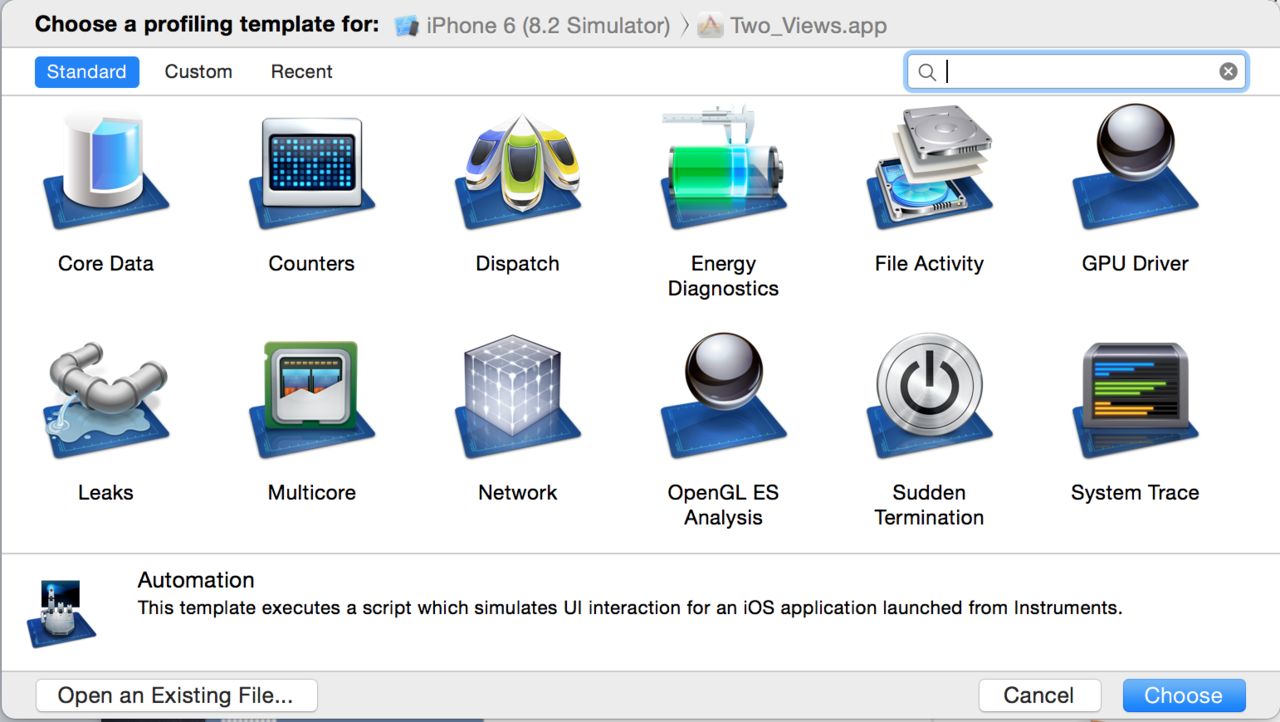
Automation
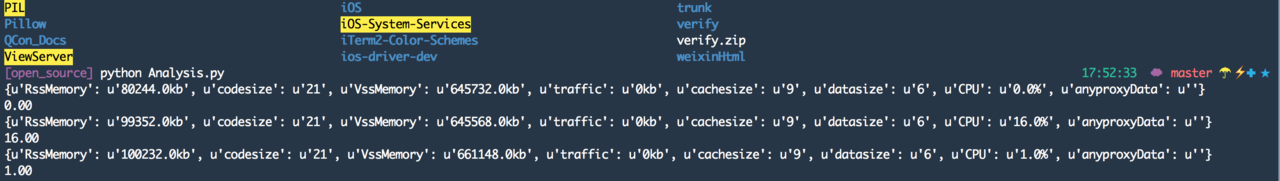
Finally, let’s talk about automation. Initially, I had open-sourced a Python version, but it received a lot of criticism. Later, I ended up reinventing the wheel and created a Java version. The structure is as follows:
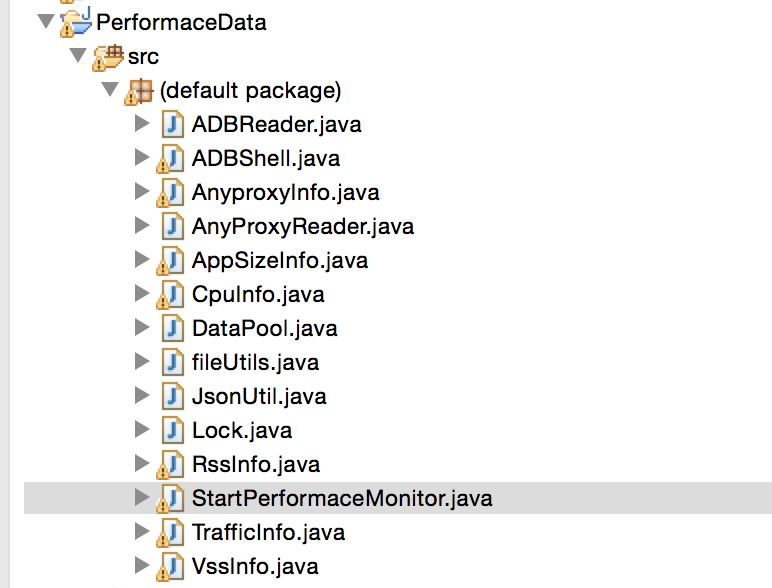
The approach is actually quite simple: encapsulate all the data we can capture using command methods, and then, through multithreading, read the data and write it to a file while it’s running. The monitor code is as follows:
```java
public StartPerformaceMonitor(String filePath, String sn, String PackageName) {
    this.sn = sn;
    this.PackageName = PackageName;
    this.filePath = filePath;
}

public void stop() {
    this.isRunning = false;
}

@Override
public void run() {
    cpu_index = CpuInfo.getCpuIndex(this.sn);
    vss_index = VssInfo.getVssIndex(this.sn);
    rss_index = RssInfo.getRssIndex(this.sn);

    String anyproxyData = "";
    try {
        anyproxyData = AnyproxyInfo.StartCommand();
    } catch (InterruptedException e) {
        // TODO Auto-generated catch block
        e.printStackTrace();
    }

    // TODO Auto-generated method stub
    while (this.isRunning) {
        try {
            try {
                Thread.sleep(5000);
            } catch (InterruptedException e) {
                // TODO Auto-generated catch block
                e.printStackTrace();
            }

            // anyproxy
            anyproxyData = AnyproxyInfo.getALLData();
        } catch (InterruptedException e) {
            // TODO Auto-generated catch block
            e.printStackTrace();
        }

        resultList.put("anyproxyData", anyproxyData + "");

        // traffic
        String traffic = TrafficInfo.getTrafficData(this.sn, this.PackageName);
        resultList.put("traffic", traffic);
        System.out.println("App network traffic consumption: "
            + traffic.substring(0, traffic.length() - 2) + "kb");

        // totalsize = cachesize + datasize + codesize;
        String[] size = AppSizeInfo.getAppSizeData(this.sn, this.PackageName);
        resultList.put("cachesize", size[0]);
        resultList.put("datasize", size[1]);
        resultList.put("codesize", size[2]);
        System.out.println("App cache usage: " + size[0] + "kb"
            + " App data usage: " + size[1] + "kb"
            + " App code usage: " + size[2] + "kb");

        // cpu
        float cpu = CpuInfo.getCpuData(this.sn, this.PackageName, cpu_index);
        resultList.put("CPU", cpu + "%");
        System.out.println("CPU usage rate: " + cpu + "%");

        // mem
        float vss = VssInfo.getVssData(this.sn, this.PackageName, vss_index);
        resultList.put("VssMemory", vss + "kb");
        System.out.println("VSS memory usage: " + vss + "kb");

        float rss = RssInfo.getRssData(this.sn, this.PackageName, rss_index);
        resultList.put("RssMemory", rss + "kb");
        System.out.println("RSS memory usage: " + rss + "kb");

        try {
            Thread.sleep(4000);
        } catch (InterruptedException e) {
            // TODO Auto-generated catch block
            e.printStackTrace();
        }

        // write
        fileUtils.writeFile(this.filePath, JsonUtil.toJson(resultList) + "\n", true);
    }
}
```

In this translation, the code where usage of various resources by an app is logged has been modified to use American English for terms like "App network traffic consumption" to "App network traffic consumption" and "cpu usage rate" to "CPU usage rate ". Keep in mind the need for proper translation of log outputs while maintaining logical code structure and comments at specified locations for future updates or debugging.
Alright, Hengwen mentioned that this article is probably too long for anyone to read through. There is actually much more to discuss. We will continue in the future. Specialization is a profound subject; technology is really just a support. Scenarios, strategy, and analysis are what truly matter.