

GuideTo ensure top-quality user experience, it is crucial to focus on App performance testing. This guide provides comprehensive insights
In app performance testing, traffic testing is a crucial aspect, considering network scenarios (WiFi, non-WiFi) and user scenarios (page loading traffic, usage traffic, standby traffic) are important testing points.
Since the product forms of different businesses vary, the choice of scenarios and traffic targets should be based on the actual situation of the project. This article mainly explains some common traffic testing methods and information that can assist in analysis and positioning during the testing process.
Common App Traffic Testing Methods
There are many methods for app traffic testing. When it comes to traffic testing, perhaps the first reaction is to consider network packet capture tools like tcpdump/Wireshark. Indeed, the Android system does support the tcpdump tool, allowing us to perform very precise traffic tests. Actually, the overall traffic data for a specific APK is stored in the corresponding files within the Android system, and we can obtain the traffic information of the current APK by reading these files.
Method One
——Android System’s Built-in Statistical Function
By directly reading the contents of two files on the Android system: Proc/uid_stat/{UID}/tcp_snd and tcp_rcv, where UID is a unique identifier assigned to the app upon installation. The data in tcp_snd represents the cumulative size of sent data in bytes, while tcp_rcv represents the cumulative size of received data.
These data can be obtained through the adb command to enter the shell.
(1) First, obtain the app’s PID through the package name;
 />
/>
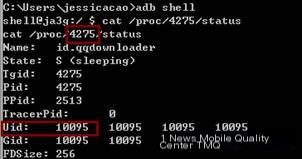
(2) Then access the /proc/{PID}/status file to find the app’s corresponding UID;
 />
/>
(3) Use the UID number plus 10000 to check the traffic files for sending and receiving;
This approach is also used by many mobile security software to easily provide the traffic consumption status of each app. It works fine if we’re interested only in the overall traffic numbers, but if we hope to test for more detailed data, this method can’t meet our testing needs.
Method Two
——Wireshark+tcpdump
The commonly used tools for packet capturing on mobile phones are Wireshark and tcpdump on Linux. Tcpdump requires root permissions, and for iOS, it requires jailbreaking.
(1) First download the tcpdump executable file on a rooted phone and upload it to the phone via the adb push command. Sometimes, pushing directly to the /data directory poses permission issues, so the tcpdump file can be pushed to the sdcard first, then copied from the sdcard to the /data/local directory where permission issues are less frequent. Grant read and write permissions to the tcpdump file.
(2) Then, navigate to the directory where tcpdump is located to execute the command for packet capturing, ./tcpdump -s 0 -w ./t1.pcap -v.

The data labeled “Got” will keep changing with access.
You can refer to the command manual for more on tcpdump commands, and we won’t delve further. The meanings of the parameters mentioned above are:
- -s 0: The default capture length is 68 bytes; with -s 0, the complete data packet can be captured.
- -w ./t1.pcap: Stores the captured content into the t1.pcap file.
- -v: Displays the packet count during the packet capturing process, which is the number beside “Got”.
(3) After capturing packets, transfer t1.pcap to a computer to view and analyze using the Wireshark analysis tool.
Method Three
——GT Tool
GT (Pocket Debug) is an APP pocket debugging platform. It is an “Integrated Debug Environment” (IDTE) that runs directly on a mobile phone. With GT, you can quickly test APP performance (CPU, memory, traffic, power consumption, frame rate/smoothness, etc.), view development logs, crash logs, capture network packets, debug internal APP parameters, and provide real device code timing statistics, all from one phone, without needing a computer connection. The packet capturing tool in GT is encapsulated for usability in Method Two’s tcpdump, allowing you to capture packets anytime, anywhere, without a computer. For more usage methods, please refer to http://gt.qq.com/index.html.
How to Analyze Traffic Testing
Merely testing and reporting an overall result is insufficient for our analysis or for passing the info to developers for pin-pointing. So, what method might help us obtain some data that facilitates analysis and problem location during traffic testing?
Below is my thought process and practice:
Traffic testing concerns both domain name traffic consumption and protocol traffic consumption. For domain name traffic consumption, post-capturing packets, you can tally the traffic consumption under different domain names using available tools.
But what about protocol traffic consumption? How do you calculate the frequency of different protocol extraction and their traffic consumption under different domain names? How do you determine if the extraction frequency is too high or if there is an abnormally large traffic consumption during an extraction?
Our testing strategy involves outputting the related protocol name, request ID, request size, and response size to the local protocol log file wherever there is a network request, and then analyzing the captured packet data using the request ID to confirm the protocol name under the domain name.
The test results will yield both domain name traffic and protocol traffic files. The primary goal of the domain name traffic statistics is to help detect whether any server incurs excessively high traffic consumption, while the protocol traffic statistics aim to identify whether there is exceptionally high traffic consumption or excessive frequency in protocol retrieval.