1. System architecture
The traffic traceback system’s data capture and analysis process generally comprises the following steps:
1. Packet capture – recording the packet flow on the network.
2. Protocol parsing – parsing different network protocols and fields.
3. Search and visualization – browsing data in detail or in summary.
Starting from Wireshark 3.0.0rc1 , TShark can use -G elastic-mappingoptions to generate Elasticsearch mapping files, store them in Elasticsearch and browse them, so that TShark parsing results can be searched and visualized in Kibana.
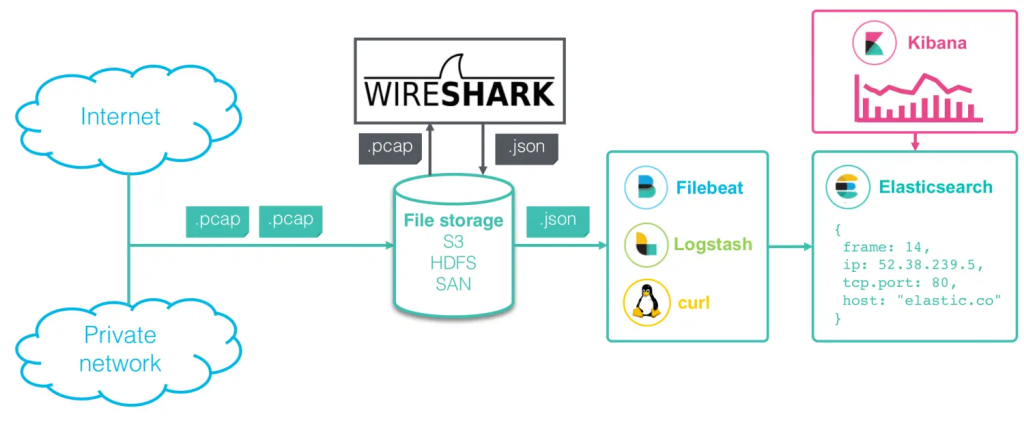
Below, I will show you how to use Wireshark and Elastic Stack to build a traffic backtracking system:

Wireshark+Elastic Stack network data analysis system structure diagram
2. Data capture and analysis
2.1 Using packetbeat
Packetbeat can be configured to capture real-time network packets and use -Ioptions to read packets from capture files. It can identify and parse many application-level protocols, such as HTTP, MySQL, and DNS, as well as general flow information. However, packetbeat uses a conversational approach to analyze packets, and cannot analyze individual packets individually. It tends to focus on the application layer, and does not provide enough analysis at the network level. It also supports limited protocols, which is significantly different from the more than 2,000 supported by tshark.
2.2 Using Wireshark / Tshark
Wireshark is the most popular packet capture and analysis software, which can recognize more than 2,000 protocols with more than 200,000 fields . In addition to GUI interface operation, it also provides command line utilities tsharkto capture live traffic and read and parse capture files. As its output, tsharkreports and statistics can be generated, and packet data in different text formats can also be analyzed.
JSON format output of the Elasticsearch Bulk API is supported since version 2.2 ( released in September 2016 ) .tshark
tshark -i eth0 -T ek > packets.json
eth0Packets will be captured live on the network interface and output to a file in the Elasticsearch Bulk API format packets.json.
tshark -r capture.pcap -T ek > packets.json
capture.pcapPackets will be read from the capture file and output as JSON to the Elasticsearch Bulk API format to a file packets.json.
tshark -r capture.pcap -Y http -e ip.src -e ip.dst -e tcp.srcport -e tcp.dstport -T ek > packets.json
Will capture.pcapread packets from the capture file, filter HTTP protocol fields, and output them as JSON to a file in the Elasticsearch Bulk API format packets.json.
tshark -r capture.pcap -Y http -e ip.src -e ip.dst -e tcp.srcport -e tcp.dstport -Tfileds -t ad -E separator="|" > packets.txt
The data packets will be read from the capture file capture.pcap, the HTTP protocol specified fields will be filtered, and the “|” separator will be added to output to the file in txt format packets.txt.
3. Data format conversion
3.1 Using Ingest Pipeline
Starting with version 5.0, Elasticsearch has introduced the concept of Ingest Pipeline. A pipeline consists of a series of threads that can make many different changes to the data.
The Pipeline example is as follows:
PUT _ingest/pipeline/packets
{
  "description": "Import Tshark Elasticsearch output",
  "processors" : [
    {
      "date_index_name" : {
        "field" : "timestamp",
        "index_name_prefix" : "packets-webserver01-",
        "date_formats": [ "UNIX_MS" ],
        "date_rounding" : "d"
      }
    }
  ]
}
This pipeline simply changes the Elasticsearch index to which the data packets will be written (the default is packets-YYYY-MM-DD). To use this pipeline when importing data, specify it in the URL:
curl -s -H "Content-Type: application/x-ndjson" -XPOST "localhost:9200/_bulk?pipeline=packets" --data-binary "@packets.json"
For more information, see the Ingest module documentation and New way to ingest – Part 1 , Part 2 .
Both Filebeat and Logstash have equivalent configuration options for specifying the receiving Pipeline when sending data to Elasticsearch.
3.2 Using Logstash
Logstash is part of the Elastic Stack and is used as a data processing thread. It can be used to read data in the Elasticsearch Bulk API format and perform more complex transformations and enrichment on the data before sending it to Elasticsearch.
The configuration example is:
logstash.conf
input {
  file {
    path => "/path/to/packets.json"
    start_position => "beginning"
  }
}

filter {
    # Drop Elasticsearch Bulk API control lines
    if ([message] =~ "{\"index") {
        drop {}
    }

    json {
        source => "message"
        remove_field => "message"
    }

    # Extract innermost network protocol
    grok {
        match => {
            "[layers][frame][frame_frame_protocols]" => "%{WORD:protocolRead More
The grok filter frame_frame_protocolsextracts the innermost network protocol name from a field of the format “protocol:protocol:protocol” (e.g. “eth:ethertype:ip:tcp:http”) into the top-level “protocol” field.
4. Import parsing results into Elasticsearch
4.1 Setting up Elasticsearch mapping
The raw data parsed by Wireshark contains a large number of fields, most of which are not searched or summarized, so creating indexes on all of these fields is usually not the right choice.
Too many fields will slow down indexing and querying. Starting with Elasticsearch 5.5, the number of fields in the index is limited to 1000 by default . In addition, tshark -T ekwhether the raw data field value is text or number, including timestamps and IP addresses, they are output as strings.
If you want to specify the correct data type, index numbers as numbers, timestamps as timestamps, etc., to prevent the explosion of index fields, you should explicitly specify the Elasticsearch mapping.
An example of Elasticsearch mapping is as follows:
PUT _template/packets
{
  "template": "packets-*",
  "mappings": {
    "pcap_file": {
      "dynamic": "false",
      "properties": {
        "timestamp": {
          "type": "date"
        },
        "layers": {
          "properties": {
            "frame": {
              "propertiesRead More
“template”: “packets-” specifies that this template is applied to all new indexes that match this pattern.* “dynamic”: “false” specifies that fields not explicitly specified in the mapping should not be indexed.
Unindexed fields will still be stored in Elasticsearch and you can see them in search results, but they cannot be searched or aggregated.
4.2 Writing to Elasticsearch Mapping
To import tshark -T ekthe output data into Elasticsearch, there are several ways.
1. Use curlcommands
curl -s -H "Content-Type: application/x-ndjson" -XPOST "localhost:9200/_bulk" --data-binary "@packets.json"
Note: If your JSON file contains thousands of documents, you may have to split it into smaller chunks and send them to the Bulk API individually, for example using a script. If you have
splita program on your system, you can use it to do that.
2. Use Filebeat
Filebeat is very lightweight and can monitor a set of files or directories for any new files and automatically process them. Read Tshark output files and send packet data to Elasticsearch.
The sample configuration is as follows:
filebeat.yml
filebeat.prospectors:
- input_type: log
  paths:
    - "/path/to/packets.json"
  document_type: "pcap_file"
  json.keys_under_root: true

processors:
 - drop_event:
     when:
       equals:
         index._typeRead More
json.keysunderroot: true Parse data as JSON.index.type: “pcapfile” Remove control lines for Elasticsearch Bulk API.template.enabled: false Use existing templates for Elasticsearch uploads.
3. Use Logstash
Like Filebeat, Logstash can monitor a directory for new files and automatically process them. Compared to Filebeat, it can transform data more extensively than the Elasticsearch Ingest Pipeline.
See section 3.1 Transforming Data for an example of Logstash configuration.
5. Kibana query and display
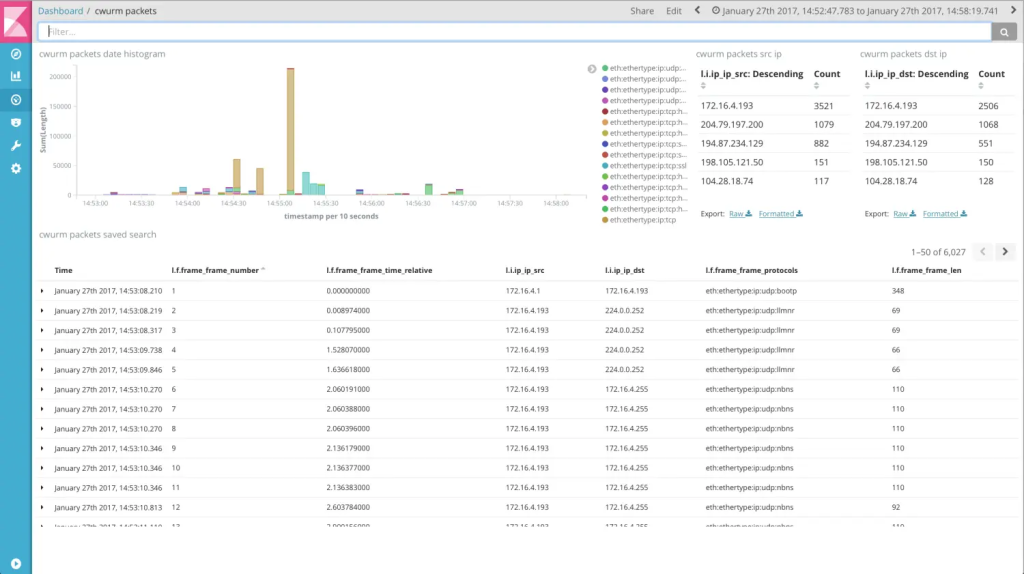
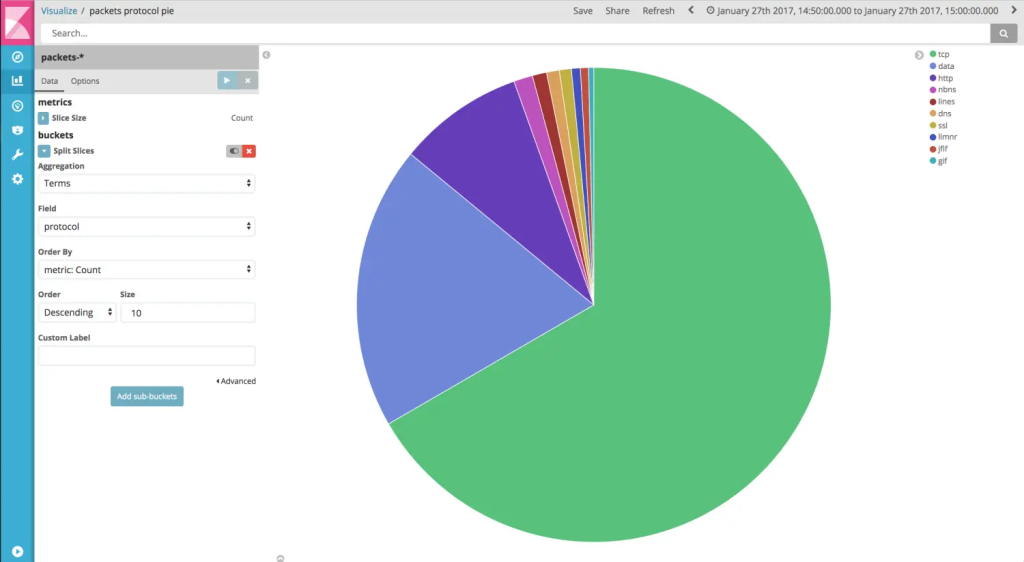
In Kibana, you can now browse data packages and build dashboards on top of them.
5.1 Chart Display

Detailed view of network data, including a table that displays raw packet data in expandable rows
* Detailed view of network data, including a table that displays raw packet data in expandable rows

Pie chart showing the distribution of network protocols
* Pie chart showing the distribution of network protocols
5.2 Kibana Settings
Since network data from Wireshark has a different data format than e.g. syslog, it makes sense to change some settings in Kibana (Admin tab -> Kibana Advanced Settings).
Kibana is configured as follows:
shortDots:enable = true
format:number:defaultPattern = 0.[000] (2)
timepicker:timeDefaults = {
  "from": "now-30d",
  "to": "now",
  "mode": "quick"
}
shortDots:enable = true Shorten the names of long nested fields, for example, change
layer.frame.frame_frame_numbertol.f.frame_frame_number.format:number:defaultPattern = 0.000 Change the display format number, do not display the thousands separator.timepicker: timeDefaults Set Kibana to display data within the last 30 days.
6. Summary
This document presents an overview of integrating Wireshark with the Elastic Stack to create an efficient network data analysis system. It outlines the system architecture, emphasizing key steps like packet capture, protocol parsing, and data visualization using tools such as TShark and Kibana. The integration leverages Wireshark to produce Elasticsearch mapping files, enabling comprehensive searches and visualizations in Kibana. The document highlights the use of Packetbeat for capturing real-time application-layer protocol data and TShark for a wider protocol range, each with unique capabilities for network analysis. It provides details on formatting data with Elasticsearch’s Ingest Pipeline and Logstash, facilitating complex data transformations before importing into Elasticsearch. Key configurations for Elasticsearch are discussed to optimize data indexing, crucial for managing numerous fields captured by Wireshark. The document elaborates on data import methods using `curl`, Filebeat, and Logstash, with examples provided for each approach. In the final section, it highlights Kibana’s role in querying and visualizing network data. Best practices for configuring Kibana to enhance compatibility with network data are discussed. Visual aids, like charts and tables, are used to present a detailed view of the analyzed data, underscoring the power of the Wireshark and Elastic Stack integration in network monitoring and analysis.


