

What is traffic testing?
Why conduct traffic tests?
What are the methods for traffic testing?
How to calculate traffic and analyze results?
With these questions in mind, let’s explore Android network traffic testing methods.
With the proliferation of smartphones, mobile internet evolves rapidly. While enjoying the convenience of mobile internet, people also need to pay expensive “traffic” fees to network operators (under mobile networks). The following traffic reminder text message may be familiar to many users:
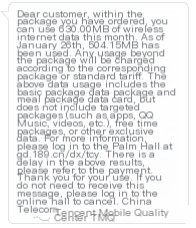
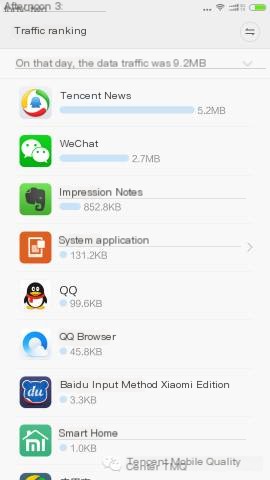
In fact, this traffic is generated when applications on your phone perform network communication. Many traffic tools can help us calculate the traffic consumed by each application. Below is an example of traffic consumption statistics from Xiaomi’s “Security Center” network assistant:
According to Wikipedia, network traffic refers to the data traffic that occurs on a network by devices capable of network connection. Traffic has four different aspects of meaning at the user level, website level, management level, and comprehensive level. Here, we primarily discuss its significance at the user level, known as traffic.
With the advent of the 3G and 4G eras, mobile network speeds are increasing, and traffic charges are becoming cheaper. However, to this day, traffic charges are still very expensive for many users, and monthly traffic packages are still insufficient. Whether an application consumes a lot of traffic may affect the user’s usage frequency and even determine whether the user will continue using it.
Traffic testing can detect abnormal traffic and areas for improvement by measuring the traffic generated by the application in specific usage scenarios, encouraging the application to save traffic.
In addition to saving traffic, traffic optimization can indirectly achieve the following effects:
(1) Improve user experience (pages open faster)
(2) Reduce server pressure
Network transmission follows the TCP/IP protocol. Data at the application layer must pass through the TCP layer, IP layer, and Ethernet interface layer’s packaging process before being transmitted through the physical link. When applications transmit data over the network, the data is sent into the protocol stack, passing through each layer until delivered as a bit stream into the network. Each layer adds some header information to the received data (sometimes also tail information), and the data unit that TCP passes to IP is called a TCP segment. The data unit that IP passes to the network interface layer is called an IP Datagram. The bit stream transmitted through Ethernet is called a Frame, as illustrated below.
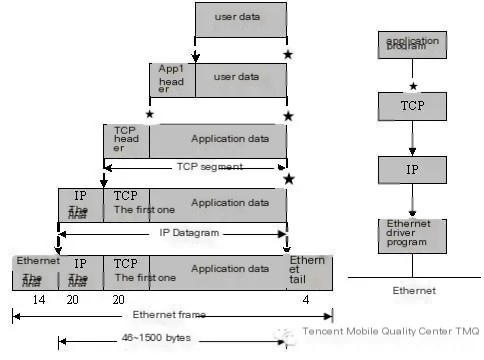
Therefore, when you see the same data packet recorded differently in other places, it is usually because they are measured with different dimensions.
There are many tools and methods for traffic testing, roughly classified into the following three types based on implementation principles:
【Method 1】Tcpdump packet capture + Wireshark analysis
【Method 2】Reading Linux traffic statistics files
【Method 3】Using Android traffic statistics API
The following are respective introductions for these three methods:
Tcpdump packet capture
(1) The phone requires root permissions
(2) Download tcpdump from http://www.strazzere.com/android/tcpdump
(3) adb push c:\wherever_you_put\tcpdump /data/local/tcpdump
(4) adb shell chmod 6755 /data/local/tcpdump
(5) adb shell, su to obtain root permissions
(6) cd /data/local
(7) /tcpdump -p -vv -s 0 -w /sdcard/capture.pcap
(8) adb pull /sdcard/capture.pcap d:/
Command parameter descriptions:
(For more parameter descriptions, refer to: http://www.cnblogs.com/ggjucheng/archive/2012/01/14/2322659.html)
(1)-p: Normally sets the network interface to non-promiscuous mode.
(2)–vv: Generates more detailed output than -v.
(3)-s 0: The default packet capture length is 68 bytes. Adding -S 0 captures the full data packet.
(4)-w ./target.cap: Saves as a cap file for convenient analysis with Ethereal (i.e., Wireshark).
(5) tcp: The options like ip, icmp, arp, rarp, and tcp, udp, icmp should be placed in the first parameter position to filter the type of datagram.
(6)-i eth1: Only captures packets passing through the interface eth1.
(7)-t: Does not display timestamps.
(8)-c 100: Only captures 100 packets.
(9)dst port ! 22: Does not capture packets whose destination port is 22.
(10)src net 192.168.1.0/24 : The source network address of the packet is 192.168.1.0/24.
A: The reason is the wrong network interface. Different phones may use different network interfaces for communication.
The Tcpdump command has the -i interface parameter to specify the interface tcpdump needs to monitor. If unspecified, tcpdump will search for the lowest numbered configured interface in the system interface list (excluding the loopback interface). Once locating the first qualifying interface, the search stops immediately.
On Linux operating systems with a 2.2 version or later kernel, the ‘any’ virtual network interface can be used to receive packets on all network interfaces (note: this will include those intended for this network interface and those not). If the real network interface cannot work in ‘promiscuous’ mode, packets cannot be captured on this virtual network interface named ‘any’. Hence, if using
./tcpdump -p -vv -s 0 -w /sdcard/capture.pcap
packet capture is zero, you can try
./tcpdump -i any -p -s 0 -w /sdcard/capture.pcap
If it still doesn’t work, you need to check which network interface the phone uses. The method is as follows:
(1) adb shell, su to obtain root permissions
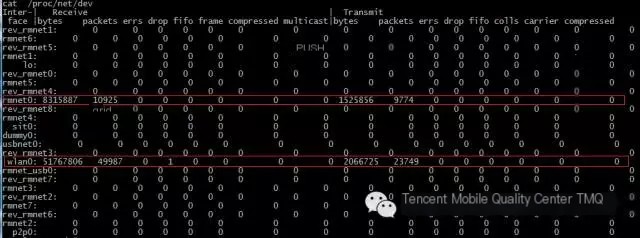
(2) cat /proc/net/dev
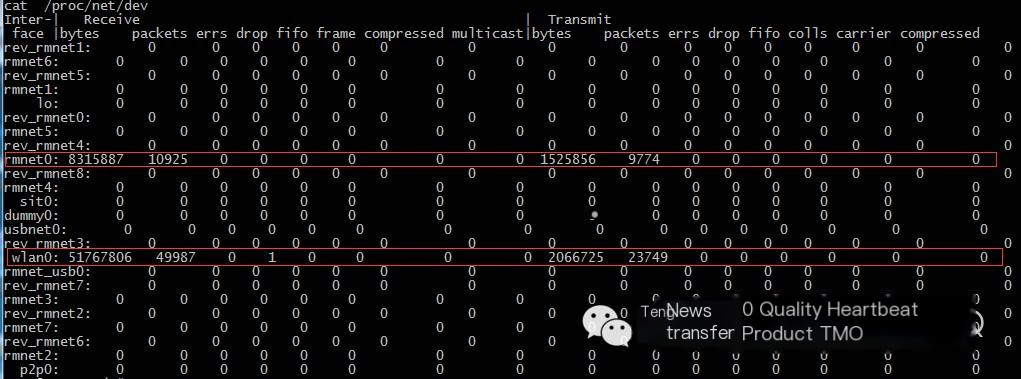
As shown above: lo indicates local traffic, rmnet0 indicates mobile network traffic, and wlan0 indicates WiFi traffic. Therefore, if capturing mobile network packets, the command should change to:
./tcpdump -i rmnet0 -p -s 0 -w /sdcard/capture.pcap
Wireshark traffic statistics
Open the previously captured packet file with Wireshark, use the filter to filter results based on the syntax of Wireshark display filters. Assuming the target server address for the APP is (121.14.76.22)
Filter syntax:
“Incoming traffic” ip.src == 121.14.76.22
“Outgoing traffic” ip.dst == 121.14.76.22
So, how do we calculate the size of these filtered packets? Under statistics, there is a summary.
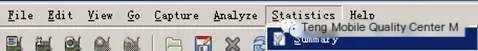
The data we need is located here.
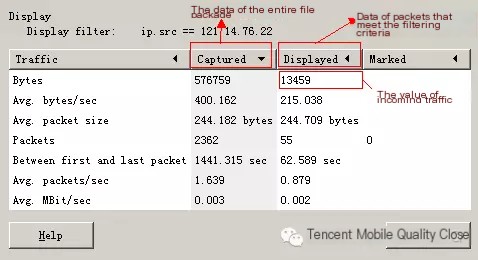
The incoming traffic data we need is the value in the red frame.
http://www.cnblogs.com/tankxiao/archive/2012/10/10/2711777.html
Linux system saves traffic statistics files in three places:
(1) In /proc/net/dev, traffic can be viewed for each network interface.
(2) In /sys/class/net/ the corresponding category directory (e.g., rmnet0) can be found. Under its subdirectory statistics, rxbytes and txbytes record received and sent traffic.
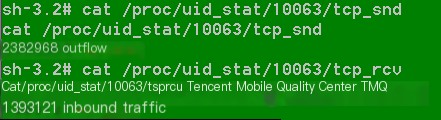
(3) In /proc/uid_stat/{uid}/tcp_rcv record the uid application’s downloaded traffic bytes, and /proc/uid_stat/{uid}/tcp_snd records the upload traffic bytes of the uid application.
Differences and similarities of traffic statistics from three places are as follows:
| Statistics Source | Network Interface Distinction | App Distinction | Description |
|---|---|---|---|
| /proc/net/dev | Yes | No | Distinguishes between local, mobile, and WiFi traffic. Statistics for the entire system. |
| /sys/class/net/ | Yes | No | Distinguishes between local, mobile, and WiFi traffic. Statistics for the entire system. |
| /proc/uid_stat/{uid} | No | Yes | Statistics traffic for the app based on uid. |
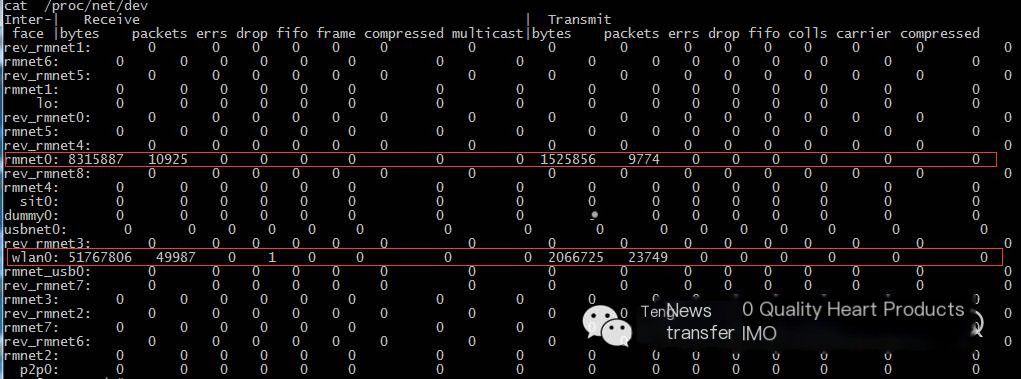
/proc/net/dev output content:
/proc/uid_stat/{uid}/tcp_rcv operation method:
(1) After entering the phone via adb shell, execute ps

The value of Uid is 63+10000=10063, i.e., add 10000 to the number following the APP being measured.
(2) Simply cat this file, with bytes as the unit.
In Android traffic statistics, the TrafficStats class newly introduced since version 2.2 can easily obtain such statistics. The TrafficStats class itself parses the file system objects provided by Linux (the three types of files mentioned in Method 2). The android.net.TrafficStats class provides many static methods, which can be directly invoked, and the return type is long. If the return equals -1, it means UNSUPPORTED; the current device does not support statistics. Its main methods:
static long getMobileRxBytes()//Get the total number of bytes received through Mobile connections, excluding WiFi
static long getMobileRxPackets()//Get the total number of data packets received through Mobile connections
static long getMobileTxBytes()//Total bytes sent by Mobile
static long getMobileTxPackets()//Total data packets sent by Mobile
static long getTotalRxBytes()//Get total received bytes, including Mobile and WiFi, etc.
static long getTotalRxPackets()//Total received data packets, including Mobile and WiFi, etc.
static long getTotalTxBytes()//Total sent bytes, including Mobile and WiFi, etc.
static long getTotalTxPackets()//Total sent data packets, including Mobile and WiFi, etc.
static long getUidRxBytes(int uid)//Get the received bytes of a specific network UID
static long getUidTxBytes(int uid)//Get the sent bytes of a specific network UID
These are cumulative statistics from the first program startup to the last startup and are not the “from boot to shutdown for this session” statistics mentioned in this article!
Usage example, note that the values obtained here are in “KB”
Besides these conventional three methods, some traffic testing methods can be used under specific scenarios:
(1) Set the phone to use pc network, and capture packets via Wireshark on the pc end.
(2) Set the PC browser (e.g., Chrome) to a mobile UA, and test traffic using the built-in network analysis tool or packet capture tool. This method is suitable for web front-end page traffic testing.
Testing the traffic size can usually only identify issues; further problem pinpointing requires traffic analysis (traffic analysis needs the pcap packet captured by Method 1).
If the absolute value of traffic is not a clear indicator, compare against several similar products. If the application being tested has much higher traffic than similar products when completing the same transaction, it may be considered high and potentially has optimization space.
The following is a traffic comparison between opening a webpage using 58.com’s X5 kernel and system kernel:
| X5 Kernel | System Kernel | |
|---|---|---|
| Traffic | 656 KB | 525 KB |
It is evident that the X5 kernel has higher traffic. The reasons need to be analyzed.
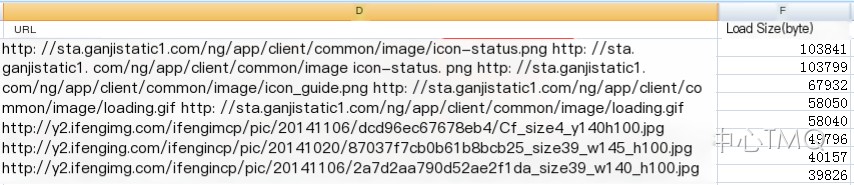
Arrange network request resources from largest to smallest in size and compare against normal network requests. If there are discrepancies in the number or size of requested resources, this is likely where the issue lies.
Take the following example. Using the webperf tool, the resources requested in the pcap packet are analyzed out. Comparing reveals two duplicate resource requests by the proxy (introduction to webperf tools found in the appendix):
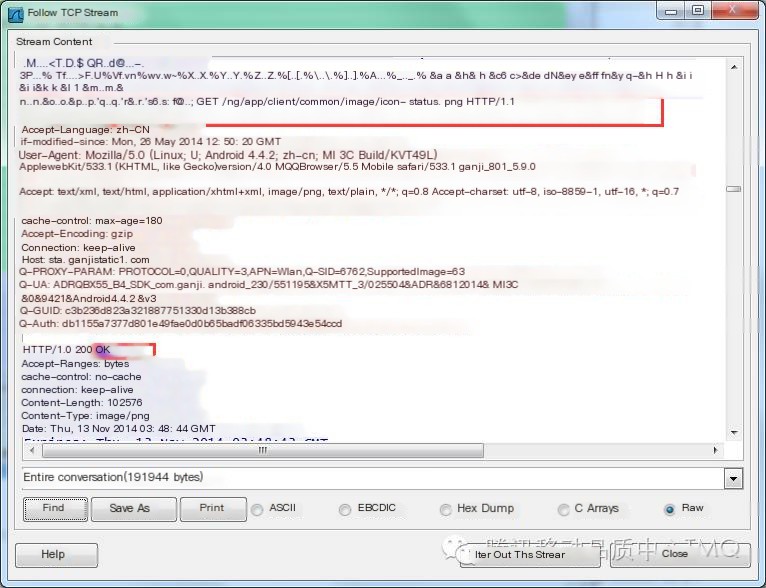
Further inspection using Wireshark confirms duplicate requests for an image resource.
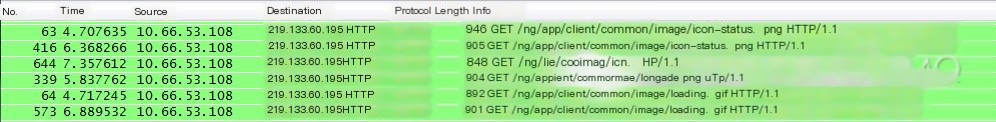
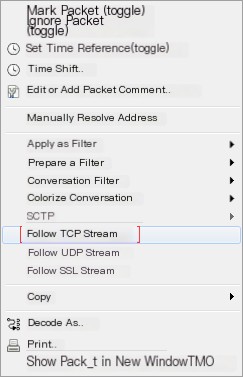
Follow TCP Stream and examine the icon-status.png resource
The system kernel returns 200 the first time and 304 the second time (cached from a previous request), while our proxy returns 200 both times.
Backend development colleagues located that it was a bug in the backend image server causing the issue. The problem was resolved accordingly.
Network packet quantity issues
(1) Redundant requests (advertisements that should have been filtered out, or unrelated requests)
(2) Duplicate requests (the same resource requested multiple times)
(3) Cache invalidation (resources that should read from cache but initiate a network request)
(4) Excessive request frequency (such as push heartbeats; if increasing frequency appropriately can improve business stability, but too high increases traffic)
(5) Unmerged requests (merging requests reasonably can save traffic)
(6) Excessive retransmissions (inappropriate retransmission logic on the terminal)
(7) Missing requests (some resources not requested or no response due to parsing errors of main resources)
Network packet size issues
(1) Uncompressed HTTP headers (some businesses do this to save traffic)
(2) Irresponsible image compression (the backend may return images compressed with different ratios based on the phone model)
(3) Other issues affecting network packet size (such as network protocol, server logic errors leading to abnormal network packet size)
For more in-depth traffic analysis, you need to master more network knowledge, such as:
TCP communication process analysis
(1) Tcpdump Batch File
Document the steps for Method 1 into a batch file to execute (the tcpdump file must be in the current directory).
1) Start tcpdump
adb push tcpdump/data/local/tcpdump
adb shell chmod 6755 /data/local/tcpdump
adb shell rm -r/sdcard/capture.pcap
adb shell /data/local/tcpdump -i any -p -s 0 -w /sdcard/capture.pcap
pause
2) Download tcpdump file onto computer
adb pull/sdcard/capture.pcap capture.pcap
Note: Some devices may not default to a root user after rooting and entering adb shell; you need to input su to switch to root. Therefore, executing a batch will encounter issues. Solve this as follows:
adb shell “su -c ‘sleep 1′”
adb start-server
adb push tcpdump/data/local/tcpdump
4) Root permission issues
adb shell su -c “/data/local/tmp/tcpdump -i any -p -s 0 -w /sdcard/netCapture.pcap”
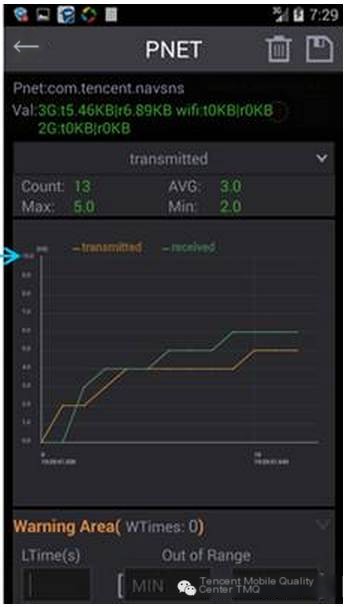
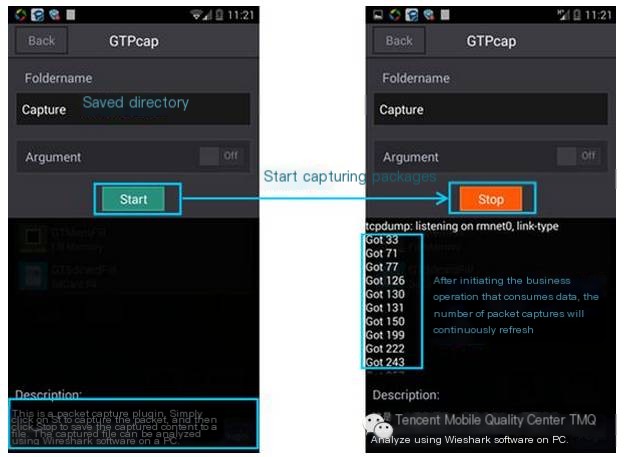
(2) GT Tool
GT’s traffic test module features two characteristic functions:
1) Automatically generate traffic trend charts:
2) Capture pcap packets on the mobile terminal:
(1) Webperftool analysis
(2) PcapPerf Gantt chart analysis
(3) Chrome’s built-in tool analysis
(4) Chrome trace file analysis
1. Basic Wireshark usage
Introduction to Wireshark and learning the TCP three-way handshake
2. Filtering rules
3. Browser’s built-in packet capture tool like Chrome, Firefox. This method can be more direct and efficient when the test subject is a web page.
If you find packet capturing cumbersome, using Chrome’s console can solve most issues directly: