

Ever since there has been the internet, there have been network failures, with packet loss being the most prominent issue. Diagnosing packet loss has always been a headache for engineers, yet few people focus on analyzing the causes of packet loss.

Reality
Currently, the traditional process for handling packet loss in networks is as follows:
- First, identify the device experiencing packet loss.
- Then, determine the processing workflow of the packets on that device.
- Finally, verify each forwarding table entry corresponding to the processing workflow (from software entries to hardware entries).
You might feel that verifying forwarding table entries one by one is too slow and cumbersome, but once you get familiar with the chip’s processing workflow and functions, you can adopt the following approach:
- First, still identify the device experiencing packet loss.
- Then, use some diagnosis functions provided by the chip for confirmation, such as Broadcom’s Flexible Counter and Mediatek’s drop statistics.
- Finally, determine the true cause of packet loss based on the hardware-reported packet loss reasons.
Although the steps seem clear, executing them requires a very thorough understanding of the processes and mechanisms involved to accurately diagnose the cause of packet loss. At present, manufacturers have not provided advanced methods or solutions for diagnosing packet loss.
Why is this the case
What has caused network diagnostic methods to show no substantial development over a long time? Primarily due to the following aspects:
- The closed nature of NOS
- NOS manufacturers’ reluctance to expose more details to customers
- Historically, NOS have been specialized systems that could not provide convenience like tcpdump on servers
- NOS architectures generally are mips, with computing power incomparable to x86
- Diagnosis provided by chip manufacturers is significantly limited.
- Flexible counter offers statistics based on the reasons for packet loss, allowing for counting packets lost for multiple reasons per port. However, to understand the specific reason, you need to adjust the reason bitmap, consulting the manual to adjust the bitmap.
- Drop statics offer statistics of packet loss per port while providing a reason status bitmap (loss cause). Unfortunately, this reason status bitmap is global, not port-based, and has some interference.
Ideal
Imagine when you find network failure, you open an application that tells you that one of your packets was dropped due to some reason at a port on a certain device in the network. You verify the corresponding configuration, discover that someone modified the configuration, adjust it back, and the problem resolves within minutes. Isn’t that much more straightforward compared to the traditional two methods?
Why do this
At this point, people can’t help but ask why traditional network manufacturers haven’t done this. Perhaps it can’t be done?
Now is an era of prevalent open network operating systems, bringing along white-box switches. The control plane CPU of white-box switches is no longer limited to the traditional mips architecture, supporting x86 and ARM as well. The trend of switch serverization is brewing, and it can be anticipated that x86 switches will become prevalent.
Overall, there are two important trends in this era:
- Openness, with users paying more attention to system development and openness.
- x86 has unleashed powerful computing capabilities; how to utilize it?
The difficulties of diagnosis and analysis and the trend towards open networks make facilitating diagnostic analysis a necessity and also an opportunity.
How to do it
Ideals are realized step by step. To achieve this ideal, follow these steps:
- Be able to see basic information about packet loss over a recent period through show commands in the console and export this basic information.
- See detailed information about packet loss over a recent period through show commands in the console, supporting the analysis of exported basic information (Wireshark plugin).
- Deploy applications to collect and statistically categorize packet loss information by rules.
A small step
When thinking about packet loss, the first concern for users is which port experienced packet loss and what the packet loss reason is, so the content of the show command is defined as follows.
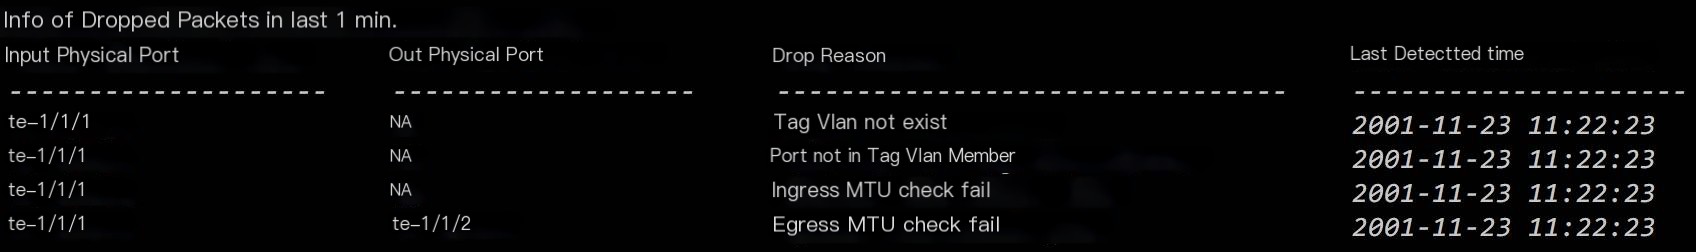
Cache these dropout cases on the device and update the time when they were last detected.
Next is how to obtain this packet loss information, analyze over 20 different root causes of packet loss in data center scenarios, and first divide them into two categories:
- Situation 1: Loss, the CPU can obtain the original packet.
- Situation 2: Loss, the CPU cannot obtain the original packet.
Situation 1
Most packet loss in the forwarding pipeline can typically get the discarded original packet, including:
- Packet carried uncreated VLAN
- Port not in the corresponding VLAN
- Route lookup failure
- l3 MTU check failure
- stp state and others
For these packet loss situations, the chip can retrieve the original packet for analysis and classification statistics. Situation 2
Some losses in the forwarding pipeline cannot provide the original packet, such as:
- Exceeding buffer threshold packet loss
- Parsing error packet loss
- Packet checksum error loss
- Ingress MTU loss (depends on MTU check implementation)
For these packet loss situations, the corresponding state can be retrieved from the chip’s state information and then classified for statistics.
Meanwhile, to support exporting information for subsequent analysis, the agent’s export format of packet loss information is defined as follows:
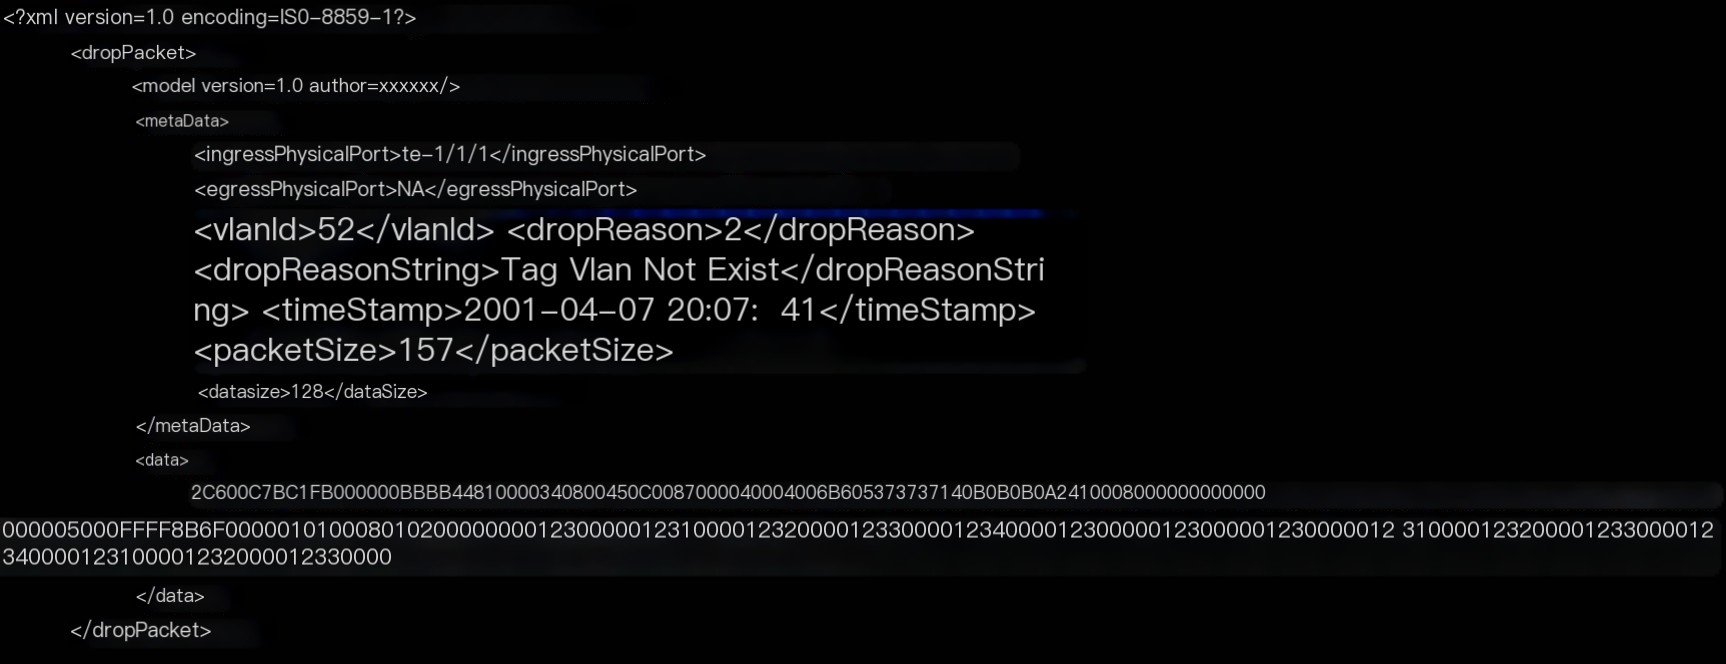
The above structure includes the truncated first 128 bytes of the packet (if the original packet is available), mainly provided for application analysis.
A further step
After completing the first step, in some scenarios, only a vague cause of packet loss can still be determined, correlating with the direct cause and still missing a step to find the root cause. For instance, l3 lookup miss, if one cannot know the destination port IP of the packet, subsequent analysis becomes impossible. Thus, the need for users to view the detailed information of the corresponding packet becomes crucial at this time.
We need to analyze which packet information is necessary for users in such scenarios, and the analysis results are as follows:
- Layer 2 header information, smac, dmac, etype, length. 802.1q
- Tag information, tpid, VLAN id.
- Layer 3 header information, sip, dip, tos, ip length, ttl, ip protocol.
- ARP header information, smac, tmac, sip, tip, op_code.
- Layer 4 header information, source port, dest port.
Thus, in the packet loss case cached by the device, not only the packet loss’s metadata is saved, but also the parsed result of the packet of the most recent loss in the case. On the CLI, the corresponding information can be displayed in the following format through commands.
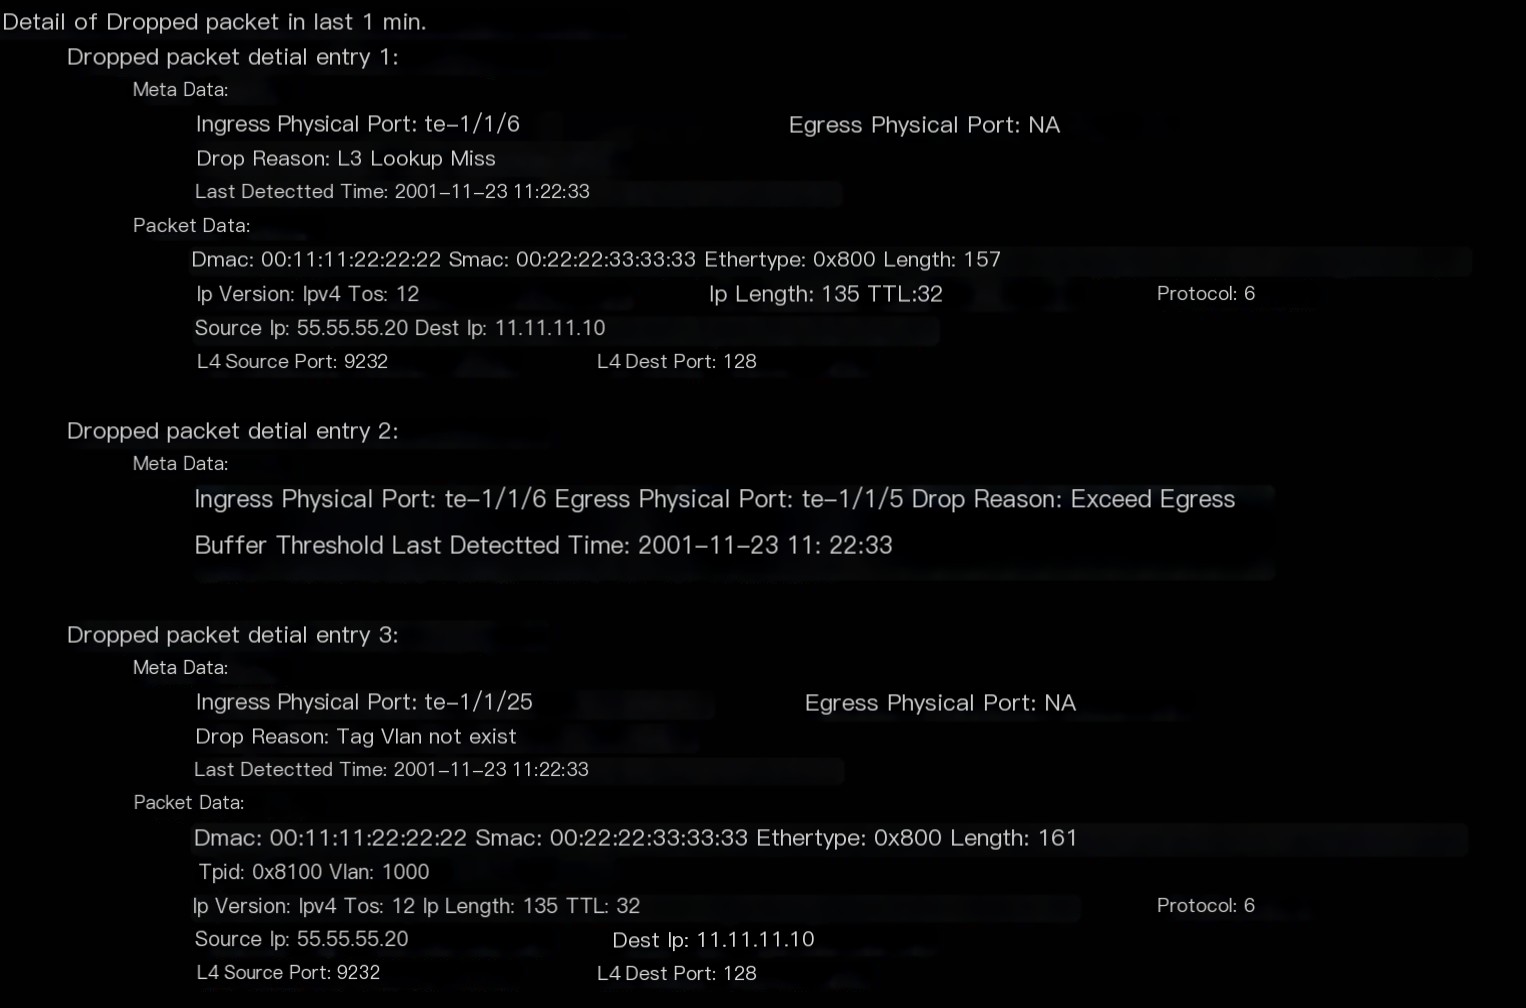
Above are three examples, where two can obtain the original discarded packet information, and one cannot.
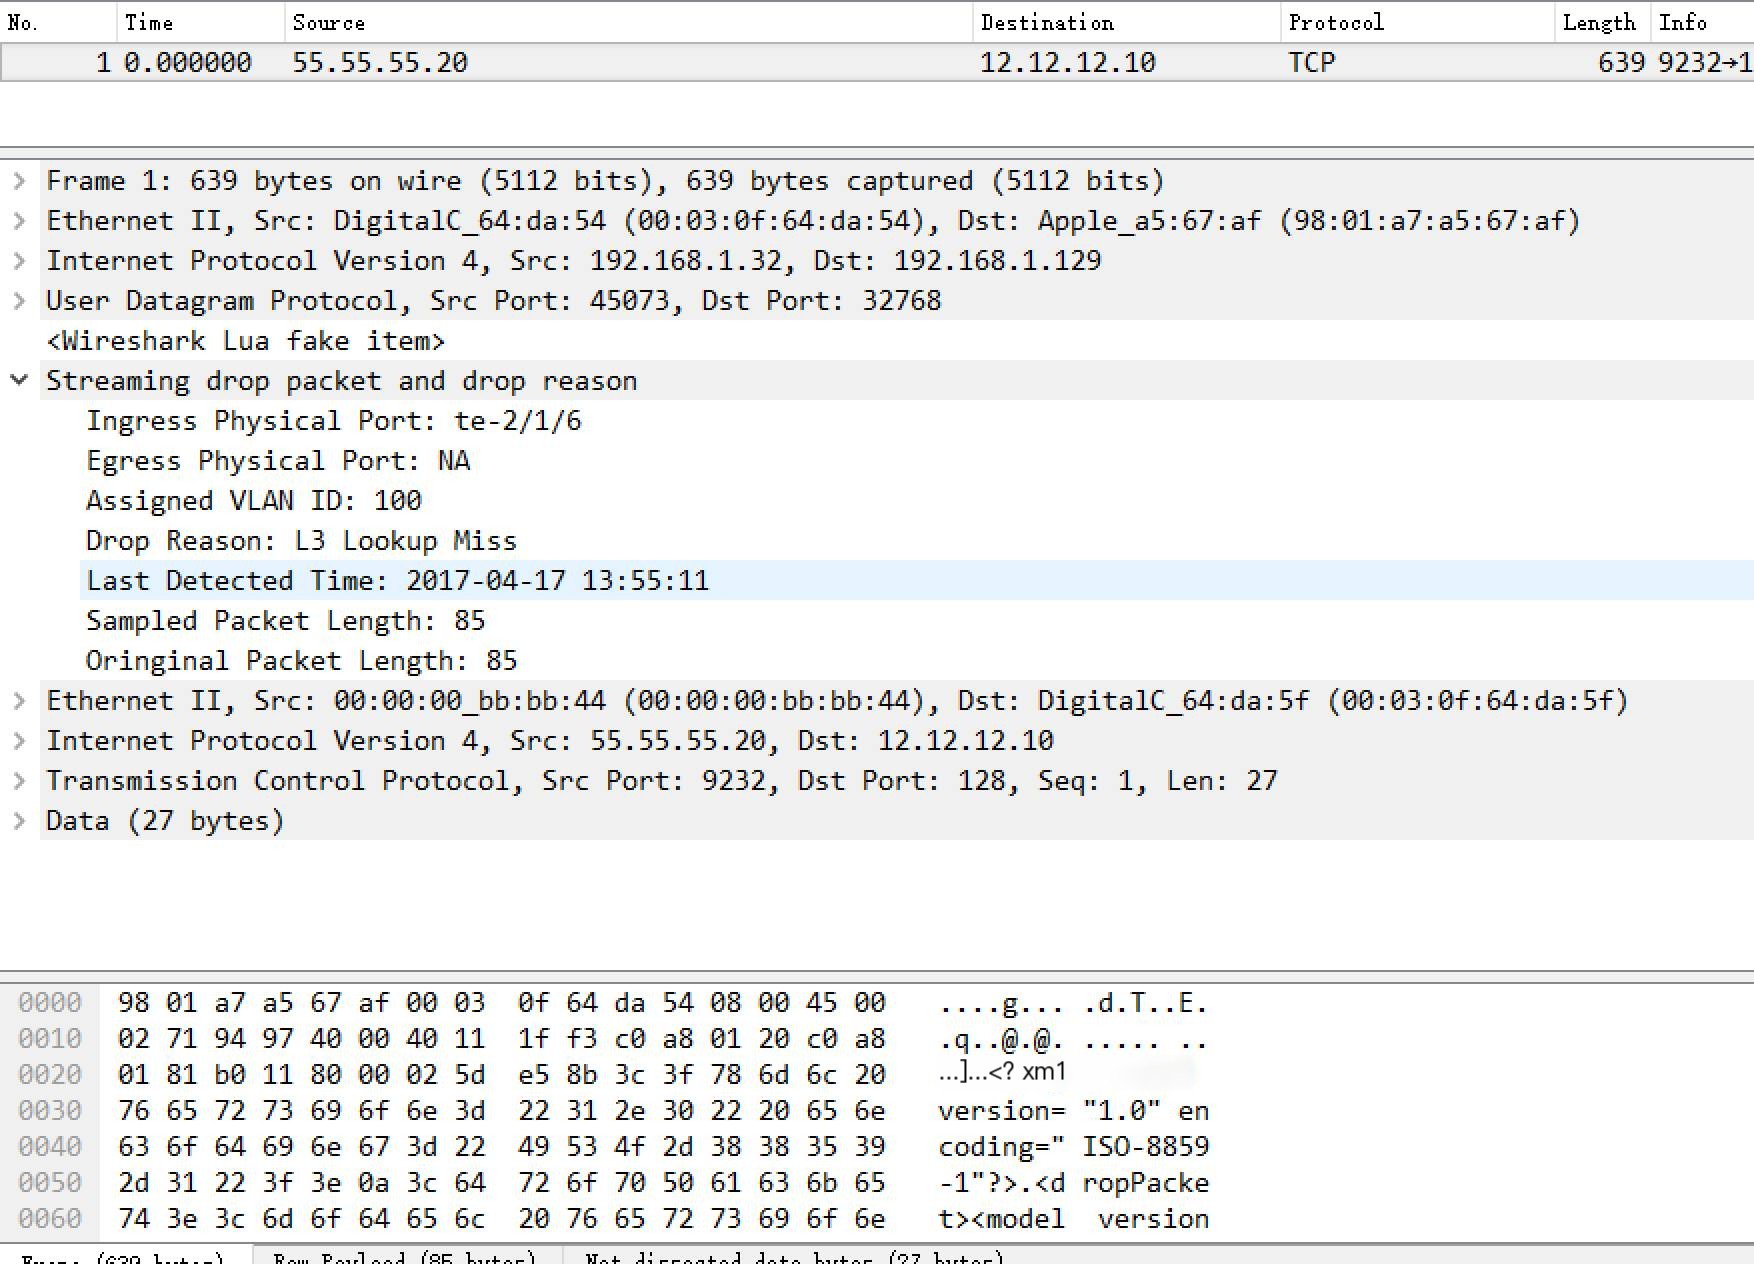
Similarly, exported information also needs to support parsing, displaying through Wireshark’s Lua plugin, as shown in the results below.
A big step
Aggregate all packet loss information across the network to a collector for statistical analysis, providing the following statistical display methods, and attempting to restore the size of the corresponding traffic.
- Statistics based on physical devices.
- Statistics based on source and destination IP.
- Statistics based on source and destination ports.
- Statistics based on packet loss reasons.
Through these statistical methods, existing risks and configuration issues in the network (like eliminating all possible warnings in coding), the entire network is within grasp.
With this network diagnostic analysis function, we can determine the cause of packet loss in just two simple steps:
- Use show sdrop to see the basic information of packet loss.
- If the first step still doesn’t provide enough information, the related information contained in show sdrop detail will accurately indicate the reason.
YunQi Technology’s ConnetOS has completed the first two phases, the third phase is in planning, and the Wireshark plugin is already open on https://github.com/connetos/sdrop-collector for more information.