Wireshark Packet Capture Log Analysis
During a high-concurrency test involving thousands of threads, the asr_ring cleaning service encountered an error: “Session idle too long,” indicating that no audio data was received by the service until it timed out. With no useful log clues available, Wireshark was used to analyze packet captures.
1. Capturing Data:
Since it was a high-concurrency test with thousands of threads, the cleaning service servers were deployed in a distributed manner. I captured packets between the cleaning service server and the gateway using the following command:
# tcpdump -i eno1 -s 0 host 10.0.1.71 and \(10.0.1.46 \) -w 1028.cap
Here, `eno1` is the name of the network interface, and `-s 0` is generally left unchanged.
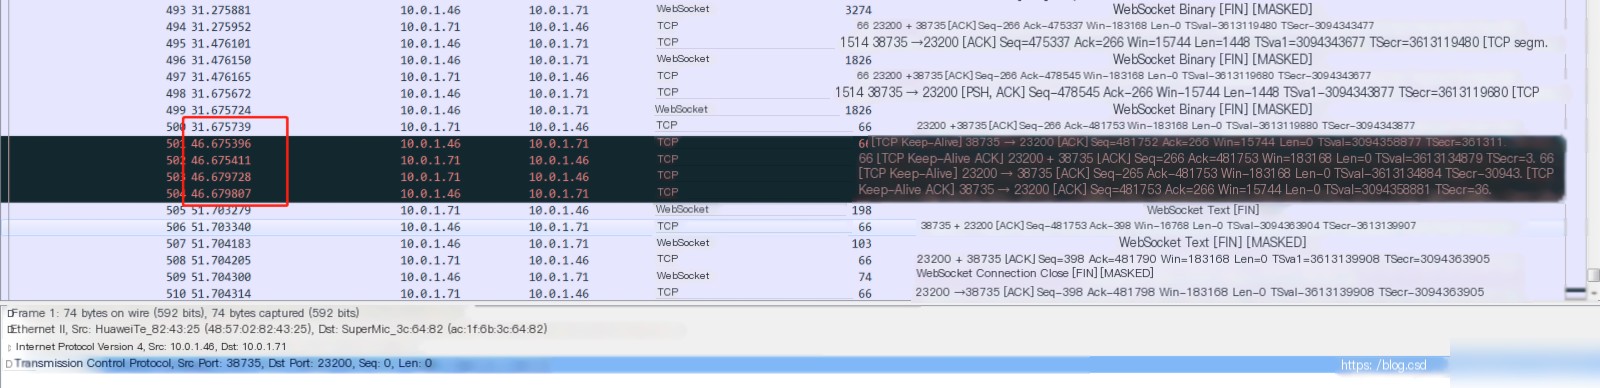
2. After capturing, I analyzed the generated files using Wireshark, as shown in the following illustration:
What I was looking for was the call associated with the error. Given the large volume of data, manually searching was impossible, so keyword-based searches were necessary. Wireshark’s search bar supports keyword auto-completion and has powerful filtering capabilities. You can match protocol names, ports, and text using the following commands. For partial text matches, the “contains” keyword is used. 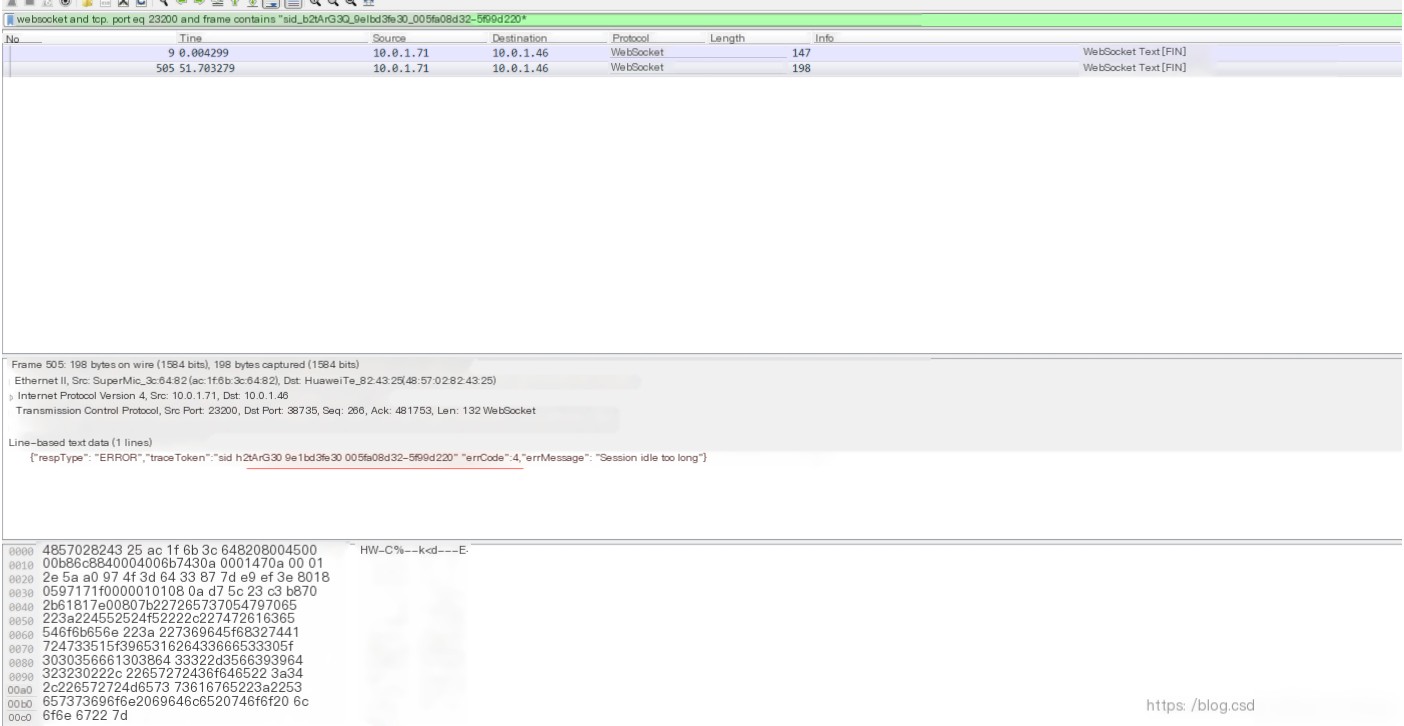
3. Once the Wireshark search is completed, you can also group the results for further analysis.
From the packet capture, it is clear that the asr_ring cleaning service remained in a connected state and only disconnected after 20 seconds. However, the expected behavior was to return results after playing a 31-second recording. This reveals two issues: why the cleaning service remained connected without releasing until timeout, and why the outbound call system took so long to end the call.