
Background
How did I come to discuss this topic? Well, it’s quite a long story. However, to cut a long story short, it is possible.
In my previous articles, I mentioned that our online services used the c3p0 database connection pool, which occasionally faced connection leak issues. Ultimately, I suspected that the database itself might be closing the connection, or perhaps a firewall between our server and the database was actively closing the connection. This situation led to a scenario where our sockets seemed healthy, but they were already invalid on the other side. When we sent messages across these sockets, the other side would not respond, and since we hadn’t set a timeout, this led to a prolonged block on the read method (waiting for a response).
In order to simulate such scenarios, I thought of some methods. One traditional approach I found was using the Oracle database’s sleep command. After execution, the database acts as if it’s dead, potentially simulating a read timeout. However, there is only one database in the development environment, used by many, so putting it to sleep isn’t ideal. Setting up my own seemed too tedious to me, and this method didn’t seem versatile enough. If another database times out, or if a service times out, would I need a different method each time?
I personally prefer generic solutions. For instance, a timeout simulation scenario should not only be applicable to databases but also simulate other remote services.
Initially, I thought of using NGINX as a layer 4 proxy (utilizing the stream module), where the client connects to NGINX which forwards traffic to the backend database. When the backend responds, I would introduce an n-second delay on NGINX before sending the response back to achieve a client timeout scenario. However, further research led me to a module supporting sleep for NGINX or OpenResty (https://github.com/openresty/stream-echo-nginx-module). Unfortunately, it clearly stated that it couldn’t be used with the proxy module together:
“The commands of this module cannot be mixed with other response-generating modules like the standard ngx_stream_proxy module in the same
server {}block, for obvious reasons.”
Additionally, it was stated that while it supports sleep, it does not block NGINX’s event loop thread.
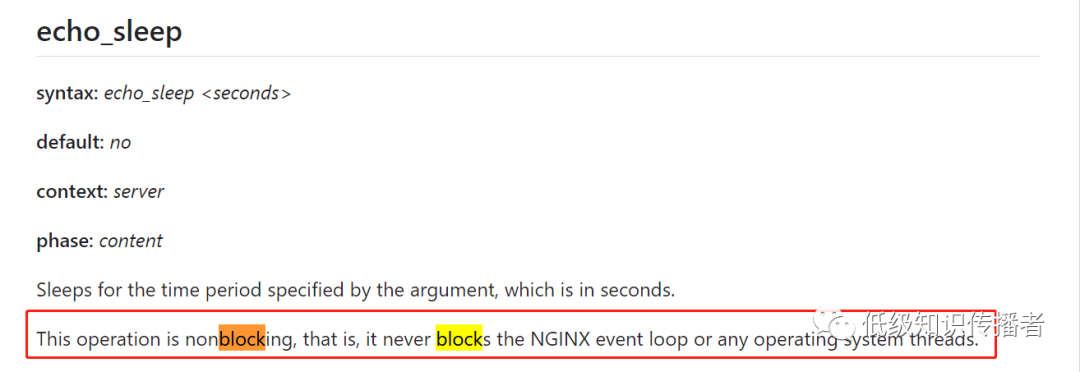
image-20230722164116965
Later on, I tried the stream-lua-nginx-module to sleep with Lua code, but it still didn’t work. My understanding is that since NGINX itself is a non-blocking model, trying to block it with sleep is impossible.
Thus, I gave up on this route.
Later, I had a flash of inspiration and thought that by using the firewall on the machine to drop the database’s return packets, I could simulate a read timeout scenario. In fact, this was the correct path, but due to the scarcity of online resources, it took quite a bit of trial and error to get it working.
Recently, I intended to give a detailed introduction to this firewall, but realized it’s quite difficult to do so systematically. I had to study it for quite some time. Every time I wanted to write about it, I found there was too much I didn’t understand, so I paused writing.
Today, my plan was to introduce the NAT functionality of iptables, but I ran into persistent issues during the experiment. I then thought about logging, which also ran into problems. After a long time of troubleshooting (due to limited online information on this topic), I decided to document it here.
Introduction to iptables
During the CentOS 6 era, the default firewall on machines was iptables; by CentOS 7, firewalld was largely adopted. Initially, I struggled with firewalld, and after repeated failures, I switched to iptables, which worked well. Hence, I’ve been troubleshooting with iptables lately, and I’ll introduce iptables first with hopes to study firewalld later.
Installation and Startup
Generally, it is advisable to stop firewalld first to avoid conflicts.
systemctl status firewalld
systemctl stop firewalld
Installing and starting iptables:
yum install -y iptables-services
// Start
systemctl start iptables
// Check status
systemctl status iptables
If it shows green "active (exited)", iptables has successfully started.
// Stop
systemctl stop iptables
Default Rules
Upon installation or startup, executing the following command will reveal some default rules.
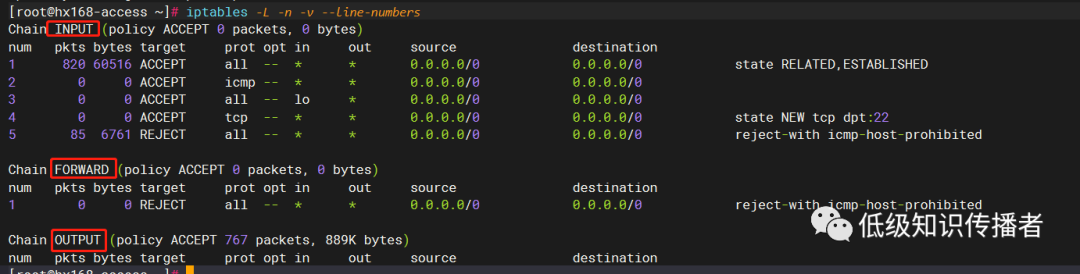
image-20230722172302338
In the context of a firewall, a rule specifies what action to take on packets meeting condition 1, condition 2, up to condition n. We may have many such rules forming one or multiple lists.
The default rules are stored in the /etc/sysconfig/iptables file:
vim /etc/sysconfig/iptables

*filter
:INPUT ACCEPT [0:0]
:FORWARD ACCEPT [0:0]
:OUTPUT ACCEPT [0:0]
// 1 For state ESTABLISHED, roughly meaning packets after the TCP three-way handshake, they are allowed. Of course, the firewall handles more than just TCP, so the concept varies slightly.
-A INPUT -m state --state RELATED,ESTABLISHED -j ACCEPT
// 2 Allow ping packets
-A INPUT -p icmp -j ACCEPT
// 3 Allow packets from the machine’s loopback interface
-A INPUT -i lo -j ACCEPT
// 4 Allow SSH connection request packets to the machine
-A INPUT -p tcp -m state --state NEW -m tcp --dport 22 -j ACCEPT
// 5 Reject all other packets
-A INPUT -j REJECT --reject-with icmp-host-prohibited
-A FORWARD -j REJECT --reject-with icmp-host-prohibited
COMMIT
Using Trace to Identify Rule Issues
Some details about iptables haven’t been covered yet, which might lead to some confusion. For now, you can take a brief look as this article focuses on ensuring debug logs are visible.
Typically, for developers, the scenario is relatively straightforward, like allowing or blocking access to a particular port, or only allowing certain IPs, etc. For instance, suppose we want to allow traffic on port 8080. How do we set it up?
We need to consider what a packet looks like when a client accesses port 8080. Shouldn’t it be the target port at the TCP layer that’s 8080? Therefore, all we need is to set a rule to filter such packets and allow them.
Let’s start an 8080 listener for testing:
python -m SimpleHTTPServer 8080
Next, we create a rule to allow port 8080:
iptables -i filter -I INPUT 1 -p tcp -m tcp --dport=8080 -j ACCEPT
Then, I tried telnet on the local machine, but couldn’t connect…
Why is that? Because I incorrectly executed the command. Suppose I didn’t realize my command was wrong; I might wonder why it didn’t match my rule. How would I know if iptables matched the right rule or whether it failed before reaching this rule?
Don’t worry; we can add the following command:
iptables -t raw -I PREROUTING -p tcp -m tcp --dport 8080 -j TRACE
Let’s break down this command:
-t raw: Specifies the table to operate, essentially one of the three tables among 'three tables, five chains.' You can ignore which specific table for now.
-I PREROUTING: -I specifies the insertion of a rule, followed by the chain to insert into (a chain is a collection of rules).
The above two options define a timing event before the firewall processes a network packet.
We’ve specified a rule:
-p tcp -m tcp --dport 8080 -j TRACE
That is, for packets with destination port 8080, -j TRACE implies tracing, which logs the final matched rule in the logs.
After adding the above command, retry telnet, and then open the /var/log/messages log:
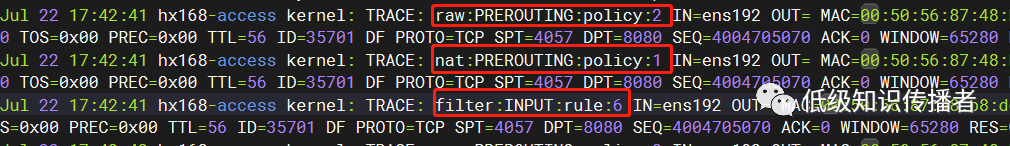
image-20230722175600395
You can see that for a particular client packet (essentially the first TCP handshake from the client, note that the second line’s ID is 35701, so these logs pertain to the same packet) three lines are logged:
raw:PREROUTING:policy:2
nat:PREROUTING:policy:1
filter:INPUT:rule:6
This indicates that it sequentially passed through three rules.
The first is raw:PREROUTING, i.e., the default rule of the PREROUTING chain in the raw table (policy:2). As seen in the picture, the raw table only has our trace rule, nothing else, which matched the default policy of the PREROUTING chain:
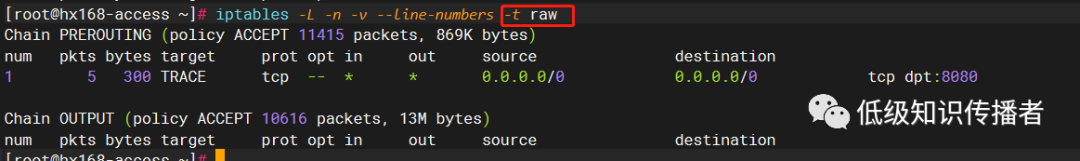
image-20230722180021766
According to online explanations, the area marked in red denotes the default policy:
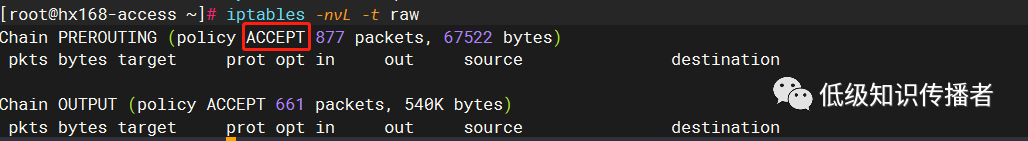
image-20230722181715290
Why do I refer to this as online explanations? Because I wanted to experiment by changing this to DROP to observe the effect:
 // DO NOT EXECUTE!!! This command set the default strategy to drop
 iptables -P PREROUTING DROP -t raw
As a result, the shell immediately disconnected. Since it was a work server, I thought only IT support could solve it. Thankfully, I recalled having a platform to restart the server. As iptables wasn’t set to start at boot, the rule wasn’t persistent, so I could reconnect to the shell and continue experimenting.
Back on track, after executing the first chain’s default ACCEPT policy, it moves to the table nat’s PREROUTING chain:
[root@hx168-access ~]# iptables -nvL -t nat
Chain PREROUTING (policy ACCEPT 0 packets, 0 bytes)
 pkts bytes target     prot opt in     out     source               destination

Chain INPUT (policy ACCEPT 0 packets, 0 bytes)
 pkts bytes target     prot opt in     out     source               destination

Chain OUTPUT (policy ACCEPT 0 packets, 0 bytes)
 pkts bytes target     prot opt in     out     source               destination

Chain POSTROUTING (policy ACCEPT 0 packets, 0 bytes)
 pkts bytes target     prot opt in     out     source               destination
This too is empty, without a rule, eventually executing the default PREROUTING:policy:1 policy: ACCEPT, moving onto the following:
filter:INPUT:rule:6.
Which is the sixth rule in the filter table’s INPUT chain:
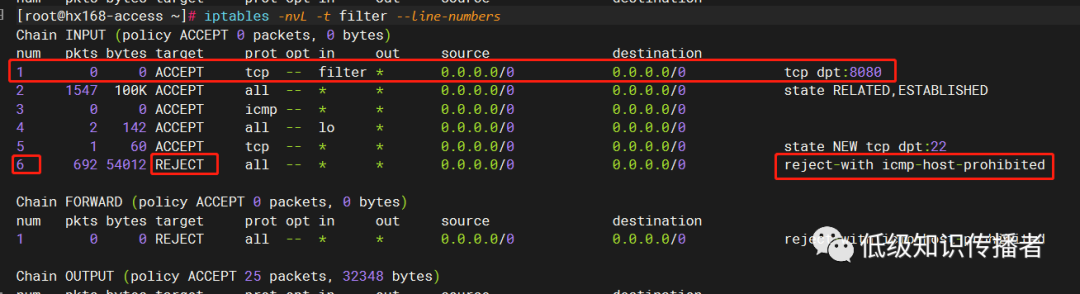
image-20230722182526725
Rule six is a straightforward rejection. Why was rule six executed? This is due to sequential execution from 1-6, indicating a mismatch with the conditions of the first five rules, likely due to an incorrect condition.
Upon serious examination, it turned out I manually erred, and the correct command should be:
// Correct version
iptables -I INPUT  -p tcp --dport 8080 -j ACCEPT
// Incorrect version
iptables  -i filter -I INPUT 1 -p tcp -m tcp --dport=8080 -j ACCEPT
The mistake was -i filter, intended to specify the table explicitly (though the correct version omits it, defaulting to filter), but miswritten, should be -t filter. Upon executing correctly, it worked:
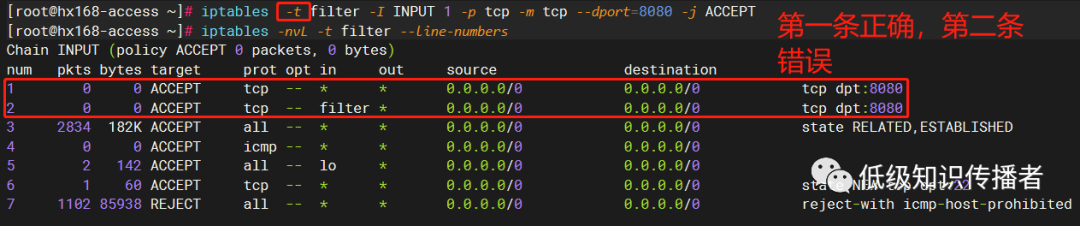
image-20230722183047050
Despite the erroneous rule still existing, the correct rule precedes it at num=1, ensuring it’s executed first and matches, preventing further execution.
Review the trace log again, now matching rule 1:
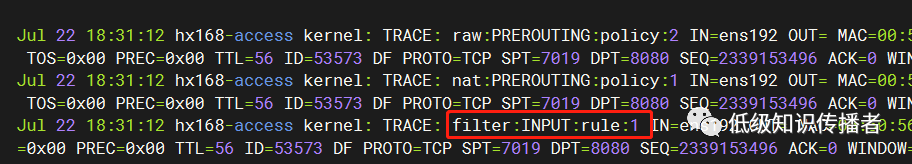
image-20230722183252336
Properly Setting Trace Rules for Correct Output
The rsyslog Process
Today’s considerable time was dedicated to trace rule troubleshooting. Despite finding rules online and applying them, I couldn’t see any content in log files. After extensive alterations, it remained unresolved.
This /var/log/messages file is typically written by which service? It’s rsyslogd, a background process.
In a nutshell, it is a system tool supporting message logging, where messages are transmitted via network or local Unix socket.
“Rsyslogd is a system utility providing support for message logging. Support of both internet and unix domain sockets enables this utility to support both local and remote logging.”
Typically through local Unix socket.
From man rsyslogd, several essential files are involved with this process:
Main configuration file:
/etc/rsyslog.conf
Configuration file for rsyslogd. See rsyslog.conf(5) for exact information.

Location of Unix sockets where local syslog messages are read:
/dev/log
The Unix domain socket from where local syslog messages are acquired.

Process ID:
/var/run/syslogd.pid
The file containing the process ID of rsyslogd.
The process ID matches: 4773:
[root@hx168-access ~]# cat /var/run/syslogd.pid
4773
[root@hx168-access ~]# ps -ef|grep rsys
root       4773      1  0 18:44 ?        00:00:00 /usr/sbin/rsyslogd -n
This process primarily writes to the following files (given default configuration):
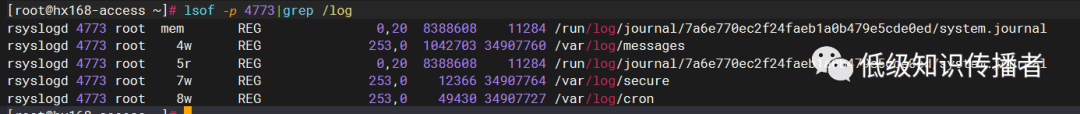
image-20230722192650305
For example, our firewall trace logs go to /var/log/messages.
Obstruction in Log Output
Today’s issue involved online suggestions to modify the configuration to output kernel logs:
vim /etc/rsyslog.conf
Add the following line:
kern.*     /var/log/iptables.log (name can be custom)
However, even after this, it did not work.
Swapping to another machine worked without needing the above configuration; thus, speculation began on the true cause.
Using strace to Diagnose Log Daemon Receipt
# xxx represents rsyslogd's pid
strace -p xxx -q -f -s 200
The strace command attaches to a process, monitoring its system calls.
I ran it on both a functional and non-functional machine, then executed ping. On the functional machine, the following system calls were observable, unlike the faulty machine:
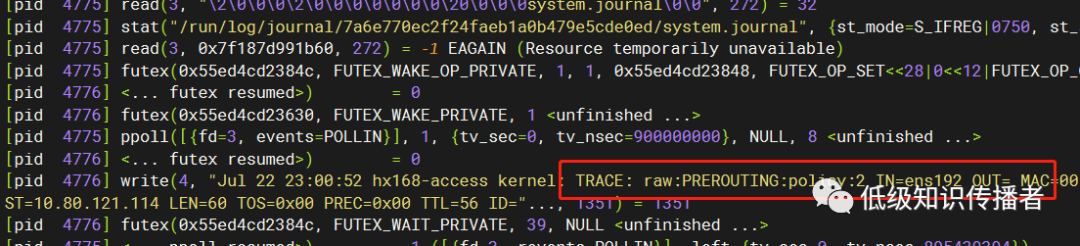
image-20230722230348064
This led to speculation of possible firewall issues, as it might not be writing logs to rsyslogd.
Comparing Loaded mods on Both Machines
In man iptables-extensions, it elucidates information about the TRACE target operation.
“TRACE This target marks packets so that the kernel will log every rule matching packets as they traverse tables, chains, and rules.
A logging backend, such as nf_log_ipv4(6) or nfnetlink_log, must be loaded for visibility. Packets are logged with the prefix: “TRACE: tablename:chainname:type: rulenum” wherein type can be “rule” for plain rules, “return” for implicit rules at the end of a user-defined chain, or “policy” for built-in chain policies. It can only be used in the raw table.”
This mentions that either the nf_log_ipv4 or nfnetlink_log module must be loaded on the machine, with no further details.
I searched online for articles on TRACE rule configurations and executed some commands based on them. For example, these were my modprobe commands found in shell history:
  678  modprobe ipt_LOG
  688  modprobe ipt_LOG ip6t_LOG nfnetlink_log
  741  modprobe nfnetlink_log
  748  modprobe nf_log_ipv4
The related module commands are as follows:
Loading or removing modules
modprobe - Add and remove modules from the Linux Kernel

Listing loaded modules
lsmod - Show the status of modules in the Linux Kernel
lsmod is a trivial program which nicely formats the contents of the /proc/modules, showing what kernel modules are currently loaded.

Viewing module information
modinfo - Show information about a Linux Kernel module
I executed lsmod | sort on both machines, observing differences:
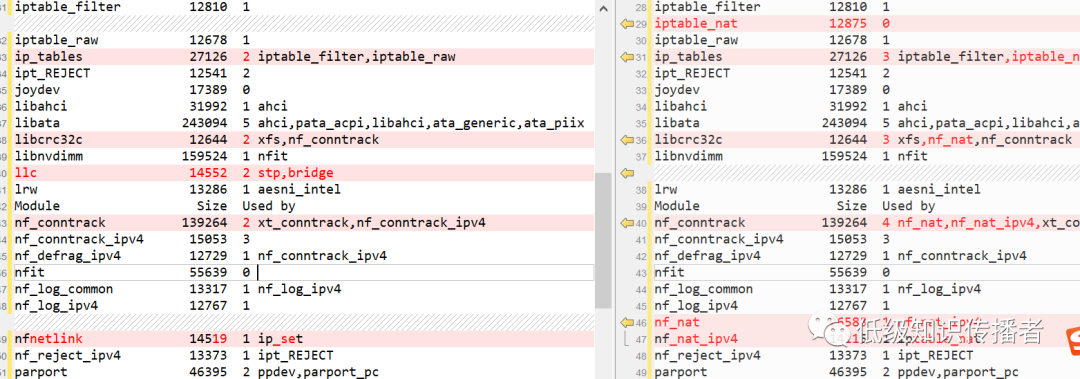
image-20230722231603033
Researching online, I saw articles suggesting relevance to kernel parameters (sysctl -a), prompting additional comparisons. One parameter seemed impactful:
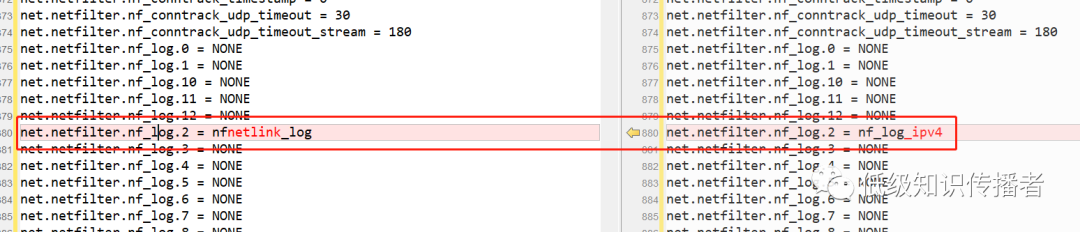
image-20230722231715861
This parameter was difficult to fully decode due to limited information.
Further research led to an understanding that the following parameter value redirects logs away from rsyslogd to a background program called ulogd:
net.netfilter.nf_log.2 = nfnetlink_log
Briefly about ulogd: https://www.netfilter.org/projects/ulogd/:
“ulogd is a userspace logging daemon for netfilter/iptables related logging.”
It’s a user-space log daemon intended for netfilter/iptables-related logging. Regardless, it does not log to rsyslog.
The change might stem from executing modprobe nfnetlink_log. However, the correct module should be nf_log_ipv4.
Thus, I adjusted the value:
echo nf_log_ipv4 > /proc/sys/net/netfilter/nf_log/2
Upon checking again:
sysctl -a
The value was already nf_log_ipv4
Additionally, there are 12 files in the following directory:
[root@hx168-access ~]# ll /proc/sys/net/netfilter/nf_log
-rw-r--r-- 1 root root 0 Jul 22 23:25 2
...
-rw-r--r-- 1 root root 0 Jul 22 23:25 12
Only the file named “2” concerns IP protocols, which determines the logging module used with the IP protocol family, while the other protocol families are less pertinent.
Online Discussion on this Issue
A feature appears to be focusing on unifying some values for net.netfilter.nf_log.2:
https://patchwork.kernel.org/project/netdevbpf/patch/[email protected]
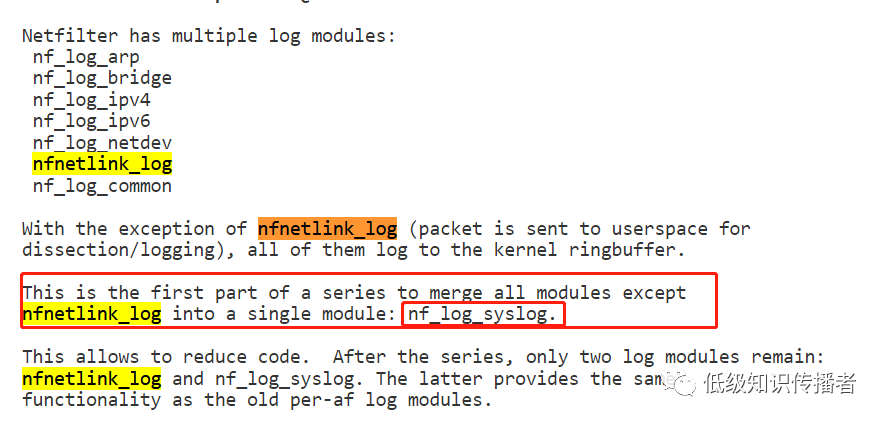
image-20230722233203106
Moving forward, there will only be two modules: nfnetlink_log and nf_log_syslog (which logs to rsyslog).
A bug report mirrors my issue, with a similar resolution by critiquing TRACE’s documentation:
https://bugzilla.netfilter.org/show_bug.cgi?id=1076
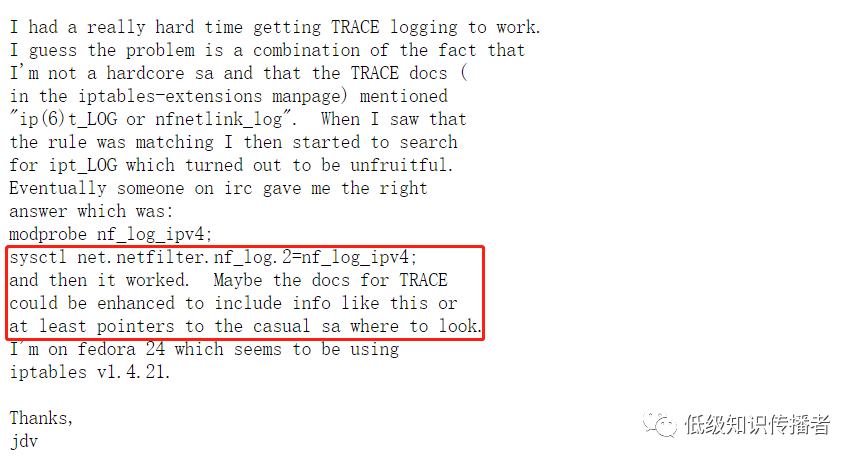
image-20230722233439568
This issue was raised years ago and remains unresolved, with an open bug.
That’s it for now, I’ll continue discussing other aspects of iptables in the next post.