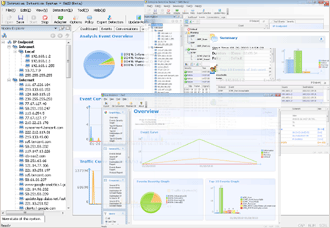
As a network analyzer, it is very easy for us to monitor network traffic with its great network monitoring capacity. By doing it, we can quickly identify network bottleneck and detect network abnormities. This article is to show you how to monitor network traffic with Unicorn’s network analyzer.
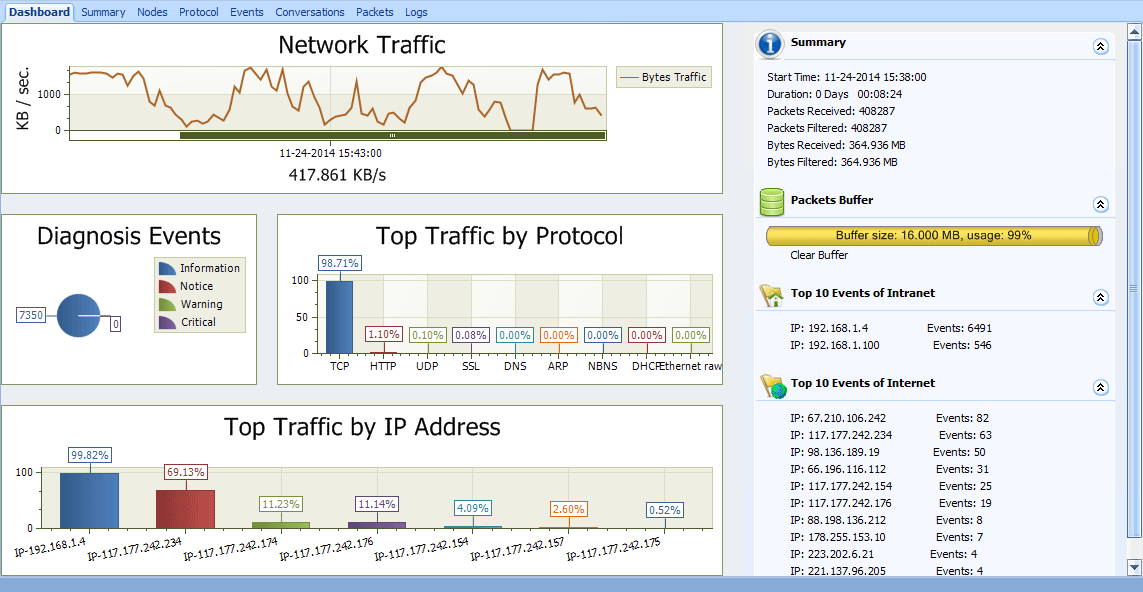
Monitor Network traffic via the Dashboard tab
If we want to have a graphical view of the statistics or get a trend chart of the network traffic, The Dashboard tab just for you. It provides a several statistic graphs from global network to a specific node. With these graphs, you can easily find out anomalies of the network and get useful statistics.
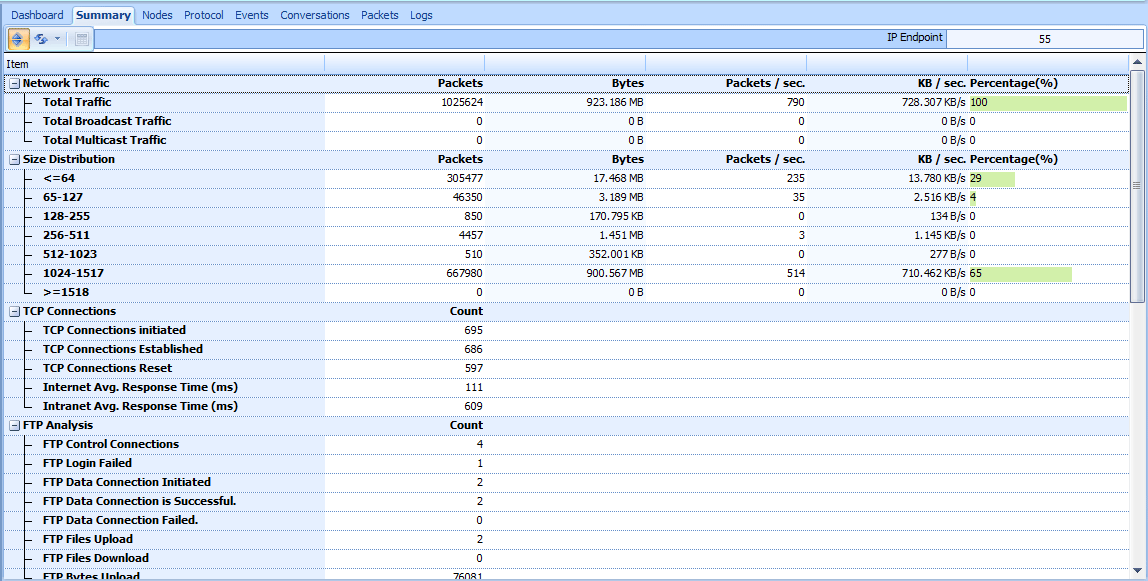
Monitor Network traffic via the Summary tab
The Summary tab provides key statistics information of the entire network or the node selected in the Node Explorer window. We can rapidly view the total traffic, broadcast traffic, multicast traffic and so on via Summary tab. When we select a node in the Node Explorer window, corresponding traffic information will be provided.
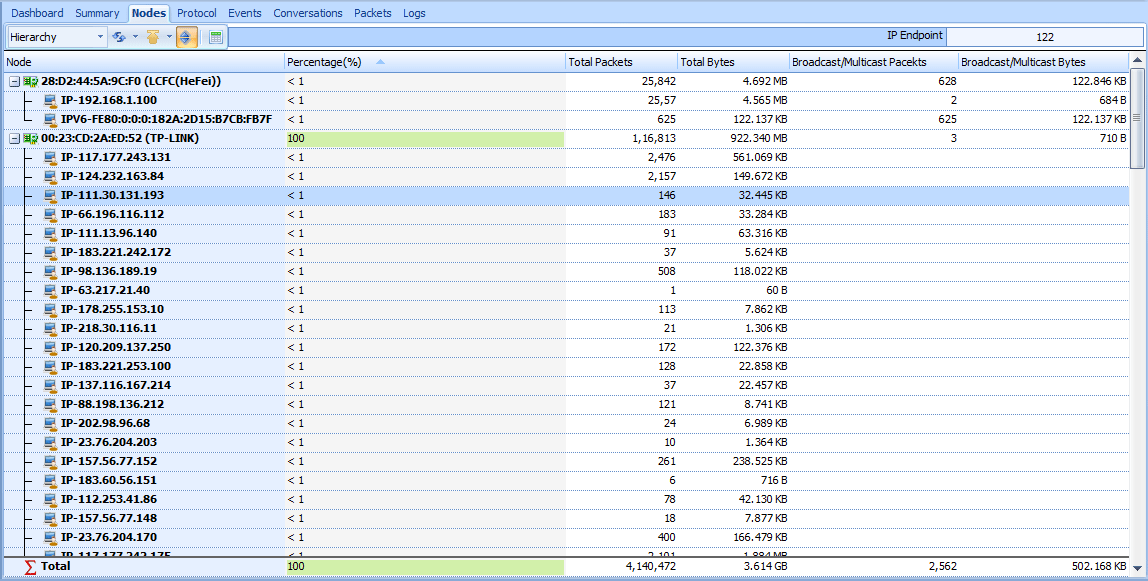
Monitor Network traffic via the Nodes tab
In these three endpoint view, including Physical Endpoint, IPv4 Endpoint and IPv6 Endpoint, we can monitor network traffic of each physical address node and IP address node, both local and remote. We can easily find out the nodes with abnormal traffic via sorting feature of Unicorn, such as which hosts are generating or have generated the largest traffic.
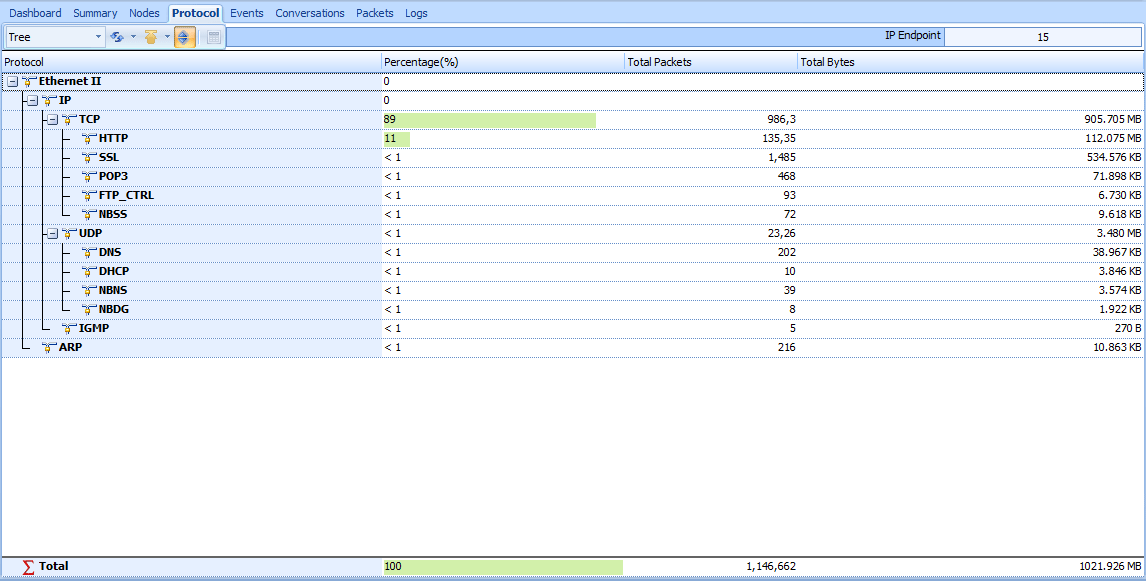
Monitor Network traffic via the Protocol tab
All protocols applied in your network transmission are listed in the protocol tab. We can monitor network traffic of each protocol via protocol tab. To analyze the protocols in the network traffic, we can easily understand what applications are consuming the network bandwidth, for example, the HTTP stands for website browsing, and the POP3 stands for email, etc.
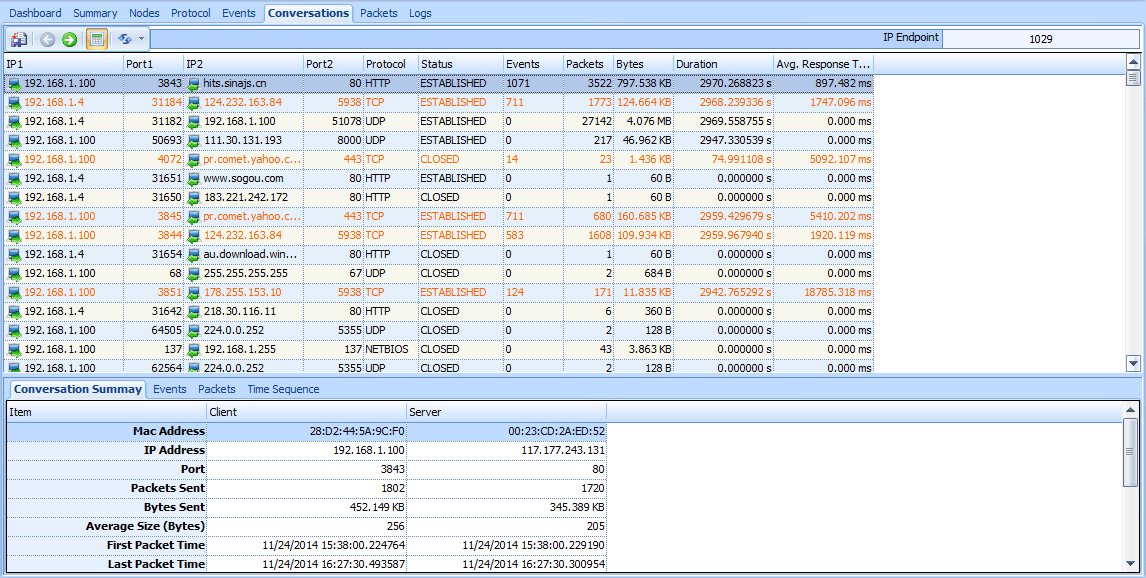
Monitor Network traffic via the Conversation tab
We can monitor network traffic of each conversation type and the figure out which conversation has generated the largest network traffic via conversation tabe.


