

When resolving network issues, intermittent problems are the most challenging to address. Trying to capture the issue only when it occurs can take weeks. There are four key steps to resolving intermittent issues. First, you must have access to the path of the packets. Second, you need the capability to capture for extended periods to ensure you don’t miss the issue. Finally, you need a method to determine when the issue occurs so you can drill down and find the problematic packets. Continue reading to learn how to reliably find the root causes of these issues using IOTA 1G.
1. Accessing and Capturing Packets
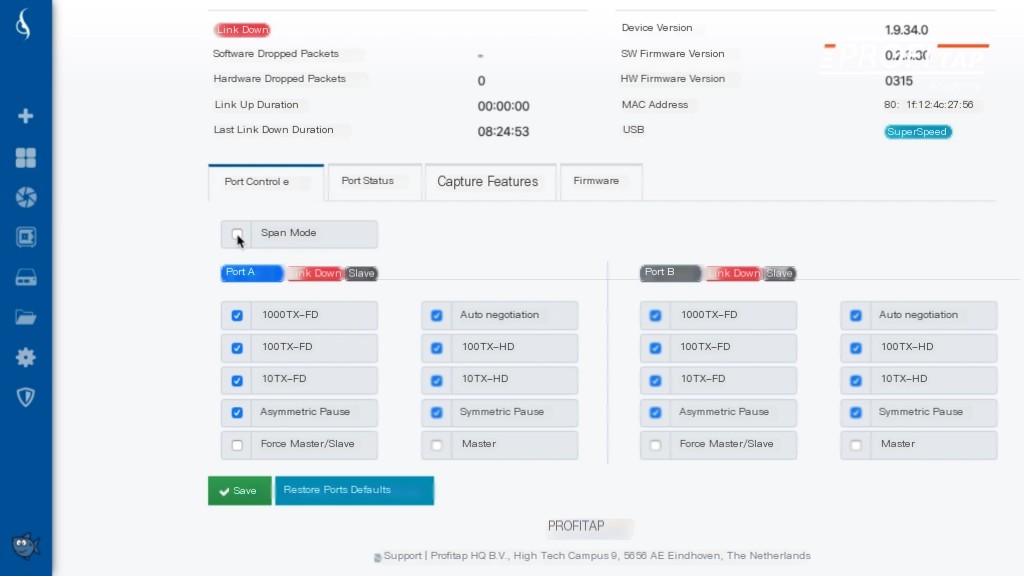
The first step to setting up IOTA to capture packets is to configure the capture ports in inline mode. Log in to IOTA and disable SPAN mode, switching it to inline mode.
 />
/>
Place the IOTA 1G inline between the client PC and other networks. IOTA 1G supports full line rate and full duplex gigabit traffic. It not only captures traffic, but the TAP is fault-tolerant. Therefore, if IOTA loses power for any reason, it will continue passing packets between the computer and other parts of the network.
After positioning IOTA in-line, press the button to start capturing all packets. With IOTA, all data can be retained for the long term. This is crucial for successfully solving intermittent problems because it is difficult to detect when an issue will occur, and a small capture buffer reduces the time window. IOTA also has a built-in 1TB SSD hard drive. For most computers, this means data can be captured for days or weeks without losing any information. As packets are captured, IOTA writes them to files and stores metadata for each flow in a searchable database.
2. Quickly Identify Issues
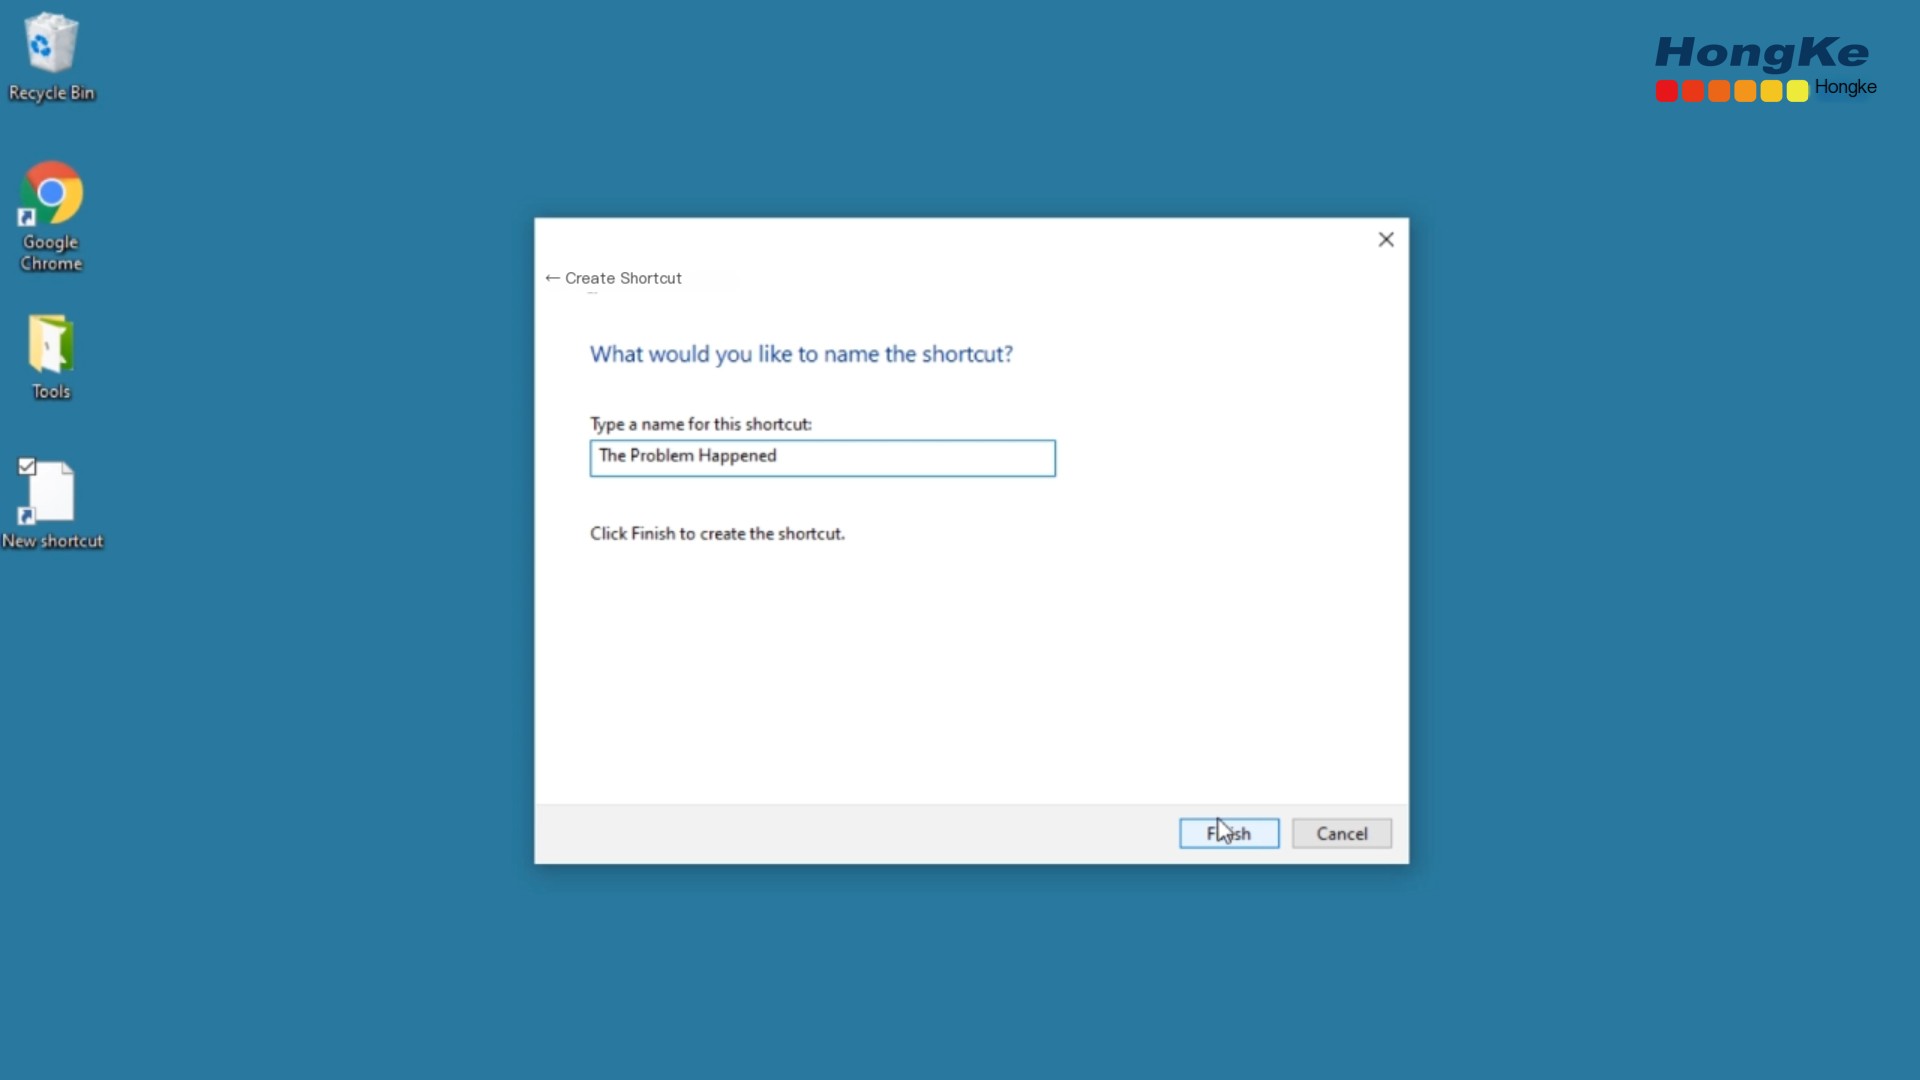
Historically, individuals encountering this problem needed to note the date and time the issue occurred. This approach is highly unreliable. A better method to denote when the problem occurs is to place a shortcut on the desktop that sends a ping packet each time the troubled individual clicks it, allowing later searches of the captured packets to reveal when the issue happened.
 />
/>
3. Dive into Packet Markers
Let’s look at how to locate markers and extract packets for analysis in Wireshark. There will be plenty of data after reviewing a 24-hour period. By setting a filter on the IP address of the marked frame, you’ll be able to locate the marked packets and precisely see when the client clicked the shortcut. Zoom in with the mouse on the 10 minutes before and after the mark to see what happened around the problem’s time.
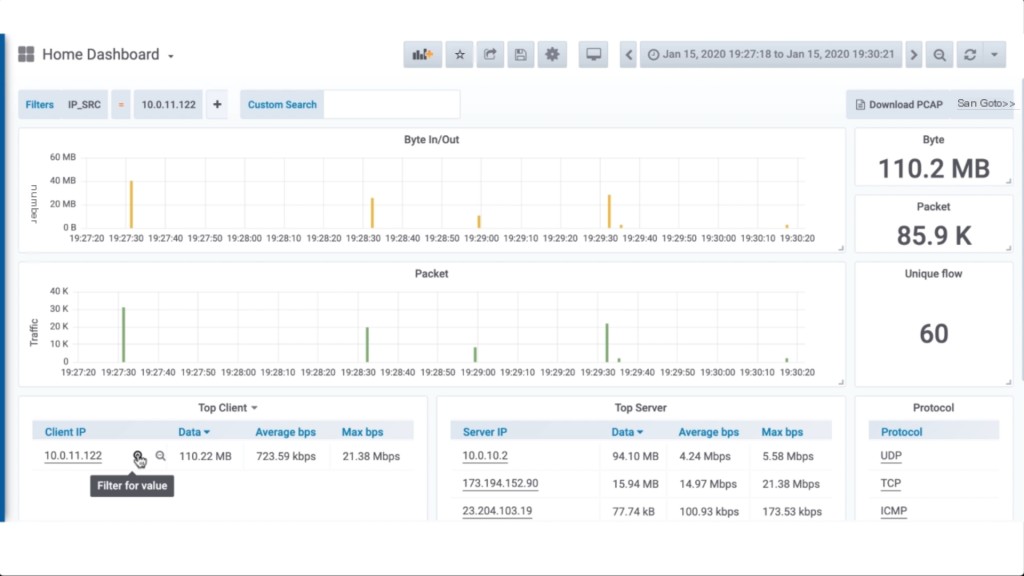
Then, remove the marker filter and set a filter on the problematic device’s IP address. It’s as simple as clicking the magnifying glass next to the IP address. Done correctly, you’ll be left with only 110MB of traffic across the network during that period. Click download pcap to extract packets incoming and outgoing to the problem computer during that time onto your system.
4. Analyze Captured Packets in Wireshark
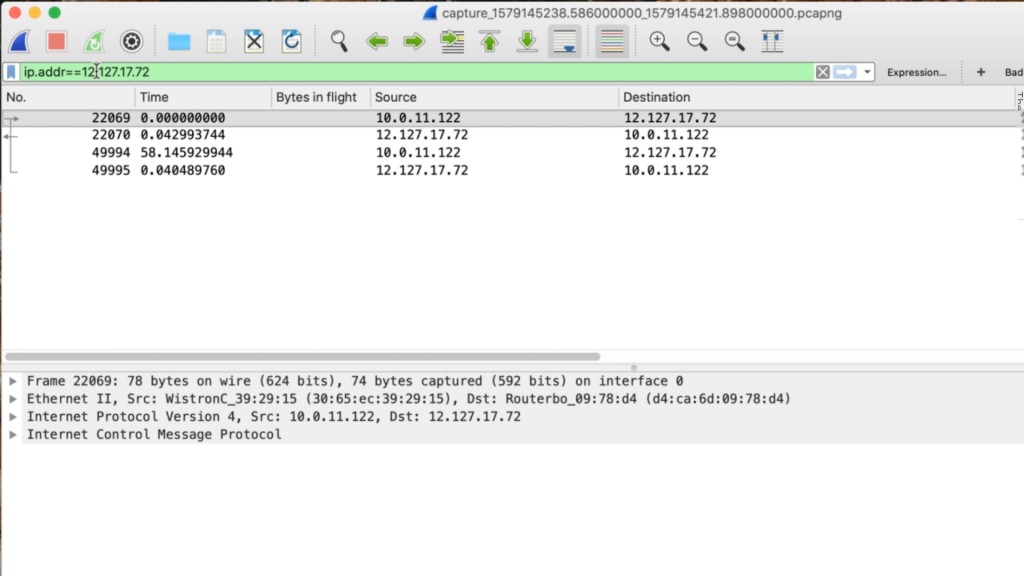
Next, open the trace file in Wireshark. By applying an IP address filter to the trace file, you’ll find the marked packets. In this example, the first marker occurs at frame 22069. This is where you should start reviewing the trace file. Click that frame and remove the filter to view all traffic captured between the client computer by IOTA and other parts of the network. Simply tracking the information before the marker can uncover the problem.
IOTA helps identify the root causes of intermittent issues by entering the packet path at full line rate, providing an easy means to filter out problematic packets, and effortlessly extracting these packets for network traffic analysis.