

Introduction to Open Source Software
I spent over a week reading the first section of the book *”Wireshark Network Analysis: The Official Guide.”* The first nine chapters primarily cover the usage methods and techniques of Wireshark, an Open Source Software, along with command-line tools such as capinfos, dumpcap, editcap, and tshark. To supplement my understanding, I also referred to several online articles and created this summary for easier future reference.
Wireshark: Open Source Software Graphical Tool
In the past, network packet analysis tools were either extremely expensive or proprietary commercial software. The emergence of Wireshark changed everything. Under the GNU General Public License (GPL), users are allowed to access the software and its source code for free, as well as modify and customize it as needed. Wireshark is one of the most widely used network packet analysis tools worldwide today.
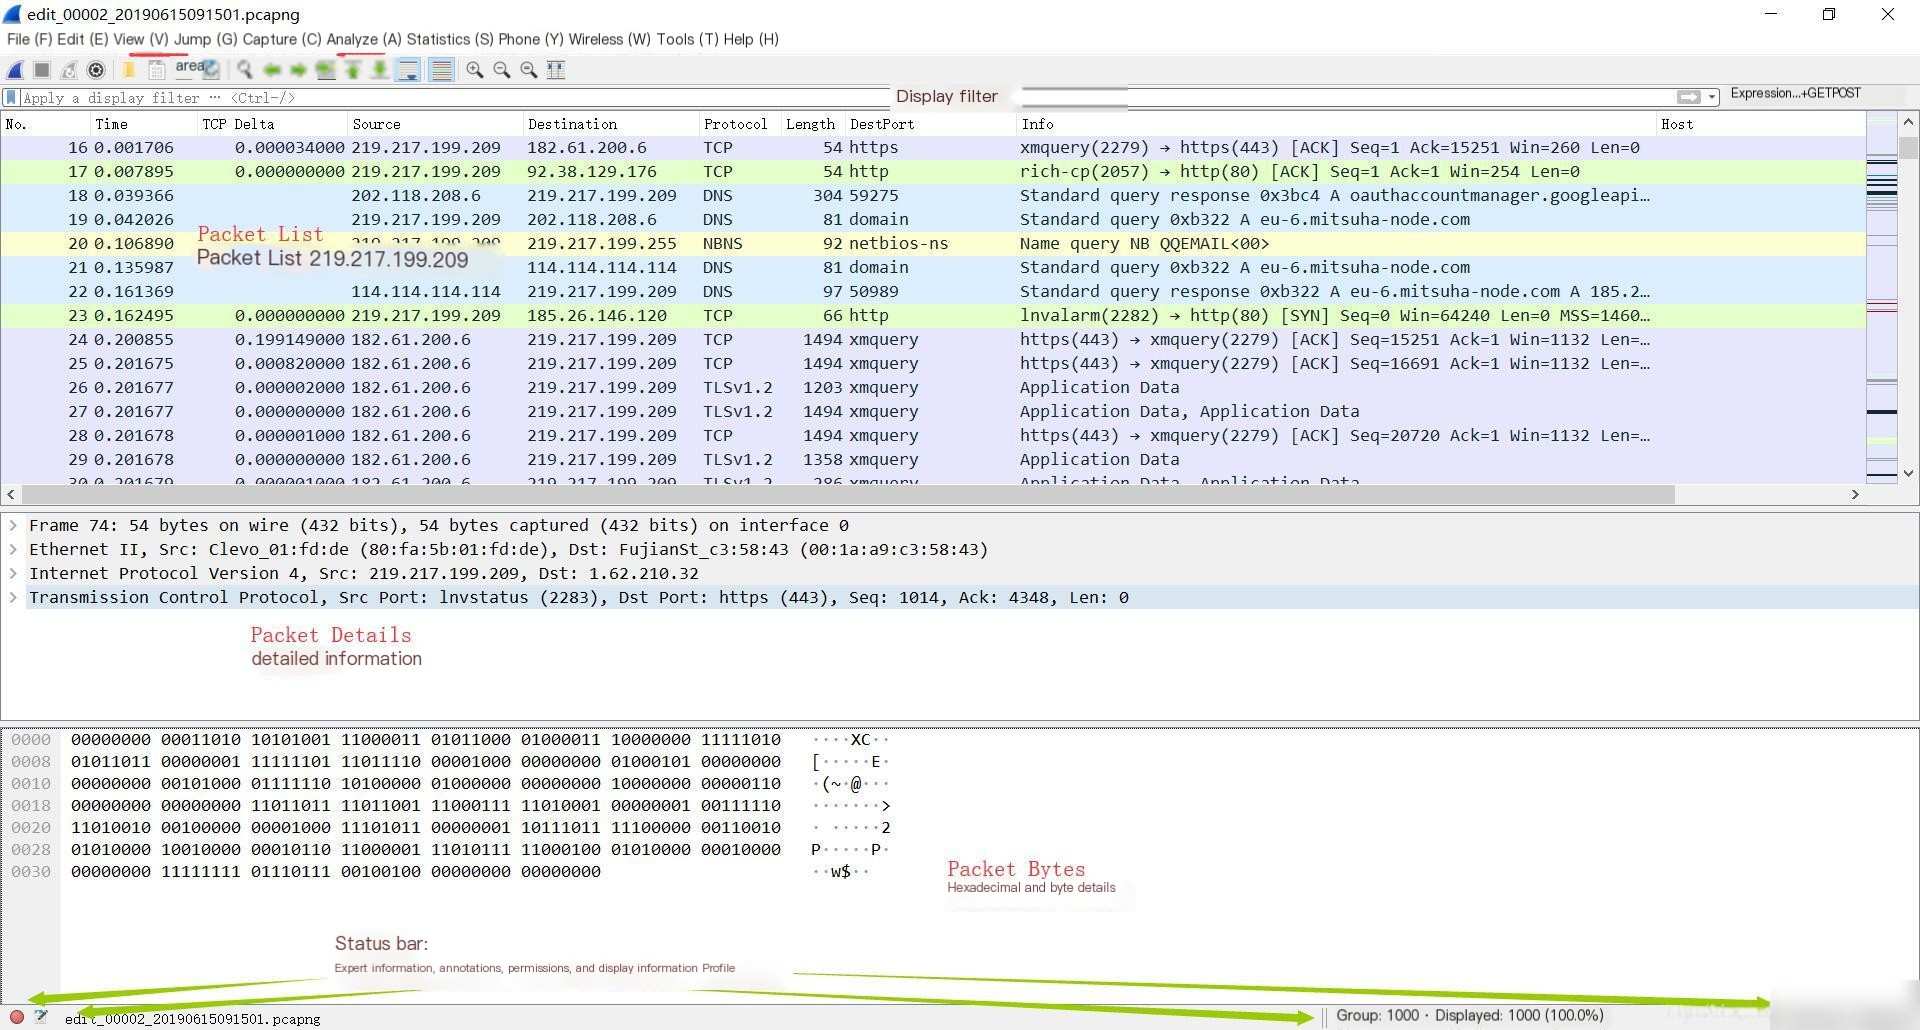
Open Source Software: Wireshark Views
Customizing Profiles in Open Source Software
Profiles can be customized. Right-click on the profile to manage it.
Basic usage will not be elaborated here.
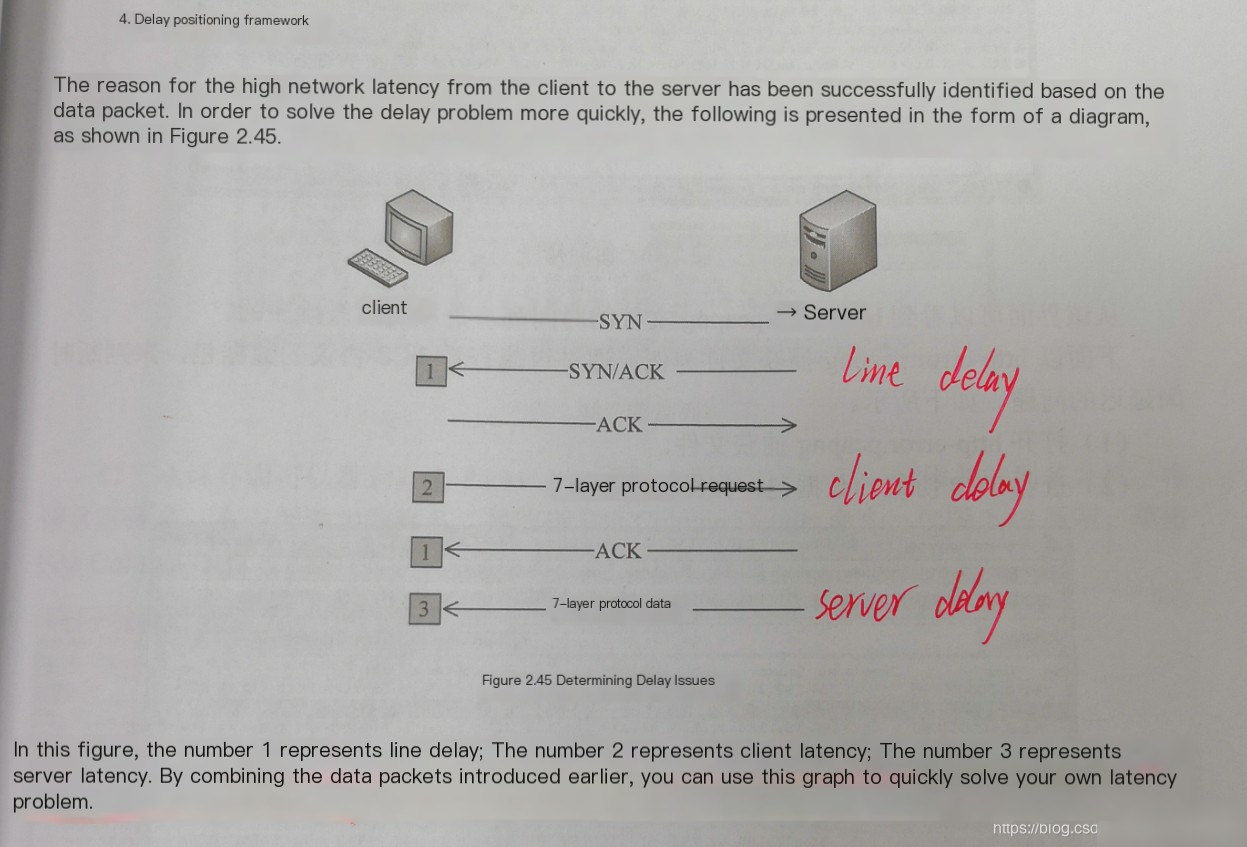
“Latency Detection with Open Source Software”
 Add a new column by using the “Time since previous…” field in TCP Timestamps as a new column.
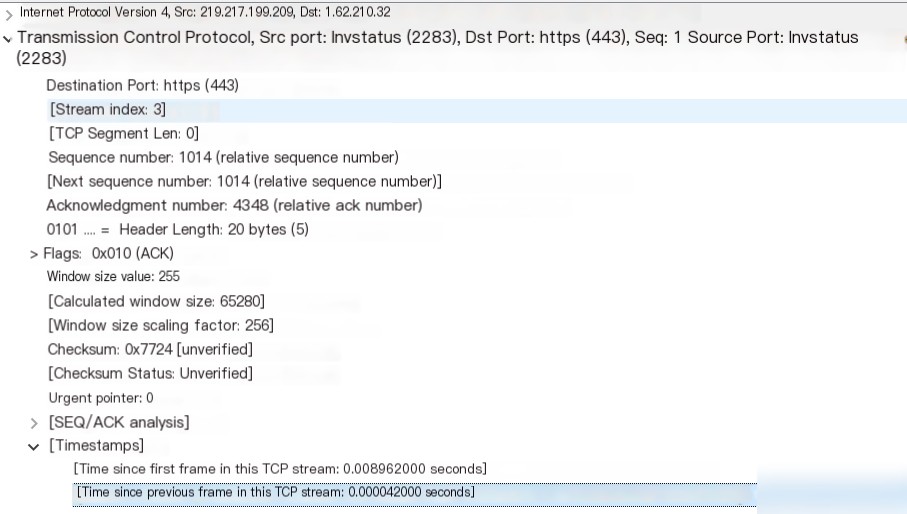
Capture Filters
- Capture filter syntax:
Syntax: <Host(s)>
Protocol: Options include ether, fddi, ip, arp, rarp, decnet, lat, sca, moprc, mopdl, tcp, udp, etc. If no protocol is specified, all supported protocols will be captured by default.
Direction: Options include src, dst, src and dst, src or dst, etc. If no direction is specified, “src or dst” is used as the default keyword.
Host(s): Options include net, port, host, portrange, etc. By default, “host” is used as the keyword. For example, “src 10.1.1.1” and “src host 10.1.1.1” are equivalent.
Logical Operations: Options include not, and, or, etc. NOT (“not”) has the highest precedence. OR (“or”) and AND (“and”) have the same precedence and are evaluated from left to right.
Commonly Used Capture Filters
- Capture only (or exclude) HTTP traffic for a specific host
host 192.168.5.231 and port 80 and http # Captures only HTTP traffic from host 192.168.5.231. If your HTTP port is 8080, replace 80 with 8080.
port 80 and http # Captures all HTTP traffic passing through the interface. If your HTTP port is 8080, replace 80 with 8080.
host 192.168.5.231 and not port 80 # Captures all traffic from host 192.168.5.231 except HTTP. If your HTTP port is 8080, replace 80 with 8080.
not port 80 # Captures all traffic except HTTP. If your HTTP port is 8080, replace 80 with 8080.
not port 80 and !http # Captures all traffic except HTTP. If your HTTP port is 8080, replace 80 with 8080.
- Capture all traffic for a specific host
host 192.168.5.231 # Captures all traffic to and from host 192.168.5.231.
dst 192.168.5.231 # Captures all traffic destined for host 192.168.5.231.
src 192.168.5.231 # Captures all traffic originating from host 192.168.5.231.
net 192.168.5.0/24 # Captures all traffic for hosts in subnet 192.168.5.0/24.
- Capture only DNS traffic for a specific host
host 192.168.5.231 and port 53 # Captures only DNS traffic for host 192.168.5.231.
src 192.168.5.231 and port 53 # Captures only outgoing DNS traffic from host 192.168.5.231.
dst 192.168.5.231 and port 53 # Captures only DNS responses to host 192.168.5.231.
port 53 # Captures all DNS traffic on the interface.
- Capture (or exclude) ARP traffic
host 192.168.5.231 and arp # Captures only ARP traffic for host 192.168.5.231.
host 192.168.5.231 and !arp # Captures all traffic except ARP for host 192.168.5.231.
arp # Captures all ARP requests on the interface.
!arp # Captures all non-ARP requests on the interface.
- Capture traffic for specific ports
tcp portrange 8000-9000 and port 80 # Captures traffic on ports 8000-9000 and port 80.
port 5060 # Captures SIP traffic, as its default port is 5060. For example: port 22 # Captures SSH traffic.
- Capture email traffic
host 192.168.5.231 and port 25 # Captures POP3 traffic for host 192.168.5.231.
port 25 and portrange 110-143 # Captures traffic on email-related protocols: SMTP, POP3, and IMAP4.
- Capture VLAN traffic
vlan # Captures all VLAN-related traffic.
vlan and (host 192.168.5.0 and port 80) # Captures traffic for host 192.168.5.0 within VLANs. Note: In Wi-Fi settings, VLAN traffic might not always be captured. Local area networks, such as those in offices or schools, are more likely to have VLANs.
- For more examples, refer to: Port essentials: https://svn.nmap.org/nmap/nmap-services# Common protocols and ports: http://tool.chinaz.com/port/#
Display Filters
Capture filters use BPF syntax, while display filters use Wireshark-specific syntax. Display filters are case-sensitive, with most being written in lowercase.
Syntax:
Protocol String1 String2 Comparison Operator Value Logical Operations Other Expressions
Protocol: Specifies the protocol to filter. Protocols can range from Layer 2 to Layer 7 of the OSI model. String1, String2 (optional): Subcomponents of the protocol. Comparison Operator: Defines comparison logic.
| English Syntax | C-Like Syntax | Meaning |
|---|---|---|
| eq | == | Equal to |
| ne | != | Not equal to |
| gt | > | Greater than |
| lt | < | Less than |
| ge | >= | Greater than or equal to |
| le | <= | Less than or equal to |
Logical Expression: Specifies logical operators.
| English Syntax | C-Like Syntax | Meaning |
|---|---|---|
| and | && | Logical AND |
| or | || | Logical OR |
| xor | ^^ | Logical XOR |
| not | ! | Logical NOT |
- Protocol Filters
arp# Shows all ARP traffic.ip# Shows all IPv4 traffic.ipv6# Shows all IPv6 traffic.tcp# Displays all TCP-based traffic data. - Application Filters
bootp# Displays all DHCP traffic.dns# Displays all DNS traffic, including both TCP and UDP requests/responses.tftp# Displays all TFTP traffic.http# Displays all HTTP commands, responses, and data transmissions. Note that it omits handshake packets, TCP acknowledgments, and disconnection packets.icmp# Displays all ICMP traffic (e.g., packets sent via the ping command). - Field Existence Filters
bootp.option.hostname# Shows all DHCP traffic containing the “hostname” option.http.host# Displays packets containing the HTTP host field, typically client requests to web servers.ftp.request.command# Displays FTP command packets like USER, PASS, and RETR. - Specialized Filters
tcp.analysis.flags# Displays all TCP analysis packets, including those involving packet loss, retransmissions, and zero window flags.```tcp.analysis.zero_window``` # Displays marked packets indicating that the sender's buffer space is full.
Display Filter Syntax Check
- Red indicates an error.
- Green signifies valid and executable syntax.
- Yellow indicates correct syntax, but the filter may not retrieve the desired packets.
Common Display Filters and Their Expressions
- Data Link Layer:
Filter packets with MAC address 04:f9:38:ad:13:26 —- “`eth.src == 04:f9:38:ad:13:26“`
Filter packets with source MAC address 04:f9:38:ad:13:26 —- “`eth.src == 04:f9:38:ad:13:26“`
- Network Layer:
Filter packets with IP address 192.168.1.1 —- “`ip.addr == 192.168.1.1“`
Filter packets in the 192.168.1.0 subnet —- “`ip contains “192.168.1”“`
Filter packets between 192.168.1.1 and 192.168.1.2 —- “`ip.addr == 192.168.1.1 && ip.addr == 192.168.1.2“`
Filter packets from 192.168.1.1 to 192.168.1.2 —- “`ip.src == 192.168.1.1 && ip.dst == 192.168.1.2“`
- Transport Layer:
Filter TCP protocol packets —- “`tcp“`
Filter packets excluding TCP protocol —- “`!tcp“`
Filter packets with port 80 —- “`tcp.port == 80“`
Filter packets between port 12345 and port 80 —- “`tcp.port == 12345 && tcp.port == 80“`
Filter packets from port 12345 to port 80 —- “`tcp.srcport == 12345 && tcp.dstport == 80“`
- Application Layer:
Special Note: In HTTP, “`http.request“` represents the first line of the request header (e.g., “`GET index.jsp HTTP/1.1“`), while “`http.response“` represents the first line of the response header (e.g., “`HTTP/1.1 200 OK“`). Other headers are represented as “`http.header_name“`.
Filter HTTP packets with URLs containing `.php` —- “`http.request.uri contains “.php”“`
Filter HTTP packets with content containing `username` —- “`http contains “username”“`
TShark Command-Line Tool
TShark – Capture and analyze network traffic.
Overview
TShark [ -2 ] [ -a ] … [ -b ] … [ -B ] [ -c ] [ – ? ] [ -d == , ] [ -D ] [ -e ] [ -E ] [ -f ] [ -F ] [ -g ] [ -h ] [ -H ] [ -i | – ] [ -I ] [ -K ] [ -l ] [ -L ] [ -n ] [ -N ] [ -o ] … [ -O ] [ -p ] [ -P ] [ -q ] [ -Q ] [ -r ] [ -R ] [ -s ] [ -S ] [ -t a|ad|adoy|d|dd|e|-[r|u|ud|udoy] [ -T fields|PDML|PS|PSML|text ] [ -u ] [ -v ] [ -V ] [ -w |- ] [ -W ] [ -x ] [ -X ] [ -y ] [ -Y ] [ -z ] [ –capture-comment ] [ ]
TShark -G [column-formats|currentprefs|decodes|defaultprefs|fields|ftypes|heuristic-decodes|plugins|protocols|values]
Options (Summary)
For detailed options, refer to this link.
-a Sets a condition for automatically stopping capture. The condition’s syntax is test:value, where test could be:
– “`duration:value“` Stops capture after the specified number of seconds.
– “`filesize:value“` Stops capture when the file reaches the specified size in KB. When combined with the `-b` option, TShark will switch to the next file when this size is reached.
– “`files:value“` Stops capture after the specified number of files is written.
-c Specifies the maximum number of packets to capture or read when analyzing a live stream or file.
-D Lists all interfaces available for packet capture and exits. Each interface is displayed with a number, interface name, and possibly additional description text.
Note: “Capturable” means TShark can open the interface for live capture. Depending on your system, you may need special privileges (e.g., root access) to capture traffic. Running “`TShark -D“` without elevated privileges on certain systems may not display available interfaces.
-e Adds specific fields to the output list when “`-T fields“` is selected. This option can appear multiple times, and every selected field name should be prefixed with “_ws.col.”.
Example: “`-e frame.number -e ip.addr -e UDP -e _ws.col.info“`
For protocols, providing a field prints detailed data instead of just the item. Fields are separated by tabs, but formatting can be controlled via the “`-E“` option.
-E Adjusts output format for “`-T fields“` option.
Options include:
– “`header=[Y|N]“` Add header names as the first output row if set to Y, using field names from “`-e“`.
– “`separator=“` Sets character separator (e.g., tab, space, or custom character). Default is tab.
– “`quote=[D|S|N]“` Adds double (D), single (S), or no (N, default) quotes around fields.
-f Specifies a capture filter expression (e.g., BPF syntax). Filters depend on the capture system being used.
Note: Live capture filtering cannot use advanced filters like “`ip.addr“`. Use “`tcp port“`, etc.
-r Specifies the input file for analysis. Formats like PCAP, PCAPNG, or GZIP-compressed formats are supported.
-w Saves raw packet data to the specified file. This output is in binary format and cannot be read directly without network analysis tools.