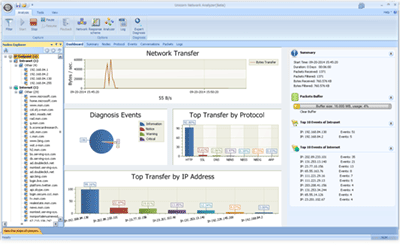
Packet analysis is a complex topic. If Wireshark is started without setting parameters, it will begin capturing in real-time or open a pre-recorded pcap file. In a short time, there might be thousands of packets waiting for analysis. There is a danger of getting overwhelmed by the volume of data.
However, if users wish to delve deeply into packet analysis, there is no other product that can replace Wireshark. Yet, there are methods to make this task easier.
This article explains strategies for tackling challenges and reducing packet analysis work—whether for troubleshooting or assessing network quality.
The first part, which is discussed in this issue, explains techniques on how to conduct structured searches using Wireshark tools. Here, it covers techniques of filters, color coding, and protocol hierarchy.
The second part will be introduced in the next issue, where we demonstrate how to use Allegro Network Multimeter to accelerate the work of a pcap analyst.
The Flagship Wireshark
The open-source program Wireshark is a very handy pcap analyzer. Emerging from its predecessor “Ethereal,” it has existed since 2006 and has since pushed all competing commercial products out of the market. Wireshark is a packet-oriented analyzer used for pinpointing problems and graphically displaying data logs.
Most busy networks have many levels of network connections requiring precise packet analysis. For instance, merely accessing a website generates connections to many other hosts.
The Use of Filters
Given the volume of data to be processed, pcap file analysis can be a challenge. Filters can be used to selectively hide connections of no interest. Our goal is to ultimately obtain a manageable set of packets as a starting point for detailed analysis.
Apart from applying external tools and techniques like BPF syntax to filter traffic, Wireshark has some onboard means to reduce the glut of information to get closer to the relevant information. Wireshark differentiates between two types of filters. Capture filters define which packets are recorded; display filters define which captured packets are included in the current analysis. However, these two filters use different syntax.
Simple Display Filters in Wireshark
The most commonly used technique in Wireshark for streamlining content is to use display filters.
The simplest use of display filters is to reduce traffic to a single application, a specific protocol, or an exact specification of a data field. To do this, you can use the menu (Analyze->Display Filters) to select, for example, the HTTP protocol, which limits the view to all HTTP entries, or directly insert the desired filter value in the filter toolbar. If you wish to see only all SIP connections, you just need to enter ‘sip’ in the input field and confirm with ‘Enter’.
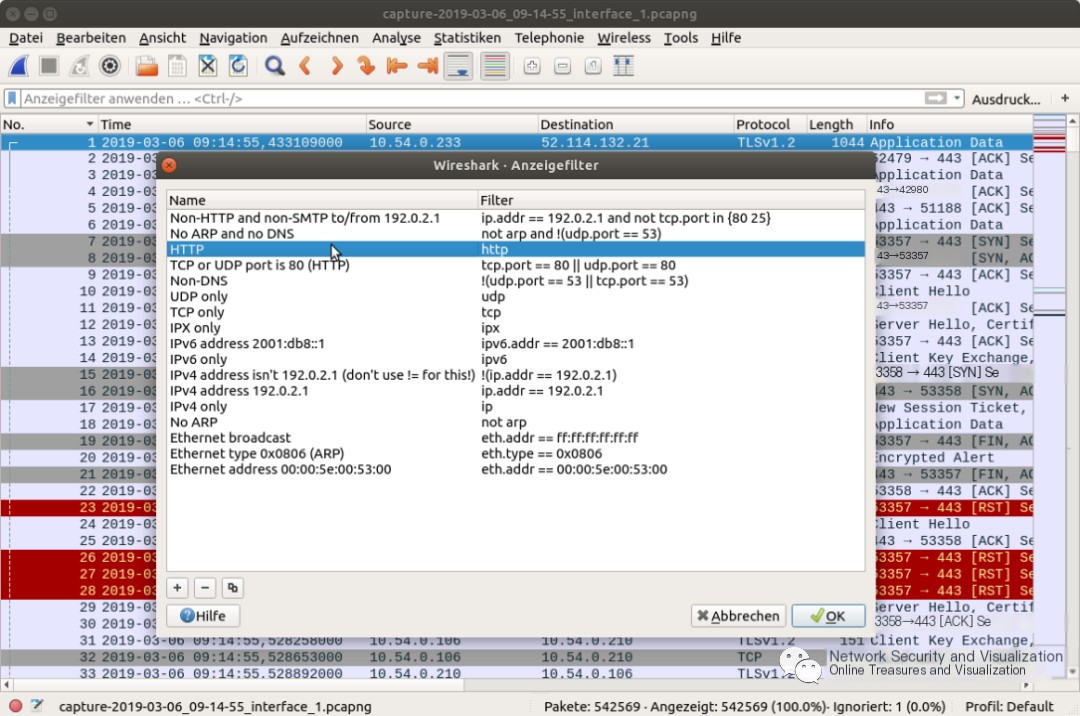
Specific protocol filtering by display filters in Wireshark
When filters are active, they can be seen in the input field of the filter toolbar (highlighted in green). The status bar at the bottom right also shows that a filter is set, or indeed only a certain proportion of packets is being displayed at the time.
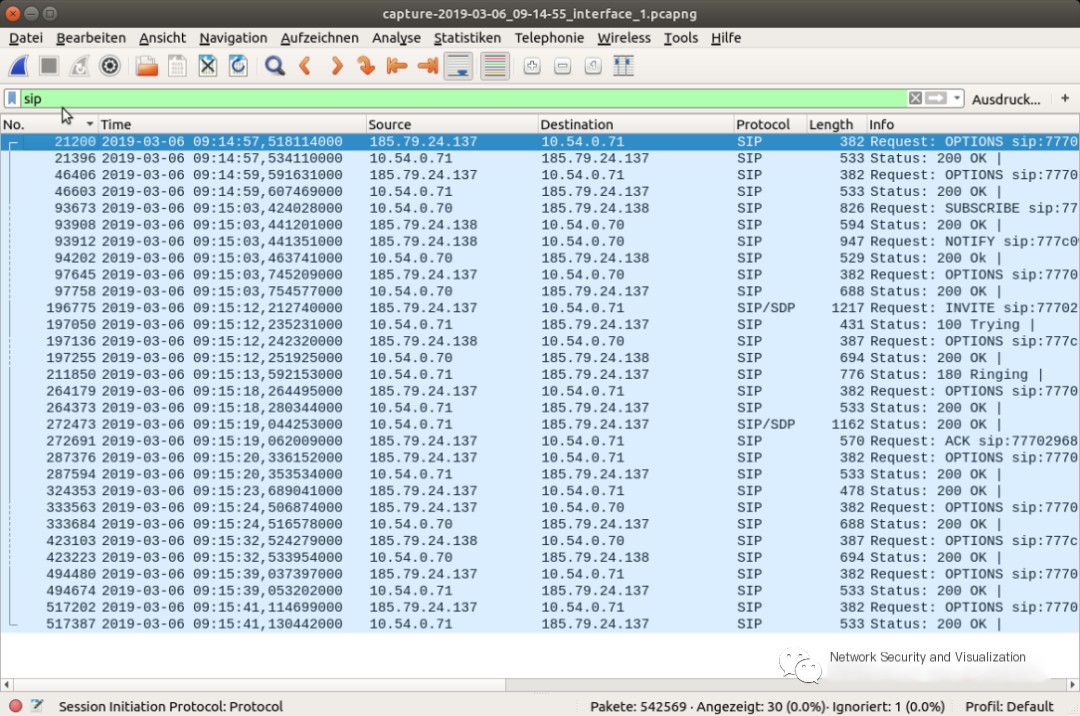
As you directly enter display filters, Wireshark offers an autocomplete feature, so when entering a filter, all available filters with the same letter sequence are suggested.
Comparison Operators
Besides using simple filters, conditions can also be linked. Wireshark’s filter syntax provides brackets, logical operators like ‘and’ ‘or’, and comparison operators like == or !=.
For example, if you want to show “any TCP traffic from IP address 10.17.2.5 to port 80,” in Wireshark’s filter syntax, it translates to ip.src == 10.17.2.5 and tcp.dstport == 80.
In this example, the conditions are connected using ‘and’. Condition 1 stipulates that the source IP address of the packets must be 10.17.2.5, condition 2 stipulates that the protocol must be TCP and the destination port must be 80.
Any number of conditions can be linked together to further limit the selection of displayed traffic.
Expression Builder from Wireshark
As a proficient Wireshark user, expressions can be freely applied from memory. Initially, using Wireshark’s expression builder dialog to add expressions to the display filter is extremely easy.
When right-clicking the term “Expression” in the filter toolbar, this dialog opens. Here, predefined operators can be selected and linked. To check if the chosen filter is correct, the filter toolbar turns green. If the filter is invalid, the area turns red.
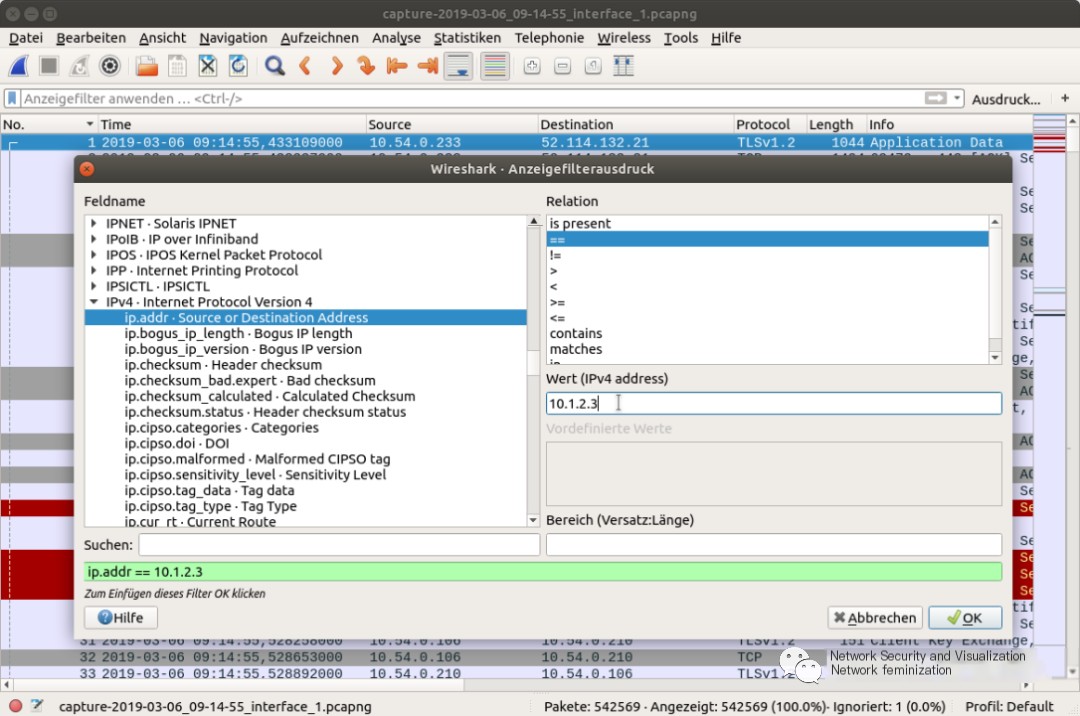
Calling the expression builder in Wireshark
Wireshark’s filters can be saved if needed.
Capture Filters
Besides the display filters mentioned above to reduce displayed packets, filters can also be applied at the moment traffic recording starts; these are called capture filters and ensure network data is confined to the desired selection range.
Wireshark capture filters use the same syntax as tcpdump, libpcap filters. That is, filtering data using their syntax with byte offsets, hexadecimal values, and masks related to truth values. The application of capture filters is not simple, as they are more arcane than display filters.
The Wireshark manual contains more information about the filters integrated into Wireshark.
This article only discusses the most important filters offered by Wireshark as onboard tools. Applying filters that are more arcane than the simplest display filters requires an in-depth understanding of Wireshark’s filter syntax to continually use filters to answer one’s research questions.
Using Color Marking in Wireshark
Aside from filtering capabilities, Wireshark has a customizable color-coding system. For instance, by default, all UDP packets are marked in blue, standard TCP transmissions in purple, and HTTP in green. These color codes help administrators identify packet types at a glance. User-defined color rules can be assigned to their configuration profiles and saved, completing the system. Both text and background colors are customizable.
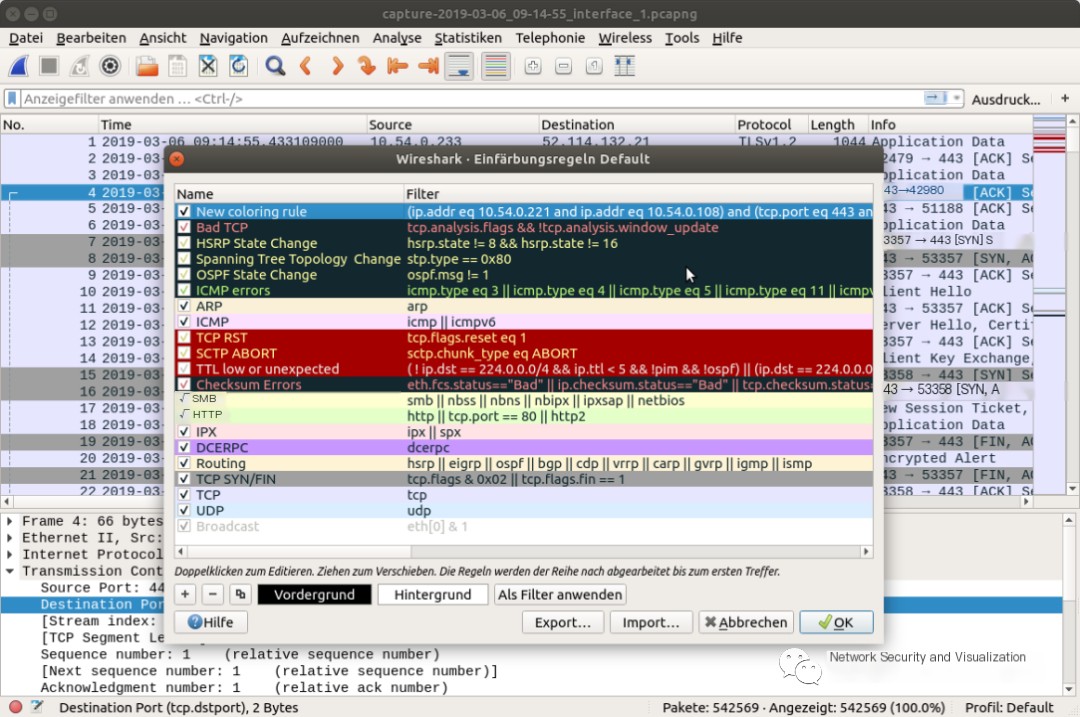
Individual data streams can be easily tracked through automatic color coding. However, to see at a glance which connections are active, or to which connections certain packets belong, rather than determining through IP address/port number, you can adjust via color codes. To enable this, right-click on the packet, then click “Colorize Conversation” from the context menu and select the connection type (Ethernet, IPv4, IPv6, TCP, UDP, etc.).
Coloring connections by transport protocol allows individual communication streams between the same IP pair to be distinguished. This provides a more refined analysis than merely looking at IP addresses. In cases with multiple simultaneous communications between hosts, or multiple communication connections to be distinguished between the same hosts, individual connection coloring is particularly useful. If you want to scrutinize any potentially suspicious traffic in detail, color coding is also a feasible recording method. It provides an easy-to-use technique for the initial localization of major pcap data files.
Using Protocol Hierarchy
The third technique to be introduced here is using protocol hierarchy for better localization in large pcap files. Compared to color coding, this requires advanced Wireshark knowledge. The use of protocol hierarchy offers useful clues, for example, when tracking suspicious applications or protocols.
To display the logs used in the recording file, the menu item “Statistics->Protocol Hierarchy” must be selected. The hierarchy provides a tree-like log view including statistical values for each log. It is called a hierarchy because data is arranged according to communication layers, as most packets contain multiple encapsulated protocols. Therefore, an HTTP packet is listed under a TCP packet, both under an IP packet, and so on.
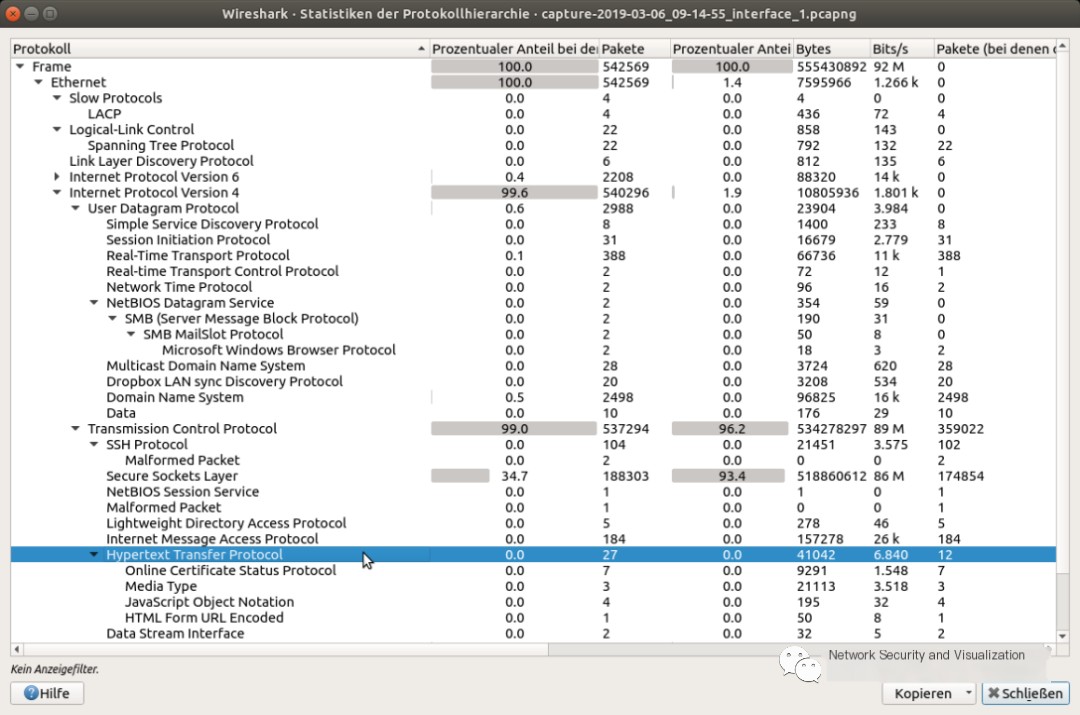
Wireshark view by protocol hierarchy
Apart from protocol information, administrators can also view how high the share of the total traffic is for that protocol, the exact number of packets, or the bandwidth for a given protocol. If unexpectedly high values are discovered in data entries, this traffic should be checked more carefully. For this purpose, mark the entry with the mouse for further analysis. A context menu opens where data can be filtered or colored directly. Due to the hierarchical structure of the list, logs cannot be sorted or rearranged.
However, deductive strategies can be adopted, and uninterested logs can be filtered directly from the protocol hierarchy view. A separate capture file can be saved from the filtered results.
Overall, protocol hierarchy is a scalable way to gain an overall view of a pcap file. The protocol hierarchy is often the starting point for further analysis, as this is where unexpected traffic or errors can be seen, such as unexpected protocols or unexpected data proportions of individual protocols. What often draws attention is not the presence of a protocol but its relative proportion.
In the next issue, we will show you how to use the Allegro Network Multimeter as a pre-filter to filter and build large capture files.


