🚀 Introduction: Yu Gong Moved Code
Wireshark is a network protocol analysis tool that helps users capture and analyze network data packets. In a wireless network environment, Wireshark can be used to monitor and analyze wireless network traffic, helping users understand the communication status and issues within the network.
The following are the steps for wireless monitoring and replay analysis with Wireshark:
- Install Wireshark: First, download and install the Wireshark software from the Wireshark official website. Wireshark has versions for different operating systems, including Windows, Mac, and Linux.
- Connect Wireless Network Adapter: Ensure that your computer has a wireless network adapter and is connected to the target wireless network. If you are using a mobile device (like a laptop), ensure the wireless network adapter is enabled.
- Open Wireshark: After launching Wireshark, you will see an interface displaying all the network interfaces on the computer. Find your wireless network adapter and click it to select it.
- Start Capturing Packets: In the Wireshark main interface menu bar, click the “Capture” option, then choose the “Start” button. Wireshark will start capturing wireless network traffic.
- Analyze Packets: Once Wireshark begins capturing packets, it will display the list of captured packets. You can use various filters and display options to browse, filter, and analyze the packets. For example, you can use filters to display only packets from a specific IP address or a particular protocol.
- Stop Capture and Save Packets: When you want to stop packet capture, click the “Stop” button on the Wireshark interface. Then you can choose to save the captured packets to a file for further analysis or sharing.
- Analyze and Interpret Packets: By analyzing captured packets, you can understand wireless network communication traffic, protocol usage, errors, and issues. Wireshark provides comprehensive analysis features like statistics, protocol parsing, traffic graphs, and session reconstruction.
Using Wireshark for wireless monitoring and replay analysis requires certain network knowledge and skills. It is necessary to understand wireless network protocols, encryption methods, and network security principles, as well as Wireshark’s usage tips and analysis capabilities.
🚀 I. Yu Gong Moved Code: Wireshark for Wireless Monitoring and Replay Analysis
🔎 1. Enable Wireless Network Adapter Monitoring Mode.
Kali does not support built-in network adapters, only USB network adapters. I use a virtual machine. First, open the USB network adapter connection in the removable devices of the virtual machine and execute the ifconfig command to disable the wireless network adapter with the following command.
ifconfig wlan0 downUse the iwconfig tool to start monitoring mode.
iwconfig wlan0 mode monitorUse the following command to activate the wireless network adapter.
ifconfig wlan0 upNote: Here, wlan0 is the external wireless network interface name. Be sure to check your network card and modify the network card name according to the actual situation; it may not be wlan0 and could be wlan1, wlan2, etc.
🔎 2. Obtain Wi-Fi’s raw psk
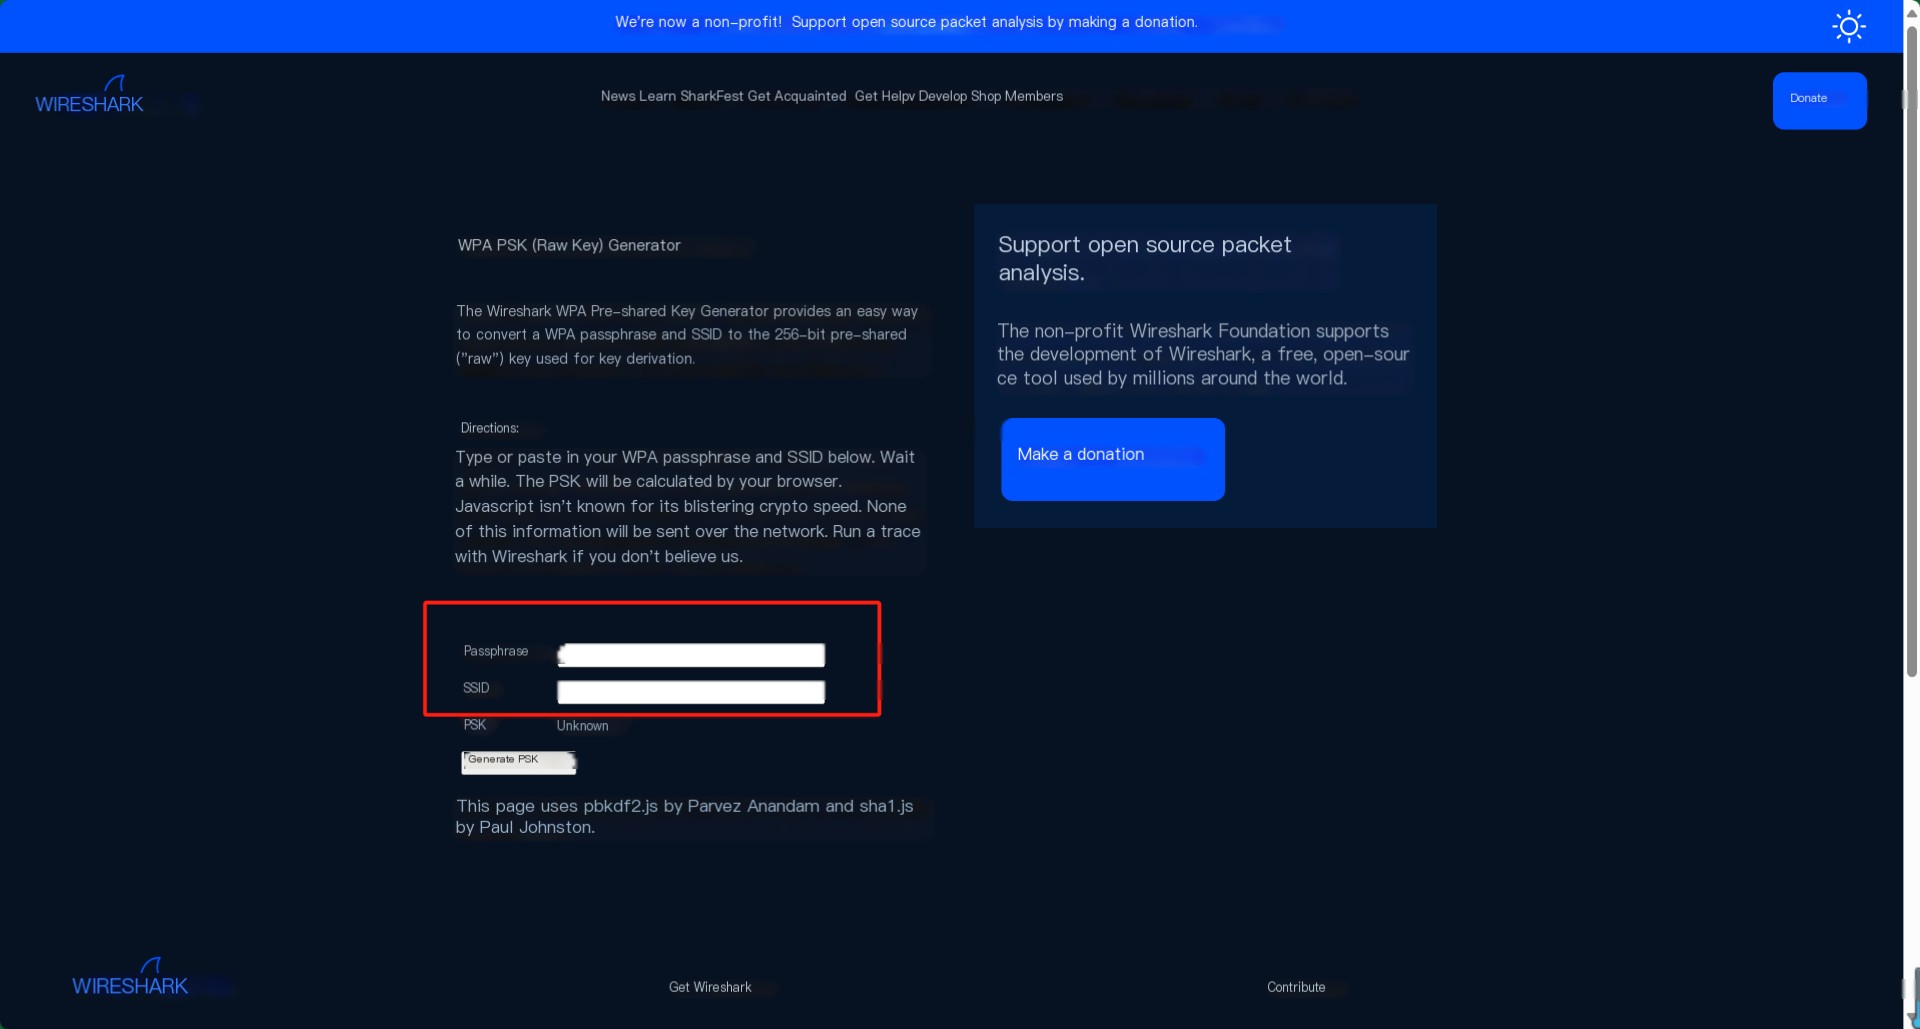
Go to https://www.wireshark.org/tools/wpa-psk.html, enter the Wi-Fi name and password in the appropriate fields, and click the “Generate PSK” button, as shown in the image.
 />
/>
🔎 3. Configure Wireshark
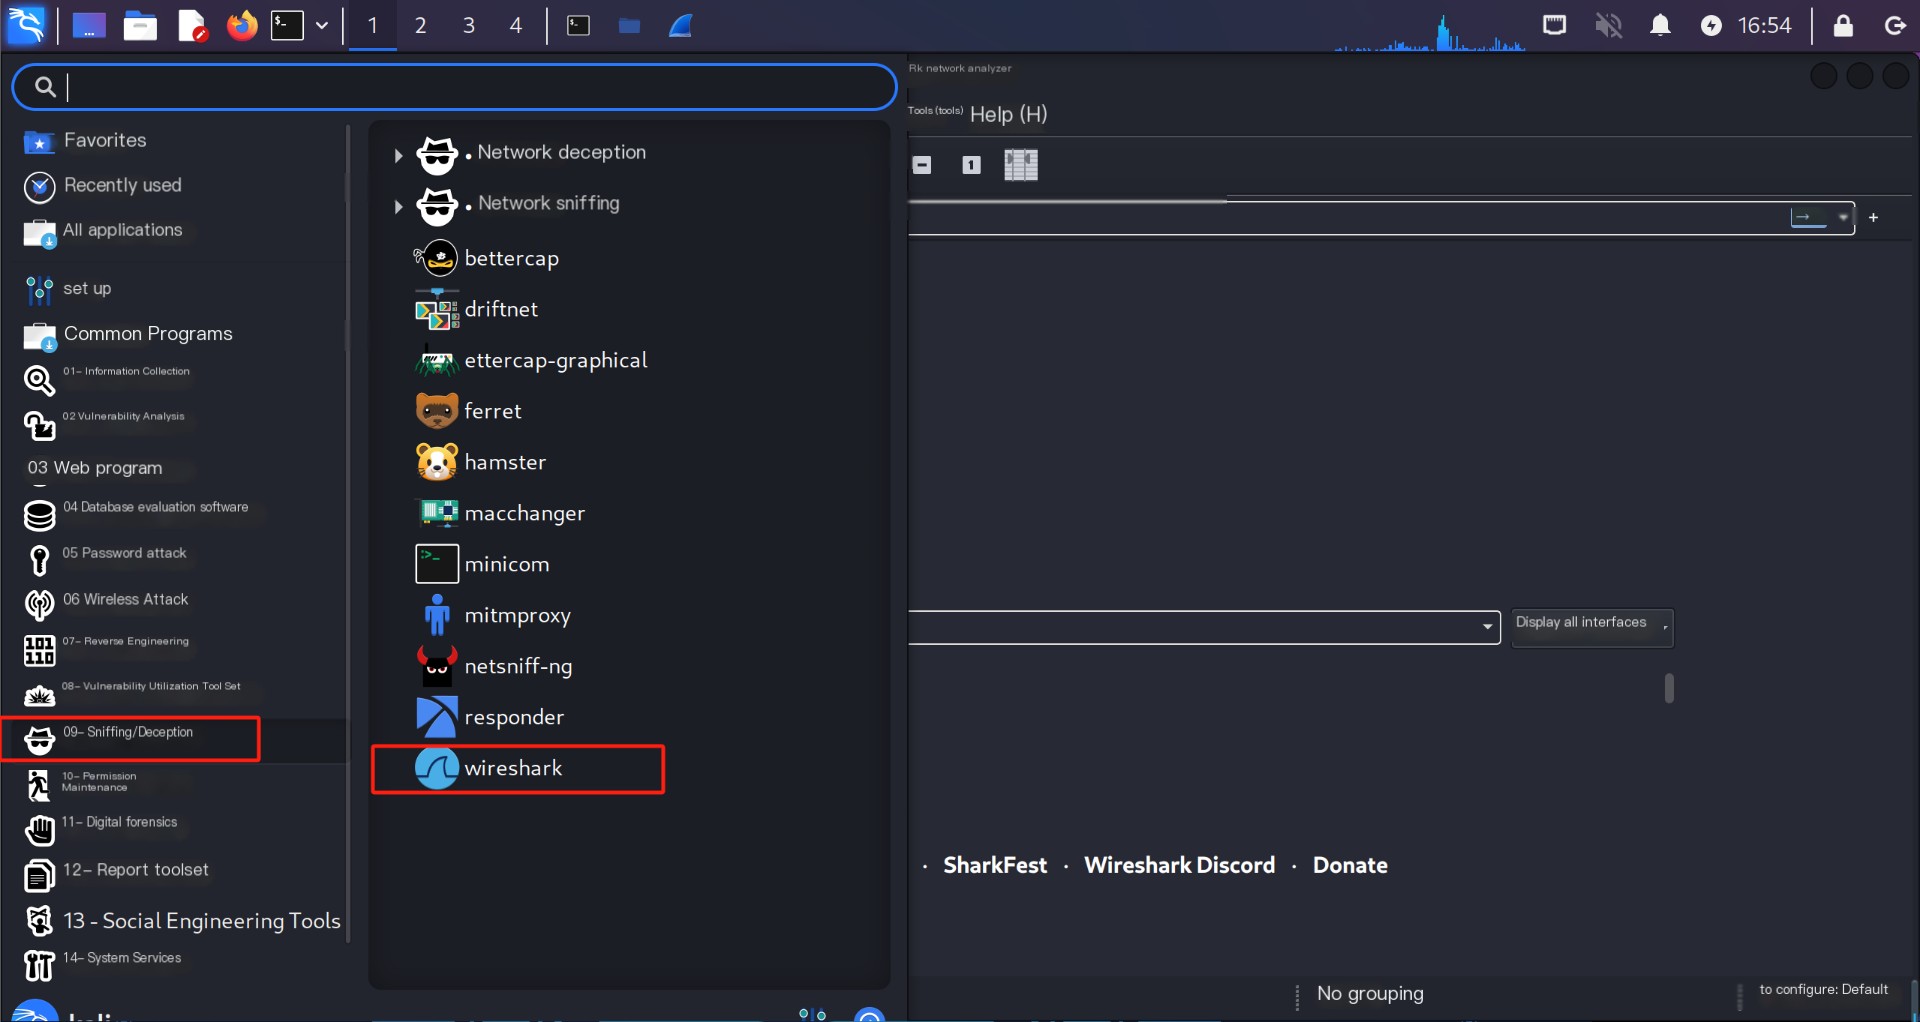
Once the virtual machine connects to the external wireless network adapter, select Applications → Sniffing/Spoofing → Wireshark to launch the Wireshark tool, as shown in the image.
 />
/>
A window may pop up reporting an error because Wireshark is run under the root user, disabling some features that may affect system security. Click OK to proceed, and it won’t affect the next operation.
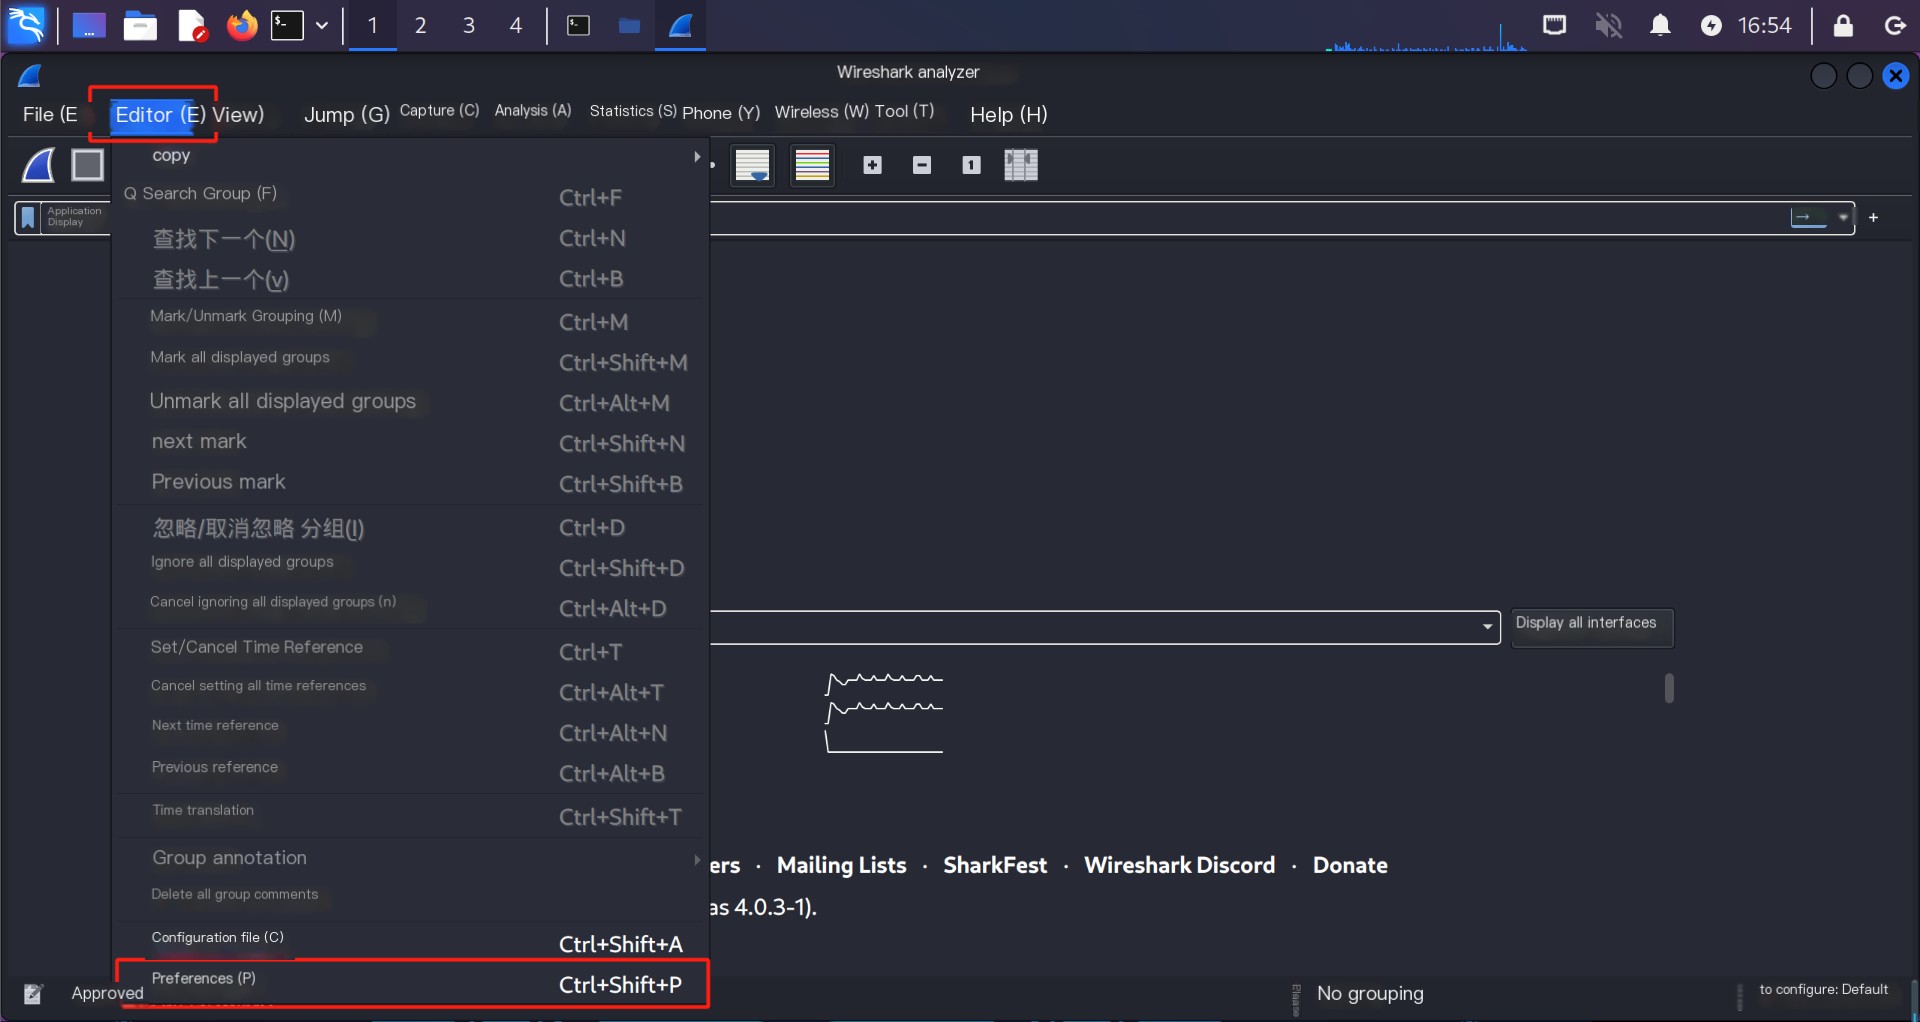
Select the “Edit” → “Preferences” command to configure it, as shown in the image.
Select Protocols on the left side, and then choose IEEE802.11, check the Enable decryption checkbox, as shown in the image.
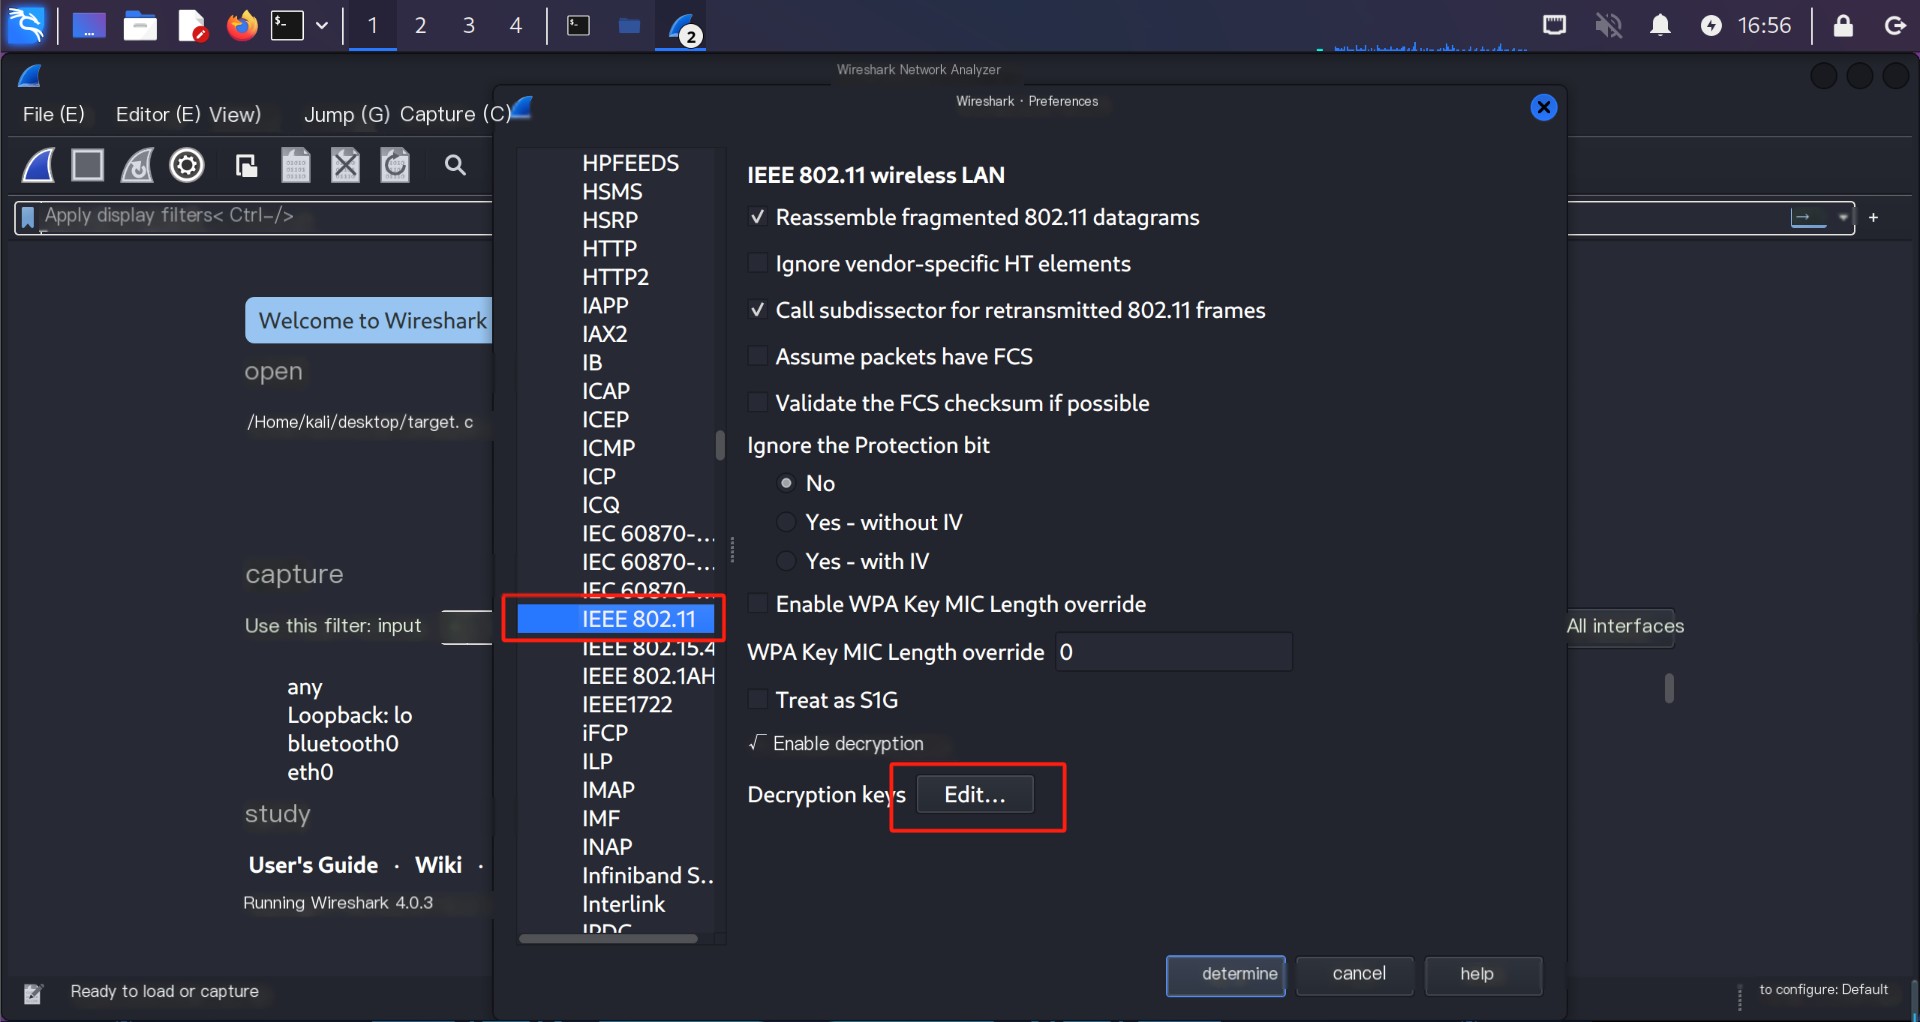
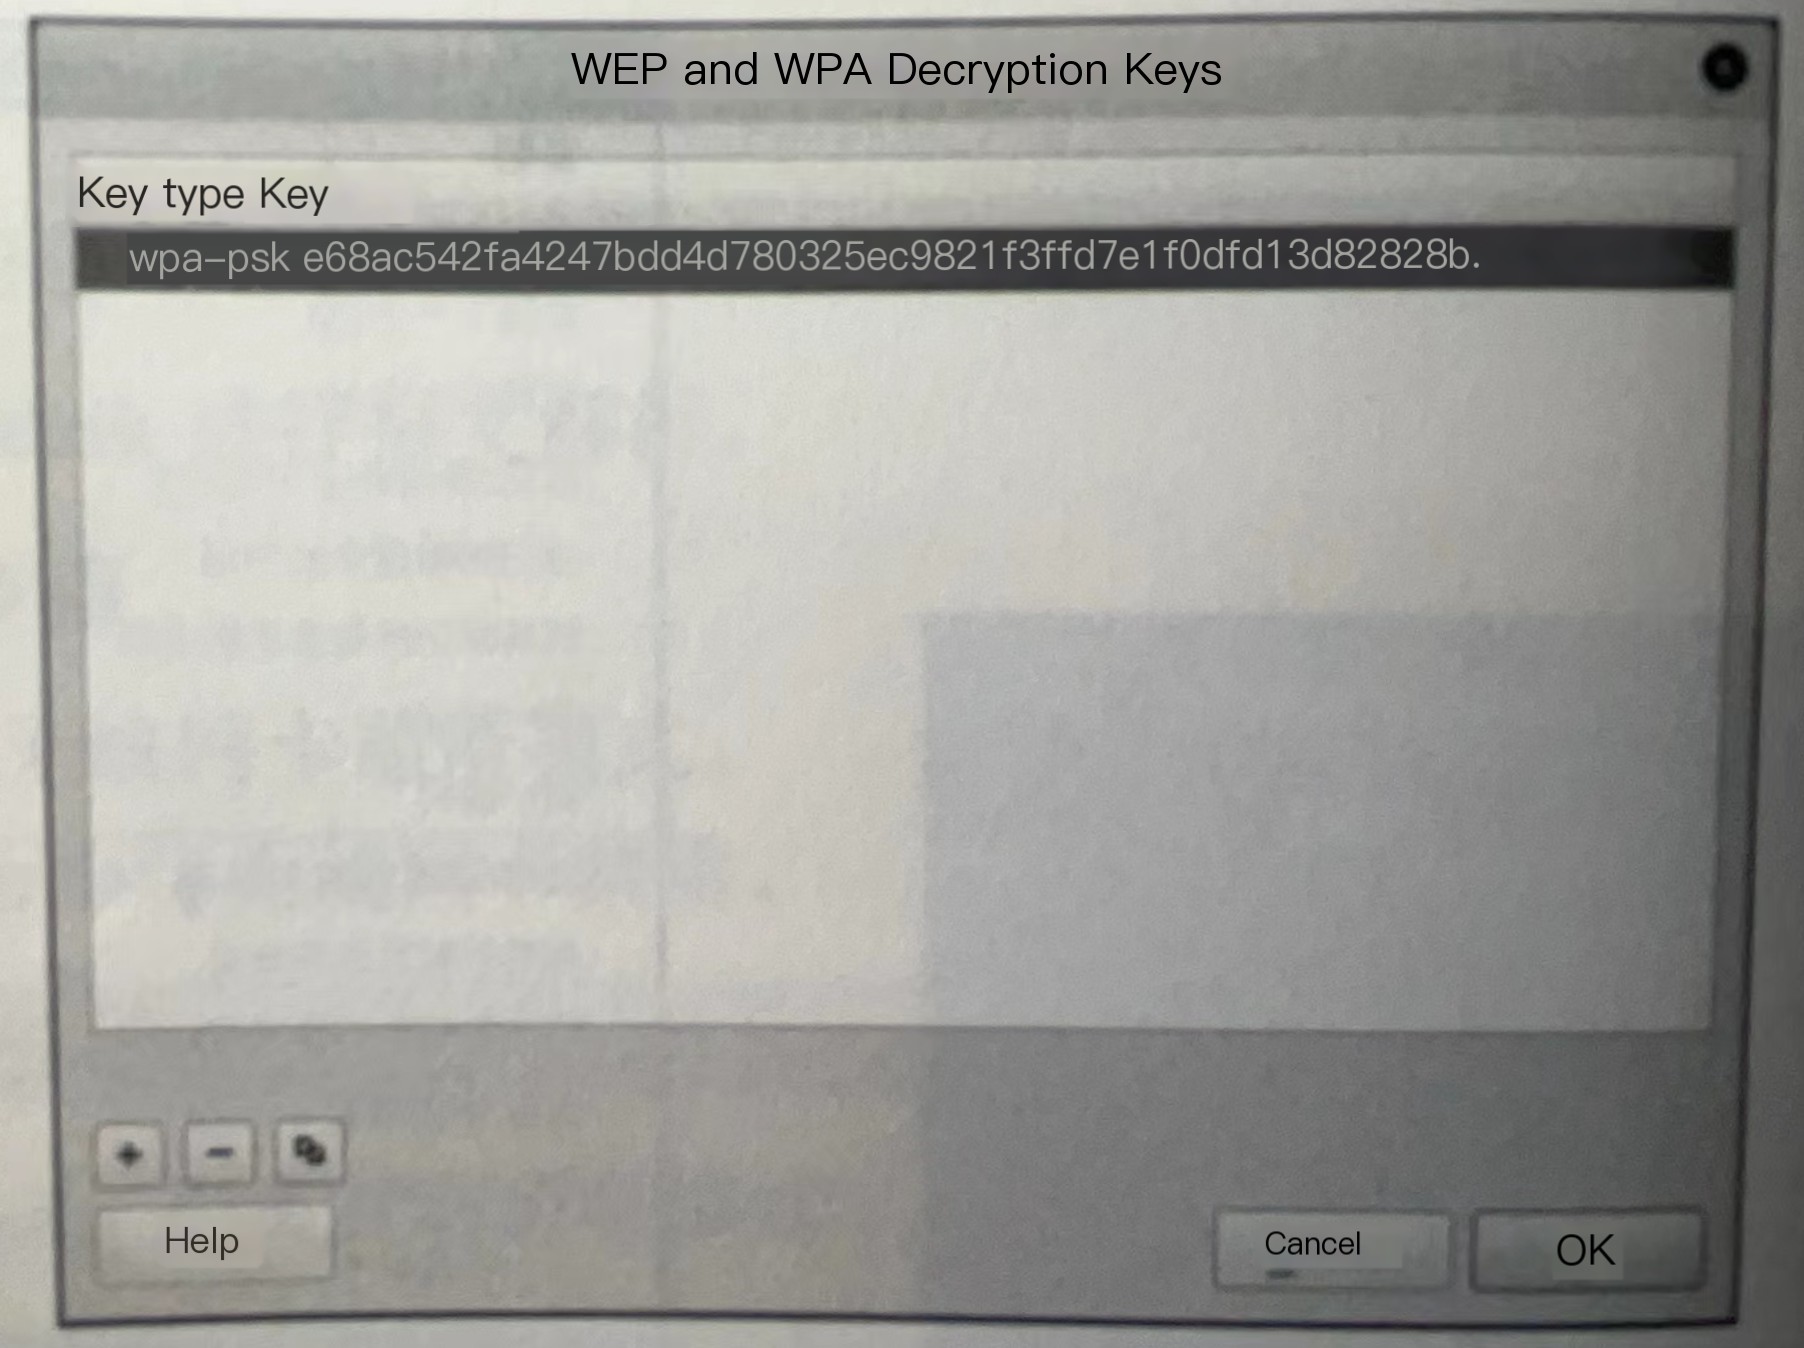
Click the Edit button next to Decryption keys. In the pop-up window, click the “+” button in the lower-left corner to add a new key, as shown in the image. Choose Keytype as wpa-psk, and the Key as the previously generated raw PSK.
Select wlan0mon to start listening, as shown in the image.
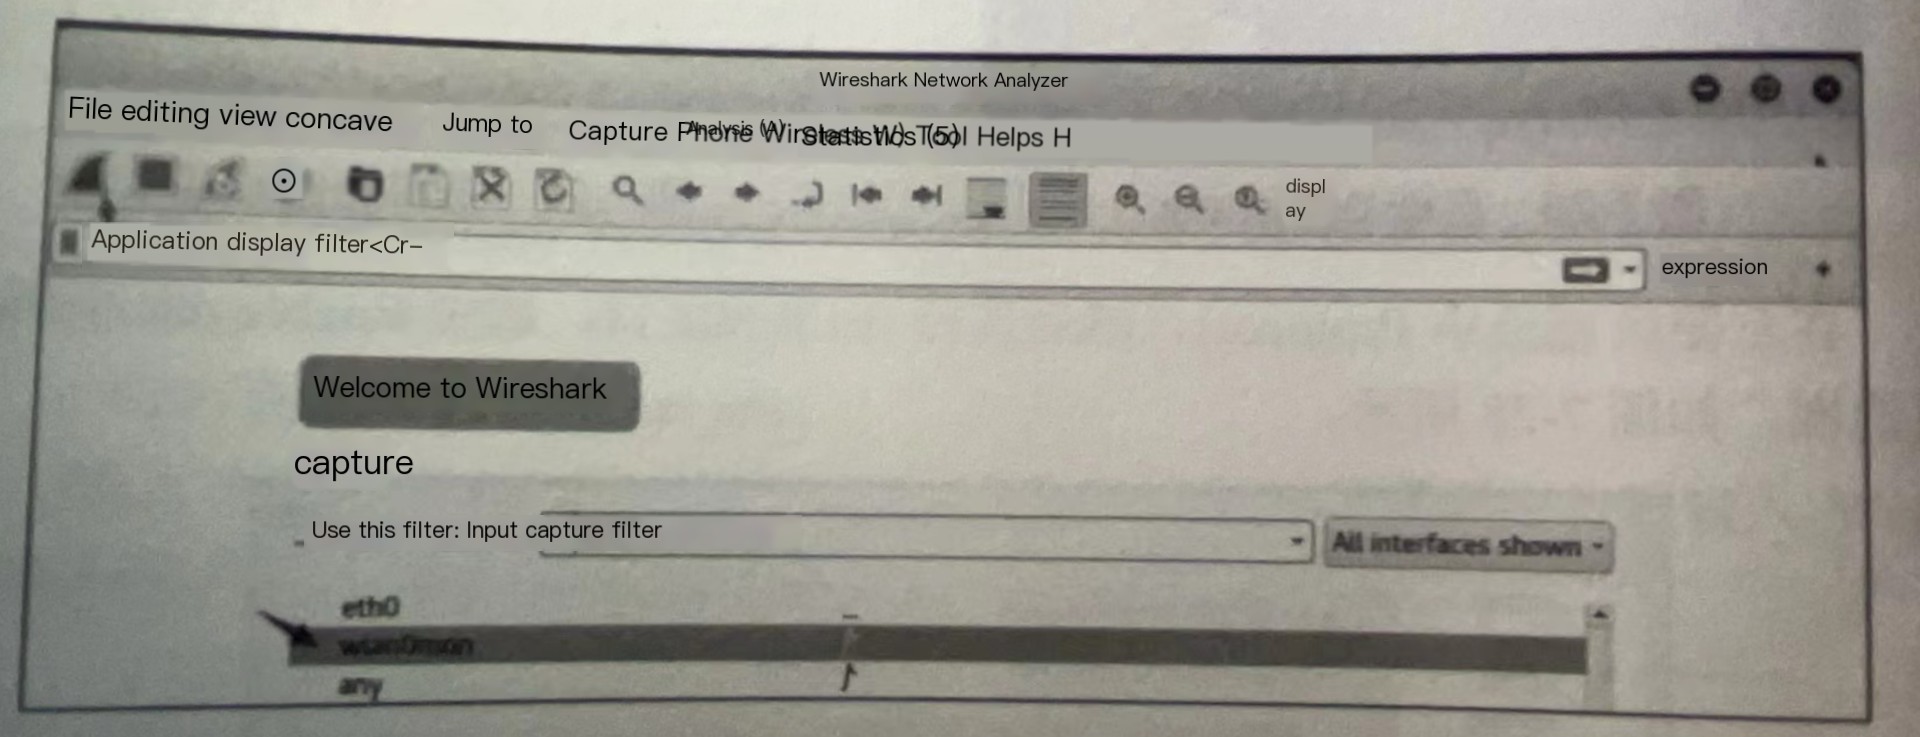
Note: The thing behind the network card, similar to an ECG, represents the network card’s traffic.
🔎 4. Perform Wireshark Packet Filtering and Analysis
The common filtering rules are as follows.
- ip.src==127.0.0.1: Filter packets with source IP as 127.0.0.1.
- ip.dst==127.0.0.1: Filter packets with destination IP as 127.0.0.1.
- ip.addr==127.0.0.1: Filter packets with source or destination IP as 127.0.0.1.
- tcp.port==8080: Filter packets that pass through port 8080.
- tcp.port>=8080: Filter packets that pass through ports greater than port 8080.
- tcp: Filter all TCP packets.
- http: Filter all HTTP packets.
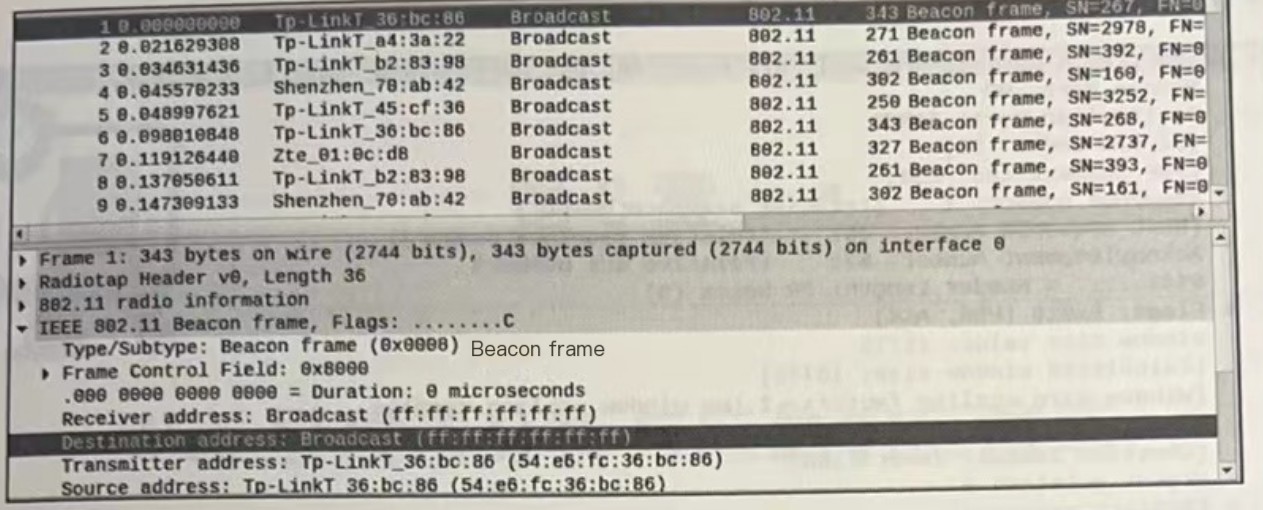
Now analyze the packets. First, in monitoring mode, the network adapter can only know the packet type after successfully cracking the packet; otherwise, all are white IEEE802.11 header packets, which can only show basic information, like whether it is broadcast, a data frame, or a beacon frame, as shown in the image.
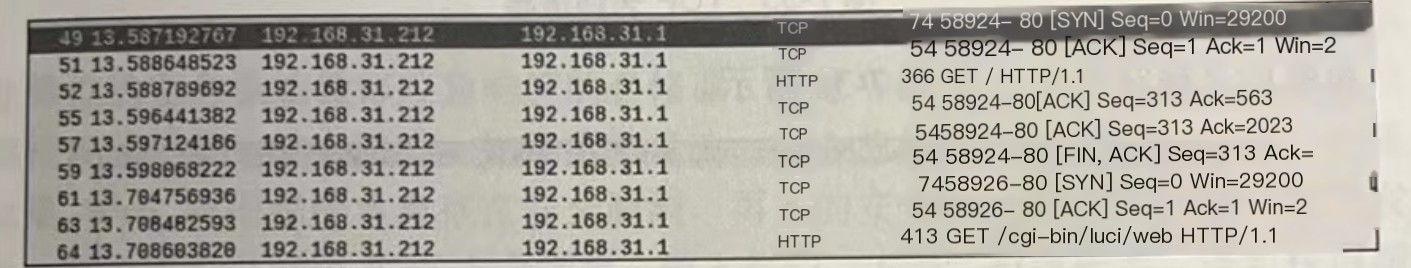
Only after receiving four handshake packets can the message information of the client be decrypted. You can check through TCP whether the handshake packets are received because the first successfully received handshake packets are always TCP. The first received handshake packet information is as shown in the image.
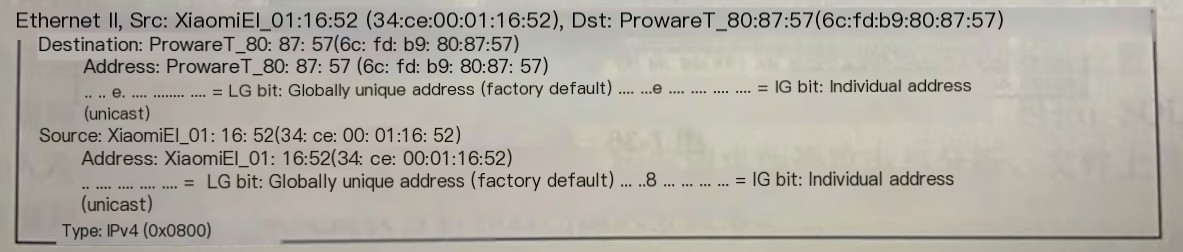
The specific packet information is exemplified by an HTTP packet, where the IEEE802.11 header includes frame control information (Frame Control Filed), showing it as a data frame with AP’s ESSID (name) and BSSID (MAC address), as shown in the image.
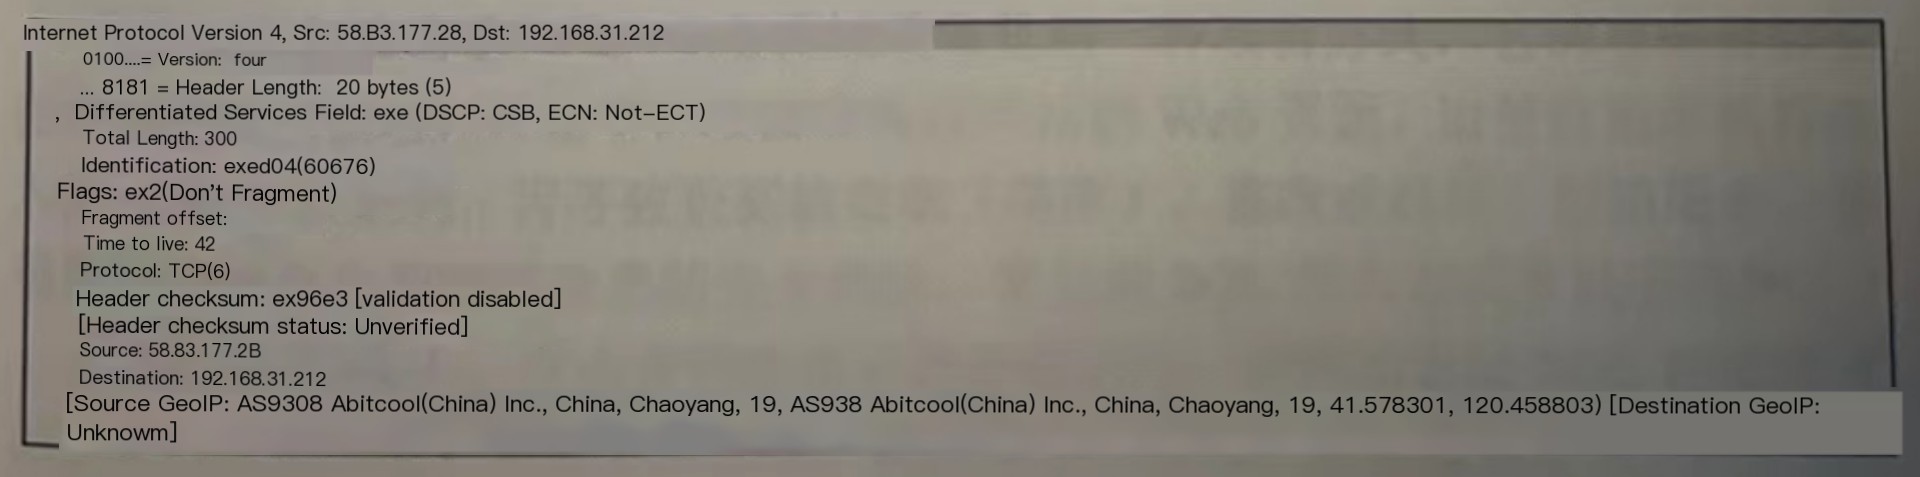
The IP header includes source (Source) IP, destination (Destination) IP, and related information: checksum, geographic location (last line), as shown in the image.
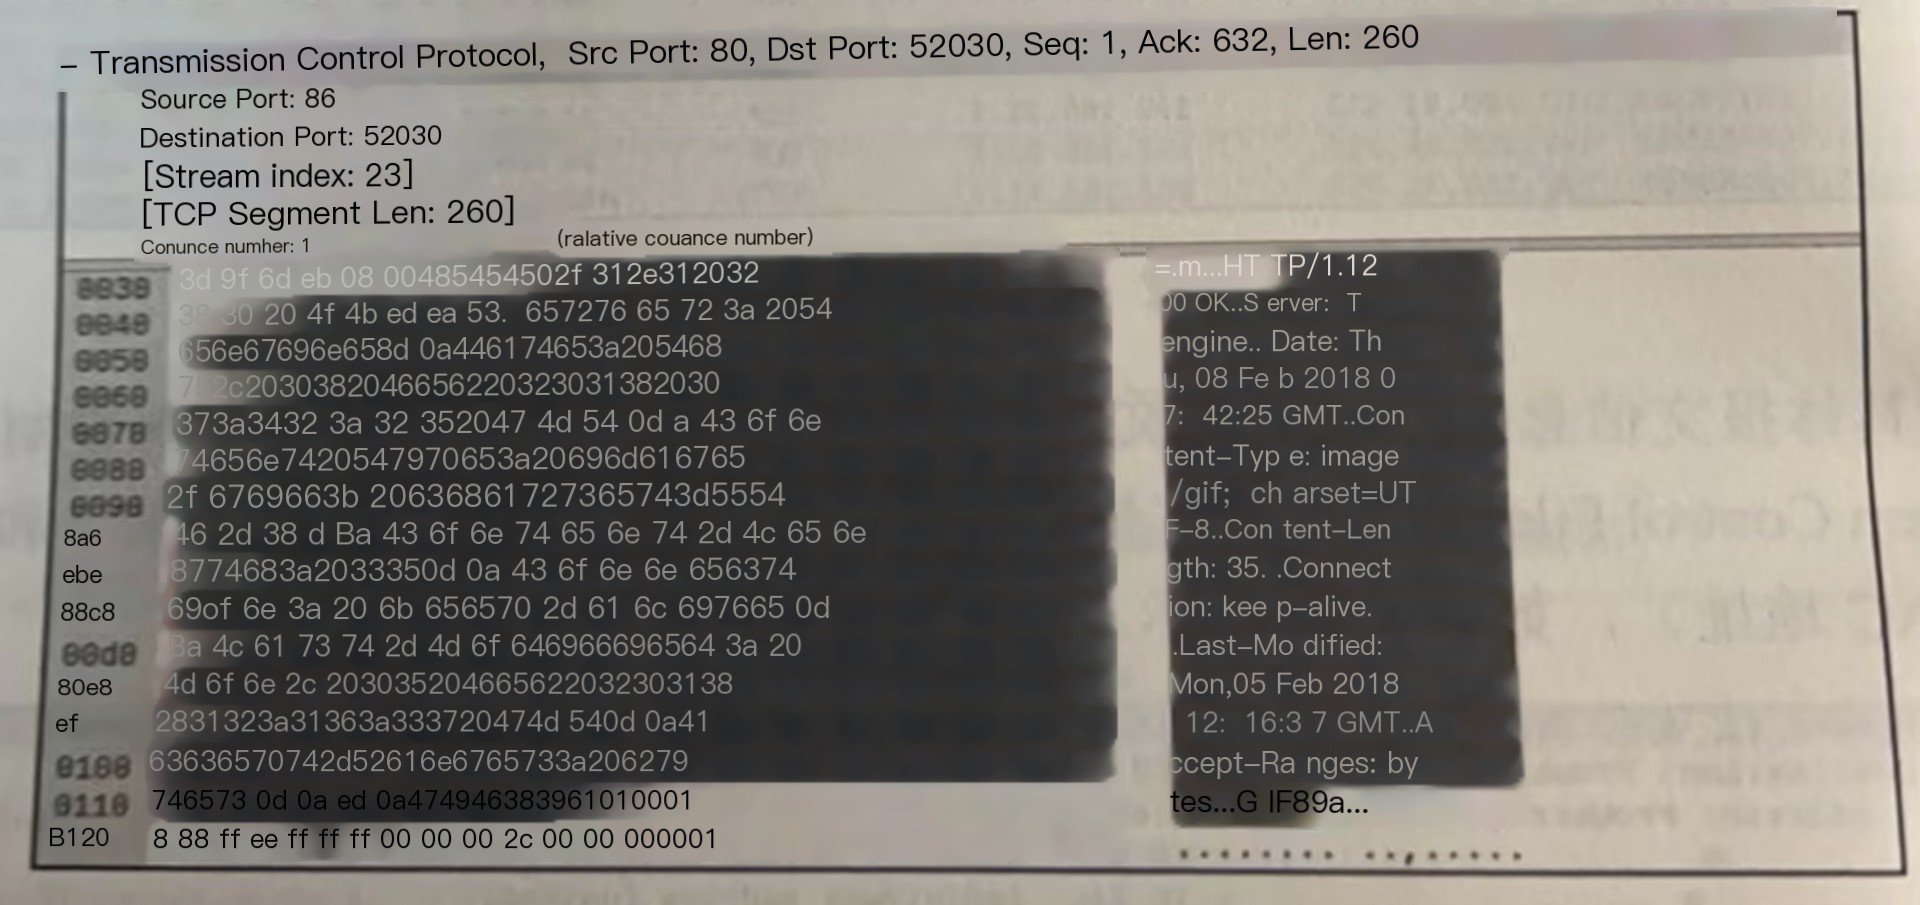
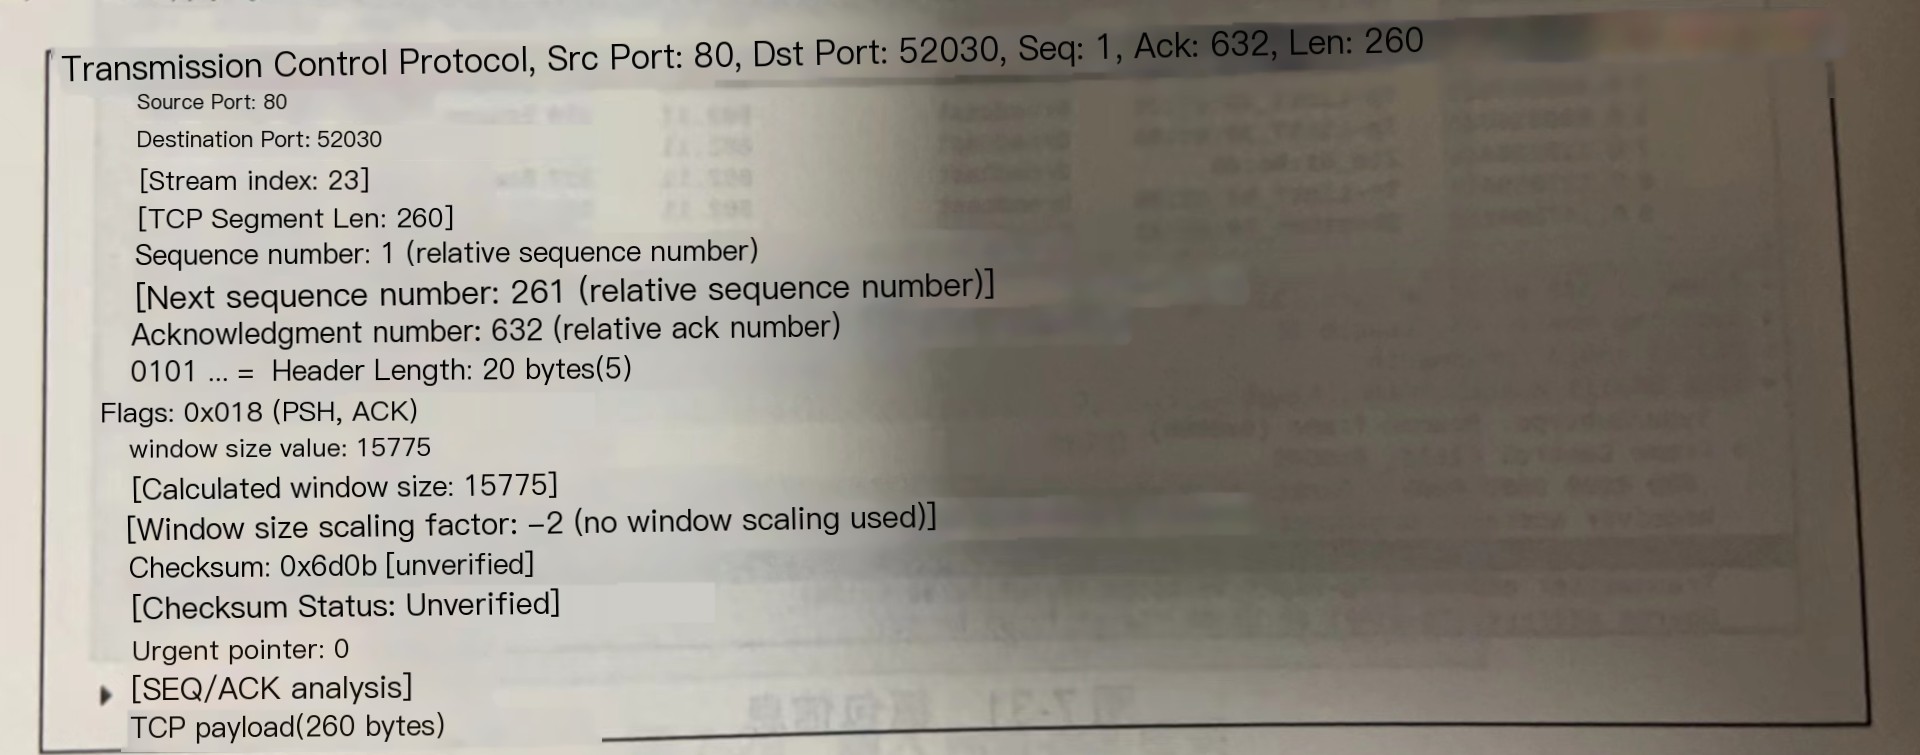
The TCP header mainly includes the source port (Source Port) and destination port (Destination Port), as shown in the image.
Message Information