

Network Performance Monitoring: An Overview
Network Performance Monitoring focuses on three critical aspects: bandwidth measurement, throughput evaluation, and data flow analysis. Bandwidth measurement identifies the network’s hardware capabilities, including its maximum capacity. Throughput measurement assesses the actual capacity that the network can deliver, while data flow measurement provides insights into current network utilization.
This article explores the essential data to collect and the methods for gathering it to effectively evaluate Network Performance. The tools discussed include ping, pathchar, bing, ttcp, netperf, iperf, and netstat.
More Information
Bandwidth measurement:
ping
The time returned by the ping tool, although usually described as transmission delay, is actually the sum of the send, transmission, and queue delays. In the previous section , we used ping to roughly calculate the bandwidth. This process can be improved as follows: first calculate the path behavior at the near end of the link, then calculate the far end path, and then use the difference between the two to estimate the link bandwidth.
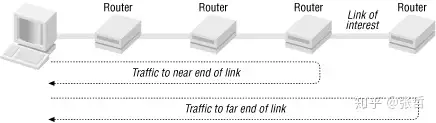
This process requires four pings. First, ping the near-end link with two packets of different sizes. The time difference, minus the time to transmit the extra data in the large packet, estimates the transmission and queuing delays. Next, ping the far-end link with the same two packets. Again, use the time difference between the large and small packets to estimate the overhead. Finally, the difference between the two differences is the time it took to transmit the extra data in the last segment of the link. This is the round-trip time, divided by 2 to get the time it takes for the extra data to be transmitted in a one-way link . Bandwidth is the total amount of extra data divided by the one-way transmission time.
The following table shows the time values for the second and third hops, with message sizes of 100 and 1100 bytes.
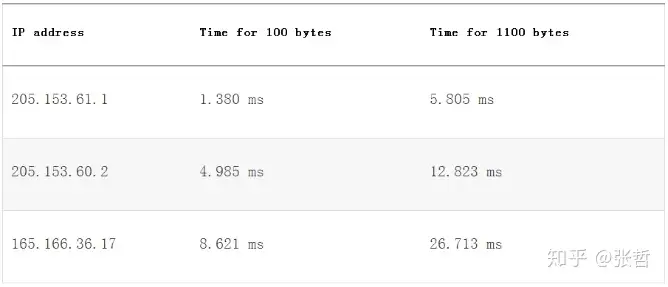
The following table shows the bandwidth calculation results, divided by 2, 8000 bits divided by this value, and then multiplied by 1000 (milliseconds to seconds). The result is bps converted to Mbps.
pathchar
Pathchar automates the bandwidth measurement process for Network Performance Monitoring by utilizing various packet sizes to assess the bandwidth of each link along the path. It provides detailed insights into both bandwidth and latency, along with queue latency information.. As shown in the following example:
bsd1# pathchar 165.166.0.2
pathchar to 165.166.0.2 (165.166.0.2)
mtu limited to 1500 bytes at local host
doing 32 probes at each of 45 sizes (64 to 1500 by 32)
0 205.153.60.247 (205.153.60.247)
|   4.3 Mb/s,   1.55 ms (5.88 ms)
1 cisco (205.153.60.2)
|   1.5 Mb/s,   -144 us (13.5 ms)
2 165.166.36.17 (165.166.36.17)
|    10 Mb/s,   242 us (15.2 ms)
3 e0.r01.ia-gnwd.Infoave.Net (165.166.36.33)
|   1.2 Mb/s,   3.86 ms (32.7 ms)
4 165.166.125.165 (165.166.125.165)
|   ?? b/s,   2.56 ms (37.7 ms)
5 165.166.125.106 (165.166.125.106)
|    45 Mb/s,   1.85 ms (41.6 ms),  +q 3.20 ms (18.1 KB) *4
6 atm1-0-5.r01.ncchrl.infoave.net (165.166.126.1)
|    17 Mb/s,   0.94 ms (44.3 ms),  +q 5.83 ms (12.1 KB) *2
7 h10-1-0.r01.ia-chrl.infoave.net (165.166.125.33)
|   ?? b/s,   89 us (44.3 ms),  1% dropped
8 dns1.InfoAve.Net (165.166.0.2)
8 hops, rtt 21.9 ms (44.3 ms), bottleneck 1.2 Mb/s, pipe 10372 bytes
As pathchar runs, the first information displayed describes how the probe is performed. Starting from the third line of output, you can see that pathchar uses 45 different message sizes ranging from 64 to 1500 bytes. For each hop, 32 different message combinations are used for testing. Therefore, a total of 11,520 test messages plus corresponding reply information are generated for 8 hops.
The display shows the bandwidth and latency. pathchar also includes queue latency information (5 and 6 in this example). As mentioned above, pathchar is not always able to successfully estimate bandwidth (such as links 4 and 7) or latency (such as link 1).
During the operation of pathchar, a countdown is started each time a message is sent. The displayed content is as follows:
1: 31 288 0 3
1 indicates the number of hops and increases with each subsequent hop on the path. The next number is a countdown value, giving the number of probe groups remaining for this link. The third value is the current size of the message being sent. Both the second and third values change very quickly. The second to last value is the number of messages dropped so far, and the last is the average round trip time for the link.
When a line is probed, the line is replaced with the bandwidth, transmission delay, and round-trip time. pathchar uses the minimum observed delay to refine the bandwidth estimate.
bing
An alternative to pathchar is bing. pathchar estimates the bandwidth of each link on a path, while bing measures the bandwidth from point to point. Usually, if you don’t know the links on the path, you need to run the traceroute command first . You can then run bing to specify the near and far ends of the link. The following example shows the bandwidth of the third hop:
bsd1# bing -e10 -c1 205.153.60.2 165.166.36.17
BING    205.153.60.2 (205.153.60.2) and 165.166.36.17 (165.166.36.17)
        44 and 108 data bytes
1024 bits in 0.835ms: 1226347bps, 0.000815ms per bit
1024 bits in 0.671ms: 1526080bps, 0.000655ms per bit
1024 bits in 0.664ms: 1542169bps, 0.000648ms per bit
1024 bits in 0.658ms: 1556231bps, 0.000643ms per bit
1024 bits in 0.627ms: 1633174bps, 0.000612ms per bit
1024 bits in 0.682ms: 1501466bps, 0.000666ms per bit
1024 bits in 0.685ms: 1494891bps, 0.000669ms per bit
1024 bits in 0.605ms: 1692562bps, 0.000591ms per bit
1024 bits in 0.618ms: 1656958bps, 0.000604ms per bit
--- 205.153.60.2 statistics ---
bytes   out    in   dup  loss   rtt (ms): min       avg       max
   44    10    10          0%           3.385     3.421     3.551
  108    10    10          0%           3.638     3.684     3.762
--- 165.166.36.17 statistics ---
bytes   out    in   dup  loss   rtt (ms): min       avg       max
   44    10    10          0%           3.926     3.986     4.050
  108    10    10          0%           4.797     4.918     4.986
--- estimated link characteristics ---
estimated throughput 1656958bps
minimum delay per packet 0.116ms (192 bits)
average statistics (experimental) :
packet loss: small 0%, big 0%, total 0%
average throughput 1528358bps
average delay per packet 0.140ms (232 bits)
weighted average throughput 1528358bps
resetting after 10 samples.
The output starts with address and packet size information, followed by the probe pair. Next, the round trip time and data loss are returned. Finally, some throughput estimates are returned.
By understanding these methods and tools for Network Performance Monitoring, network administrators can ensure optimal network functionality and capacity utilization.
Throughput Measurement:
Throughput measurement is critical for identifying performance bottlenecks in Network Performance Monitoring. Insufficient throughput may arise not only from inadequate hardware but also from architectural issues, such as an overly large broadcast domain. Restructuring the network to isolate or segment domains can resolve these issues.
Throughput is usually measured by measuring the latency of large data transfers. This usually requires running software at each end of the link. Usually this software runs at the application layer, so it measures not only the network but also the hardware and software.
A simple and crude way is to use FTP. Use FTP to transfer a file and look at the data it reports. You need to convert the result into bit rate . For example, this is the last line of the file transfer:
1294522 bytes received in 1.44 secs (8.8e+02 Kbytes/sec)
Multiply 1,294,522 bytes by 8 to convert to bits and then divide by the time, 1.44 seconds. The result is 7,191,789 bps.
The disadvantage of this method is that disk access time may affect the results. If you need to improve the accuracy, you need to use some tools.
TTCP
To run this program you first need to run the server on the remote machine, usually with the -r and -s options. Then you run the client, using the -t and -s options, and the host name or address. Data is sent from the client to the server, and after measuring performance, the results are returned on each side, and then the client and server are terminated. For example, the server might look like this:
bsd2# ttcp -r -s
ttcp-r: buflen=8192, nbuf=2048, align=16384/0, port=5001  tcp
ttcp-r: socket
ttcp-r: accept from 205.153.60.247
ttcp-r: 16777216 bytes in 18.35 real seconds = 892.71 KB/sec +++
ttcp-r: 11483 I/O calls, msec/call = 1.64, calls/sec = 625.67
ttcp-r: 0.0user 0.9sys 0:18real 5% 15i+291d 176maxrss 0+2pf 11478+28csw
The client side is as follows:
bsd1# ttcp -t -s 205.153.63.239
ttcp-t: buflen=8192, nbuf=2048, align=16384/0, port=5001  tcp  -> 205.153.63.239
ttcp-t: socket
ttcp-t: connect
ttcp-t: 16777216 bytes in 18.34 real seconds = 893.26 KB/sec +++
ttcp-t: 2048 I/O calls, msec/call = 9.17, calls/sec = 111.66
ttcp-t: 0.0user 0.5sys 0:18real 2% 16i+305d 176maxrss 0+2pf 3397+7csw
The program report shows the total amount of information transferred, identifies the establishment of the connection, and gives the results, including raw data, throughput, I/O call information, and execution time. The most useful information should be the transfer rate, 892.71 KB/sec (or 893.26 KB/sec).
This data reflects the data transfer rate, not the link capacity. Converting this data to bandwidth can be problematic because more bits are actually transferred than this value. This program shows that 16,777,216 bytes were transferred in 18.35 seconds, but this is just the data. The Ethernet message encapsulation also includes TCP, IP, and Ethernet message headers, which need to be added when estimating capacity.
Low throughput usually means congestion, but not always. Throughput can also depend on configuration issues, such as the TCP window size of the connection. If the window size is insufficient, performance can be severely affected.