Background
In this case study of packet loss troubleshooting, a network video app could not be accessed via mobile Wi-Fi or data traffic, although it worked fine with telecom traffic. Initially, it seemed that the video service was being blocked by the mobile operator. However, upon analyzing the packet tracking data, it became clear that packet loss was the primary issue. This article explores the steps taken to diagnose and resolve the issue through detailed packet loss troubleshooting.
Ok, I blamed you wrongly this time, move~ I will simply record the troubleshooting process.
Packet Loss Troubleshooting: Problem Overview
telecommunications
The basic information of a normal packet trace file (TV-01.pcapng) is as follows. The trace file is captured by Wireshark on Windows. The number of packets is 1633 and the average rate is 776 kbps.
$ capinfos TV-01.pcapng
File name:           TV-01.pcapng
File type:           Wireshark/... - pcapng
File encapsulation:  Ethernet
File timestamp precision:  microseconds (6)
Packet size limit:   file hdr: (not set)
Number of packets:   1633
File size:           1556 kB
Data size:           1502 kB
Capture duration:    15.493249 seconds
First packet time:   2022-04-18 18:16:51.016785
Last packet time:    2022-04-18 18:17:06.510034
Data byte rate:      97 kBps
Data bit rate:       776 kbps
Average packet size: 920.37 bytes
Average packet rate: 105 packets/s
SHA256:              1b7e316c0c85084fcd5260bf514f4f68835f4c9d585499a4f815c2db00b9b0a0
RIPEMD160:           c439e8e92cbb016269267561734bd55dcda9b5cd
SHA1:                2299414bd2642647d0fb1ad2701a7370e648b1f0
Strict time order:   True
Capture hardware:           Intel(R) Core(TM) i3-3110M CPU @ 2.40GHz (with SSE4.2)
Capture oper-sys:    64-bit Windows 7 Service Pack 1, build 7601
Capture application: Dumpcap (Wireshark) 3.2.18 (v3.2.18-0-gddf8072b7671)
Number of interfaces in file: 1
Interface #0 info:
                     Name = \Device\NPF_{7861B556-A3C3-4557-AD97-65E9E8B3A8DC}
                     Description = Wireless network connection
                     Encapsulation = Ethernet (1 - ether)
                     Capture length = 262144
                     Time precision = microseconds (6)
                     Time ticks per second = 1000000
                     Time resolution = 0x06
                     Operating system = 64-bit Windows 7 Service Pack 1, build 7601
                     Number of stat entries = 1
                     Number of packets = 1633
move
The basic information of the abnormal data packet trace file (TV-02.pcapng) is as follows. The trace file is also captured by Wireshark on Windows. The number of packets is 803, and the average rate is only 97 kbps. Compared with China Telecom, it is indeed abnormal and basically matches the 0.0kb/s problem phenomenon displayed by the video APP playback.
$ capinfos TV-02.pcapng
File name:           TV-02.pcapng
File type:           Wireshark/... - pcapng
File encapsulation:  Ethernet
File timestamp precision:  microseconds (6)
Packet size limit:   file hdr: (not set)
Number of packets:   803
File size:           489 kB
Data size:           461 kB
Capture duration:    37.704609 seconds
First packet time:   2022-04-18 17:53:51.743014
Last packet time:    2022-04-18 17:54:29.447623
Data byte rate:      12 kBps
Data bit rate:       97 kbps
Average packet size: 574.81 bytes
Average packet rate: 21 packets/s
SHA256:              5abadf00874c27d191feb9f84772867ed1b94a7a71e8295727fc4e5ee201bd02
RIPEMD160:           35a619df088164fadc413d4d223df30f9899e6f3
SHA1:                a41044db201276a7b1a2cb6dfd9545bc7848d9a4
Strict time order:   True
Capture hardware:           Intel(R) Core(TM) i3-3110M CPU @ 2.40GHz (with SSE4.2)
Capture oper-sys:    64-bit Windows 7 Service Pack 1, build 7601
Capture application: Dumpcap (Wireshark) 3.2.18 (v3.2.18-0-gddf8072b7671)
Number of interfaces in file: 1
Interface #0 info:
                     Name = \Device\NPF_{7861B556-A3C3-4557-AD97-65E9E8B3A8DC}
                     Description = Wireless network connection
                     Encapsulation = Ethernet (1 - ether)
                     Capture length = 262144
                     Time precision = microseconds (6)
                     Time ticks per second = 1000000
                     Time resolution = 0x06
                     Operating system = 64-bit Windows 7 Service Pack 1, build 7601
                     Number of stat entries = 1
                     Number of packets = 803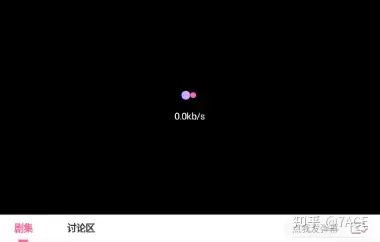
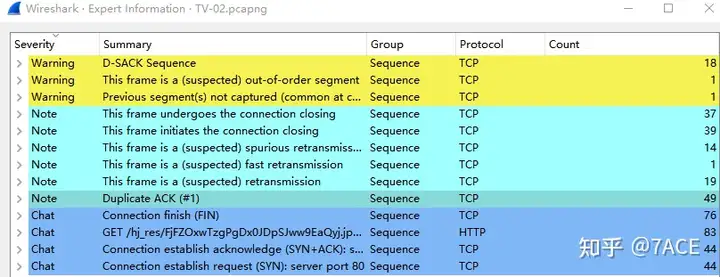
A simple browse of the expert information shows that there are some out-of-order, retransmission and fast retransmission phenomena.
Identifying Packet Loss in Mobile Data Traffic
telecommunications
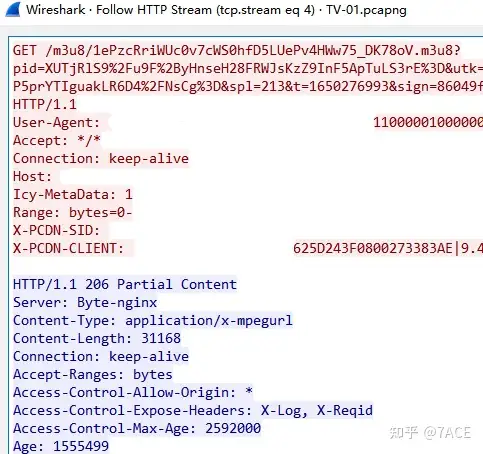
Entering the actual data packet analysis, we first start with normal telecommunications, where TCP Stream 4 is basically normal, including the TCP three-way handshake, client GET request, server HTTP 206 response, and video data transmission.

move
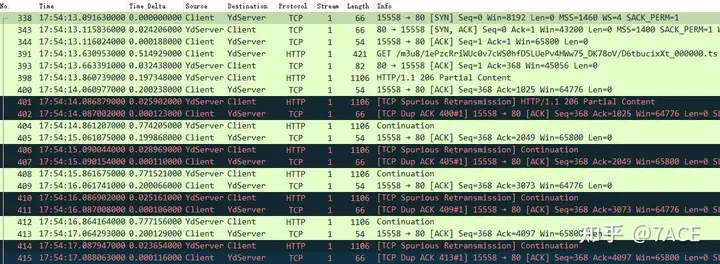
In the abnormal mobile data packets, some TCP streams have obvious suspected retransmission phenomenon. The following takes Stream 1 as an example to illustrate
The fundamental analysis is as follows:
- The capture was performed on the client, because the packet length was only 54 bytes and was not padded to the minimum standard Ethernet frame length of 60 bytes before entering the network card for transmission;
- TCP three-way handshake, including MSS 1400, SACK support, etc.
- TCP suspected retransmission, packets with a length of 1106 bytes are repeatedly suspected of retransmission and DUP ACK problem phenomenon;
- The IRTT time is about 24ms.
What is it ? Actually, this is a correlation analysisTCP Spurious Retransmission of the context data packet by Wireshark . To put it simply, I saw a TCP segment in the front and also saw the confirmation of this segment. One round trip has completed an interaction, but then I saw the same TCP segment again. To me, it is a suspected retransmission, which will naturally trigger the generation of a DUP ACK.
When Nagle meets delayed ACK
In fact, this problem is a very classic problem when Nagle encounters delayed ACKproblem. The following will not elaborate on the Nagle algorithm and delayed ACK, but quote some online materials:
Nagle’s Algorithm
if there is new data to send
  if the window size >= MSS and available data is >= MSS
    send complete MSS segment now
  else
    if there is unconfirmed data still in the pipe
      enqueue data in the buffer until an acknowledge is received
    else
      send data immediately
    end if
  end if
end if
Specific steps:
- If the content to be sent is greater than or equal to 1 MSS, it will be sent immediately;
- If there is no packet that has not been ACKed before, send it immediately;
- If there is a packet that has not been ACKed before, cache the sent content;
- If an ACK is received, the buffered contents are sent immediately.
Delayed ACK
TCP Delayed ACK (delayed confirmation) In an effort to improve network performance, it combines several ACK response groups into a single response, or sends the ACK response together with the response data to the other party, thereby reducing protocol overhead.
Specific steps:
- When there is response data to be sent, ACK will be sent to the other party immediately along with the response data;
- If there is no response data, the ACK will be sent delayed to wait and see if there is response data to send together;
- If the other party’s second data packet arrives while waiting to send ACK, ACK should be sent immediately. However, if the other party’s three data packets arrive one after another, whether to send ACK immediately when the third data segment arrives depends on the above two conditions.
Nagle Algorithm and Delayed ACK
Back to the practical issues of mobility
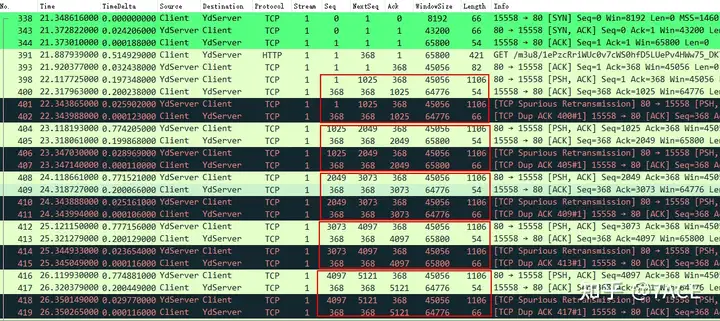
Client and YdServer perform data transmission: YdServer runs Naglethe algorithm, and Client runs Delayed ACKthe algorithm. If YdServer sends a data packet No.398 to Client , Client Delayed ACKwill not respond immediately due to . YdServer uses Naglethe algorithm, and YdServer will wait for the ACK from Client. If ACK does not come, it will not send the second data packet. Then the request will be delayed for 200ms. Then Client sends No.400 ACK, and YdServer does not receive the confirmation, so it performs No.401 timeout retransmission. Therefore, the client local packet capture determines that it is suspected retransmission, and Client triggers No.402 DUP ACK. After that, the four packets such as No.398, No.400-No.402 are repeated as a similar pattern.
After repeating No.602 and No.612, this pattern suddenly disappeared. Why? Because RTO is dynamically adjusted and increased, after No.612 ACK is returned to YdServer, YdServer has not had time to time out and retransmit. However, due to this abnormal problem, the entire interaction causes slow data transmission, making the APP unable to be used normally, and the page displays 0.0kb/s.

Summary of the problem
The YdServer in question is actually a CDN mobile node server. The problem was reported to the application side, and the CDN node was subsequently rescheduled to restore to normal. Therefore, in some application scenarios, please do not use the Nagle algorithm and delayed ACK together


