During a critical production issue, the senior developer quickly isolated the malfunctioning container and began investigating the root cause. Utilizing the nsenter command, she entered the namespace of the target container to run specific diagnostics and commands. With her adept use of Linux tools, she monitored performance metrics and analyzed logs effectively. Her expertise with tools like nsenter allowed the team to resolve the issue in record time.
1. Introduction to Nsenter Command
nsenter is in the util-linux package, which is installed by default in most common Linux distributions. If your system does not have it installed, you can install it using the following command:
yum install util-linux
A typical use is to enter the network namespace of the container. Usually, in order to be lightweight, most containers do not contain basic network management and debugging tools, such as ip, ping, telnet, ss, tcpdump and other commands, which brings considerable trouble to debugging the network in the container.
The nsenter command can easily enter the network namespace of the specified container and use the host’s commands to debug the container network. In addition, nsenter can also enter the mnt, uts, ipc, pid, user and other namespaces, as well as specify the root directory and working directory.
1.1 Use
The command parameters are as follows:
nsenter [options] [program [arguments]]
1.1.1 Options
-a, –all enter all namespaces of the target process by the default /proc/[pid]/ns/* namespace paths.
-m, –mount[=]: Enter the mount command space. If file is specified, enter the file’s namespace
-u, –uts[=]: Enter the UTS namespace. If file is specified, enter the file’s namespace
-i, –ipc[=]: Enter the System V IPC namespace. If file is specified, enter the file’s namespace
-n, –net[=]: Enter the net namespace. If file is specified, enter the file’s namespace
-p, –pid[=]: Enter the pid namespace. If file is specified, enter the file’s namespace
-U, –user[=]: Enter the user namespace. If file is specified, enter the namespace of file
-t, –target # Specify the pid of the target process to be entered into the namespace
-G, –setgid gid: Set the GID of the running program
-S, –setuid uid: Set the UID of the running program
-r, –root[=directory]: Set the root directory
-w, –wd[=directory]: Set the working directory
1.1.2 Common parameters
$ nsenter -a -t
$ nsenter -m -u -i -n -p -t
2. Common Nsenter Command Options Explained
By giving an example of how to capture packets in a container in a real k8s environment
2.1. Get the container ID
Enter the coredns container to capture packets
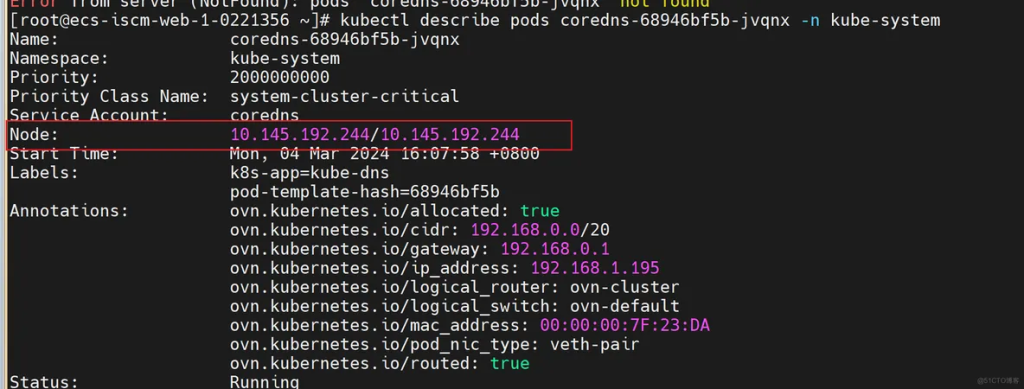
kubectl describe pods coredns-68946bf5b-jvqnx -n kube-system
containerd runtime output snippet

Controlled By: ReplicaSet/coredns-68946bf5b
Containers:
coredns:
Container ID: containerd://28e21dcef060893cef07f4c109aaee7813e0d18d83b2c2566db818ab122f900c
Docker runtime output snippet
Controlled By: ReplicaSet/coredns-68946bf5b
Containers:
coredns:
Container ID: docker://28e21dcef060893cef07f4c109aaee7813e0d18d83b2c2566db818ab122f900c
2.2. Get PID
After getting the container id, we log in to the node where the pod is located to obtain its main process pid.
First determine which node the pod is running on

Log in to the node
When containerd is running, use the crictl command to obtain:
crictl inspect 28e21dcef060893cef07f4c109aaee7813e0d18d83b2c2566db818ab122f900c | grep -i pid
#Output “pid”: 4605,
“pid”: 1
“type”: “pid”
The pid found is 4605
When dockerd is running, use the docker command to get:
$ docker inspect e64939086488a9302821566b0c1f193b755c805f5ff5370d5ce5e6f154ffc648 | grep -i pid
#Output
	    "Pid": 910351,
            "PidMode": "",
            "PidsLimit": 0,
3. Enter the container’s netns
nsenter -n -t 4605
After successfully entering the container’s netns, you can use the network tools on the node to debug the network. First, you can use it ip a to verify whether the IP address is the pod IP:

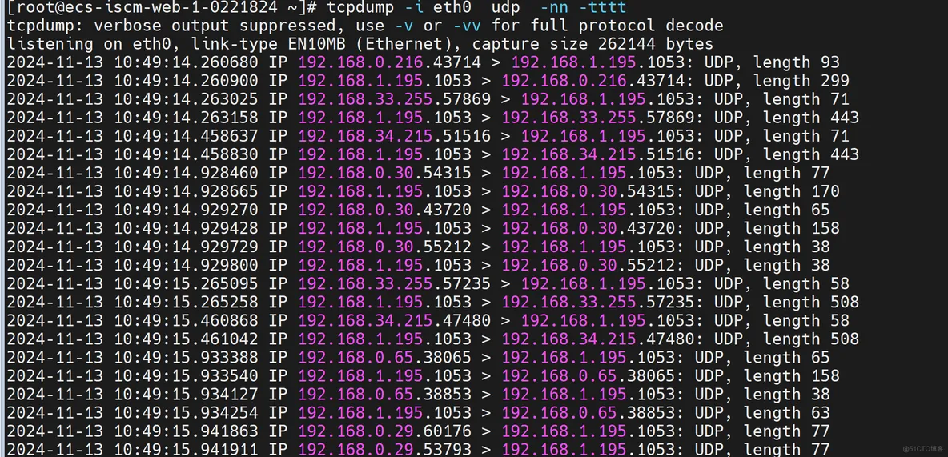
At this point, you have entered the container space. If you need to capture packets, you can use the packet capture tool on the node.
4. Tcpdump capture
Commonly used capture packets
Display the captured packet content in real time on the console
tcpdump -i eth0 host 10.0.0.10 -nn -tttt
tcpdump -i any host 10.0.0.10 -nn -tttt
tcpdump -i any host 10.0.0.10 and port 8088 -nn -tttt
Save the captured packet to a file
tcpdump -i eth0 -w test.pcap
Read the captured packet content
tcpdump -r test.pcap -nn -tttt

-r: Specify the package file.
-nn: Display numeric IP and port numbers without converting them to names.
-tttt: Display timestamp format: 2006-01-02 15:04:05.999999.
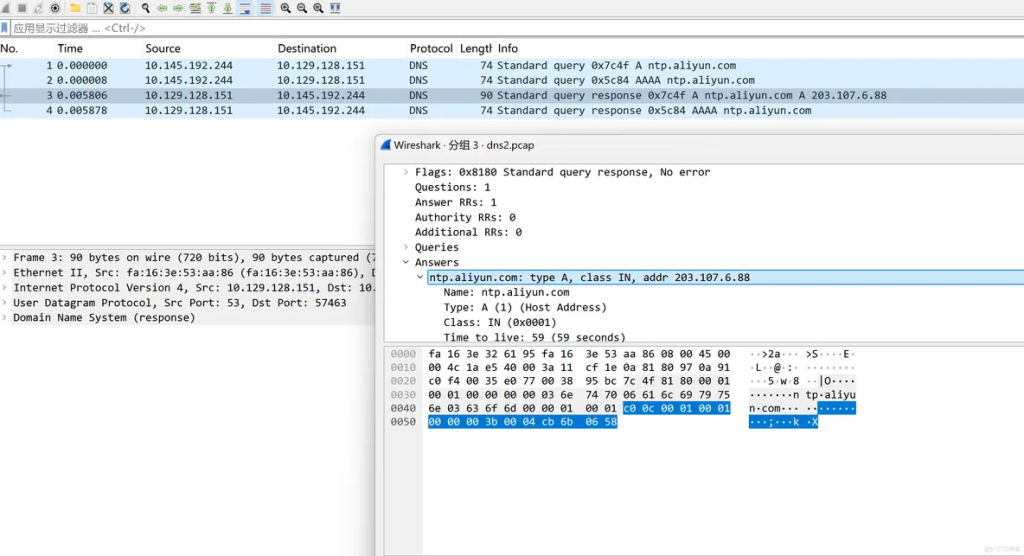
After capturing the packet, analyze it through wireshark

Summarize
If you do not need to enter the container, you can directly use tcpdum -i to specify the physical network card or virtual network card of the node to capture packets.
The normal network troubleshooting method is to capture the physical network card on the node once and the virtual network card on the container once. By comparing the two, you can determine whether there is an abnormality when the network traffic enters the container


