

As widely known, Kafka is an open-source distributed event streaming platform, renowned for its high throughput and low latency. It has been employed by thousands of enterprises for high-performance data pipelines, stream analytics, data integration, and core business applications.

In actual production environments, due to the varying network conditions of each site, it’s common to encounter performance issues with Kafka production or consumption as reported by businesses. Generally, one must check the Kafka service status, host resources, application logs, Broker logs, etc., on-site. If no anomalies are found, then it becomes necessary to use packet capturing tools to investigate the network environment in depth. This article summarizes a comprehensive packet capture analysis case and describes the ingenious application of packet capture tools based on real-world scenarios.
To accomplish tasks efficiently, the right tools are essential. For network problems, packet capture tool tcpdump and graphical analysis tool Wireshark must be arranged.
1. Introduction to tcpdump
Used for capturing data packets on Linux servers. If not installed, it needs to be installed as follows:
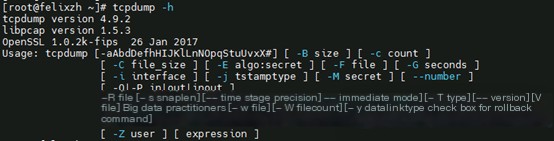
Common usage is as follows:
2. Usage of Wireshark
Used for graphically analyzing data packets captured by tcpdump. If not installed, it needs to be installed.
Note: The latest version requires the WIN10 operating system. The download address is:

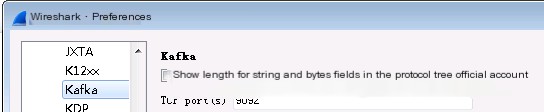
Wireshark supports the Kafka protocol: Edit -> Preferences -> Protocols -> Kafka, as below:
Kafka version 3.7.0. To facilitate testing, a Producer tool has been developed and uploaded to GitHub:
Supports specifying message size, total number of messages, message sending method, all producer parameters.
Step 1: Start Kafka 3.7.0, create a test topic

Step 2: Start tcpdump to begin packet capturing
The above command listens to network card eth0, hostname felixzh1, port 9092 packets.
Step 3: Configure related parameters in idea conf.properties, start the Main method

Version 3.7.0 logs provide INFO level prompt messages: Node 0 disconnected. However, some older versions do not provide such information, only some DEBUG level information. Such prompts can easily be overlooked by inexperienced individuals!
Step 4: ctrl+c to stop tcpdump, use Wireshark to analyze the data packet file res.cap
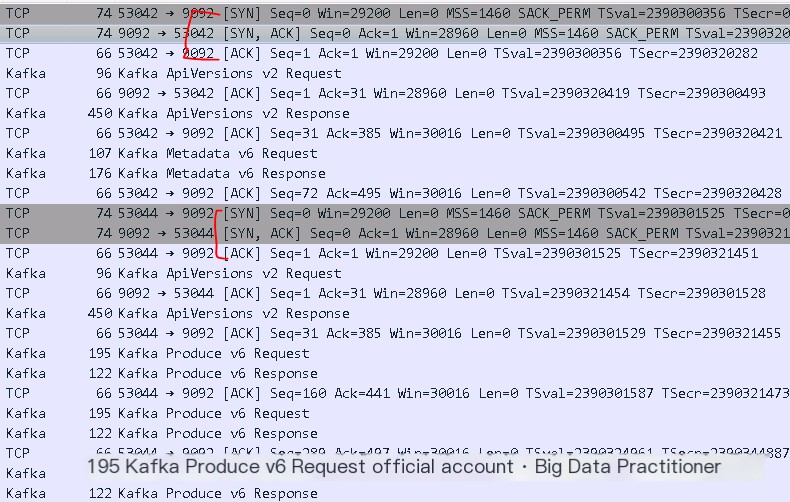
The process of establishing a connection via the TCP three-way handshake can be seen as follows:

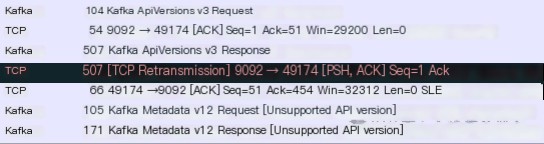
The process of ApiVersions request and Metadata request can be seen as follows:
Finally, after the client sends a Produce request, Kafka immediately triggers a four-way handshake to close the connection, as below:
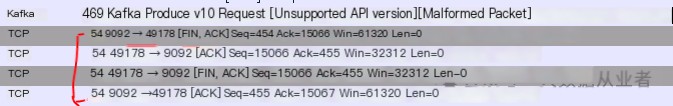
Thus, it is evident that Kafka actively closed the connection to the Produce endpoint.
Upon closely examining Kafka logs, insights can be found in the INFO logs, as follows:
These logs correspond to the source code, indicating that the Kafka server indeed closes the connection. From the source code perspective, even if acks=0, Kafka is likely to throw an exception for the Produce request.
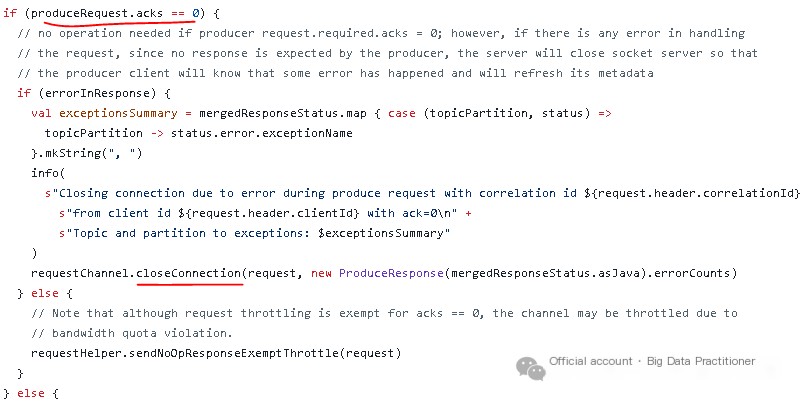
The occurrence of a RecordBatchTooLargeException on the server side is due to the data size conveyed by the Produce request exceeding the server’s configured message.max.bytes.

This completes a complete real-world case of using packet capture tools to troubleshoot network issues!
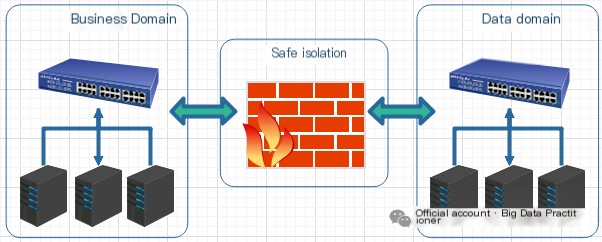
The above case practice is relatively simple. This section provides a detailed description of the crucial role of packet capture tools through a complex real-world case. A certain police bureau in a city reported that the business department’s Kafka cluster performance was poor, and part of the networking architecture was similar to the following diagram:
The business department captured packets on the Produce client and discovered numerous RST packets received. They believed that Kafka server anomalies led to the frequent closing of TCP connections, resulting in new connections needing to be established for each data transmission, causing significant performance overhead and reduced write performance. As follows:
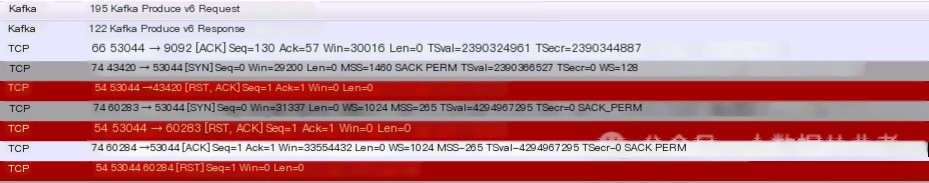
Explanation: Without a physical firewall on hand, we used nmap to simulate closing TCP connections for testing, with commands as follows:
On-site investigation of Kafka service status, host resources, application logs, and Broker logs revealed no anomalies. So, what can be done? A straightforward solution: capture packets on the server side too and analyze them, to confront the issue face to face.
Kafka server data packets showed that numerous three-way handshakes indeed triggered TCP connections. However, the server did not send any RST packets (abnormal reset) or FIN packets (normal closure), as follows:
Ultimately, the issue focused on the firewall. The firewall manufacturer’s investigation revealed that the TCP idle time was set too low!
In fact, the Kafka server has an idle TCP connection timeout mechanism, with timeout parameters as follows:
The Linux operating system also has a timeout mechanism for idle TCP connections, with parameters as follows:
Using packet capture tool tcpdump and graphical analysis tool Wireshark makes it very convenient to troubleshoot on-site network issues!