TCP conversation analysis is a very advanced and important feature of Unicorn. TCP (Transmission Control Protocol), designed as a reliable and connection-oriented protocol, uses acknowledgement to ensure every single bit is delivered to the receiver. We can use some of its features in network analysis, especially for network slow response troubleshooting to analyze TCP transaction pattern, then we can learn the following information:
- How to exchange data between the client and server?
- Which one causes the slow response, the server, client or the network itself?
- Is there any packet loss or retransmission?
- What’s the meaning of each request?
TCP packets are base of network analysis and network troubleshooting, they reveal useful information to help us troubleshoot slow network, especially for the cases like slow website response, slow database transactions and slow downloading or uploading, etc. To resolve a slow network issue, first, we should figure out which one causes the slowdown, the client, the server or the network itself? The TCP Conversation Analysis window of Unicorn provides details on how many requests and responses between the client and server, what’s the time delay in each transaction and how much data they carry.
Show TCP Conversation Analysis Window
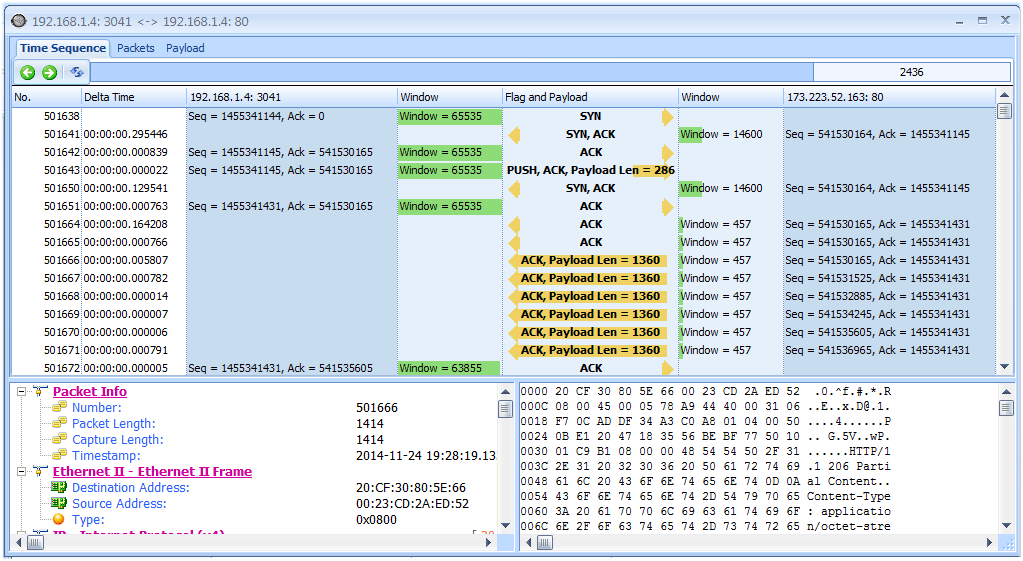
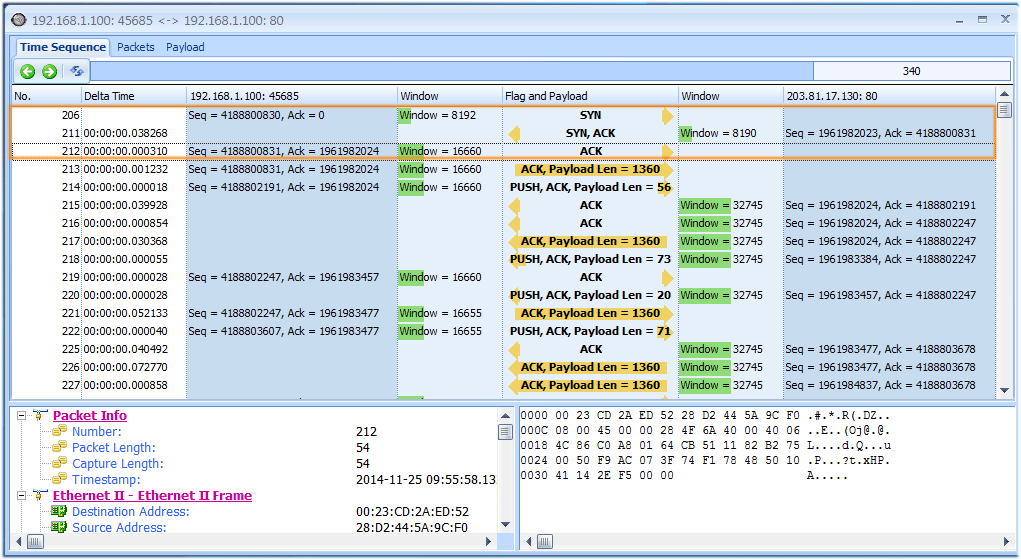
To show TCP conversation analysis window, we can double-click a TCP conversation in TCP conversation view. Its most important part is the Time Sequence tab whichshow many details. The arrows show how the packets bounce between the client and server, which make it easy to understand how the transactions go. We find the sequence number, acknowledge number, and it works out next sequence number out as well. And the delta time show how much time between each packet, so we can tell if the receiver responds quickly and which side is slow to response. Also we see how much data each transaction carries. We can diagnose app is busy via window size. All of them are shown on a diagram clearly (figure below).
Client/server/network, which one causes the slowdown?
In the Time Sequence tab, we can always start from three-way handshake, the first three packets (SYN, SYN-ACK and ACK packets) for connection setup. The SYN-ACK packet will tell us the delta time between the SYN and this packet and we know if the SYN packets gets to the server quickly and server responses effectively. For example, we capture at the client side, and we see the client sends a SYN to the server and the server takes 600ms or even 1s to respond (the delta time between the two), we know it’s not the client’s problem.
Then we know we should to figure out if it’s the network’s or server’s problem. If we capture on the server endpoint, we have opposite answer. So the delta time is useful to clear out who is not responsible for the slowdown. Also we need to focus on the retransmission packets. They are telling us the network is unstable and drops packets somewhere. Where? We aren’t sure, but we know it’s the network and it’s important to find out.


