Recently, I faced a Socket issue where an online service’s socket resources were continually maxing out. By using various tools to analyze the online problem, I identified the problematic code. Here’s a summary of the discovery and fix process.
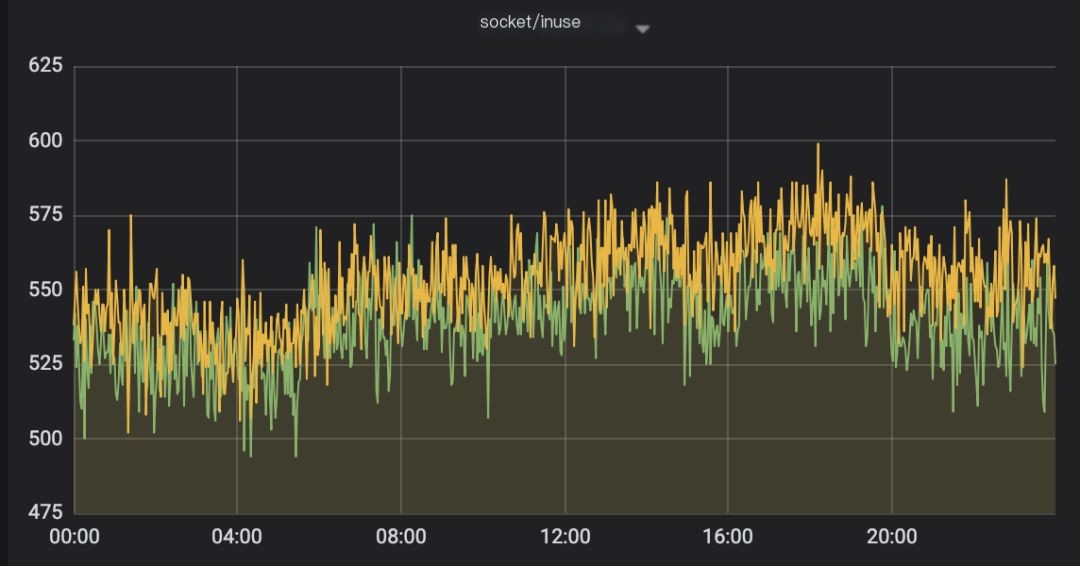
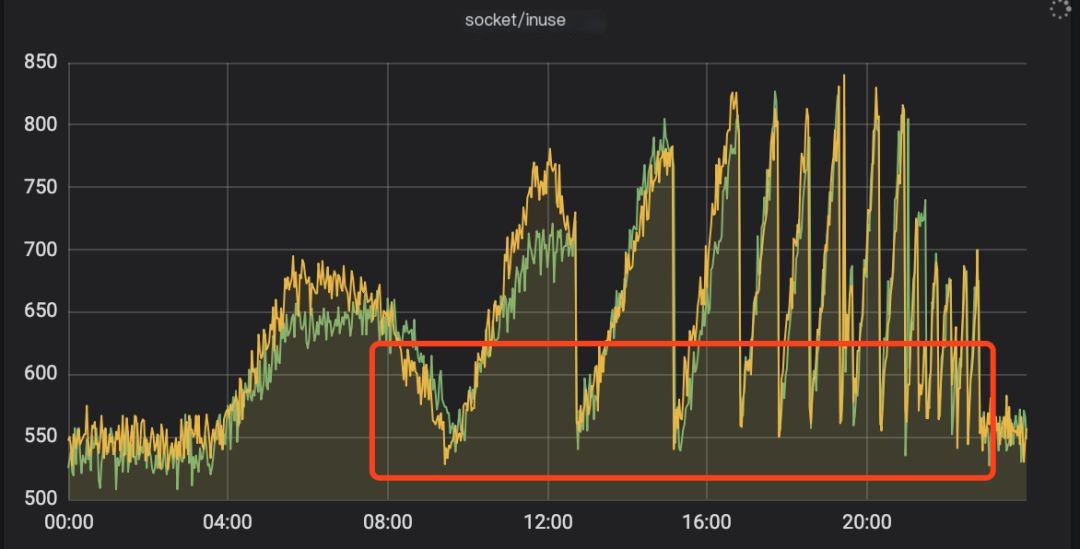
Let’s look at two graphs. One graph shows the socket status when the service is running normally, and, of course, the other shows the abnormal state!
 >
>
Figure 1: Monitoring when normal
 >
>
Figure 2: Monitoring when abnormal
Judging from the graphs, starting from 04:00, the socket resources kept increasing. After each restart, they returned to normal values but then continued to rise without releasing, and the interval between peak values kept getting shorter.
After restarting, I checked the logs and didn’t see any panic, so I didn’t investigate further, honestly believing the restart was effective.
Explanation of the Situation
This service is developed using Golang and has been running online for nearly a year, available for other services to call. The main underlying resources include DB/Redis/MQ.
To aid in future explanations, let’s go over the service architecture diagram.
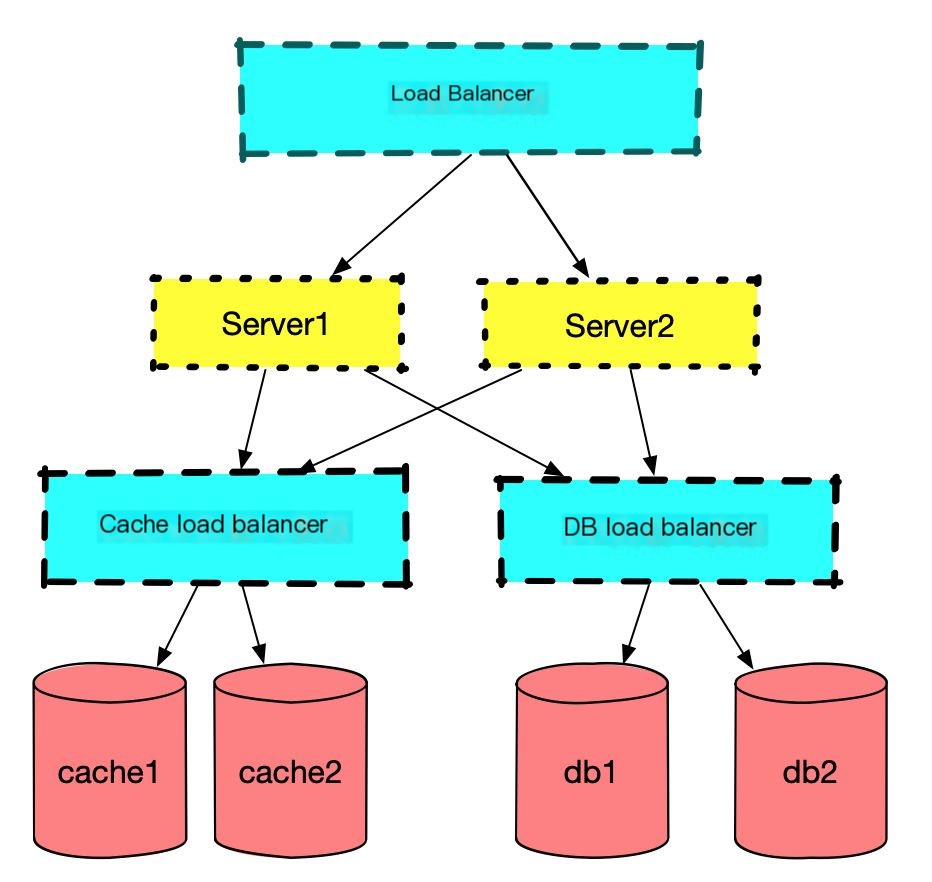
Figure 3: Service architecture
The architecture is extremely simple.
The issue began around 08:20 in the morning, with alerts reporting a 504 error for the service. My first reaction was that the service hadn’t been restarted for a long time (almost two months), possibly leading to some memory leaks. Without much thought, I decided to restart it immediately. As shown at the first trough in Figure 2, restarting restored service to normal (restarting is so useful, happy).
Around 14:00, I got another alert for a 504 error. I felt something was amiss, but since there was a major promotion event on that day, I quickly restarted the service again. An hour later, alerts started again, and after several restarts, the required restart interval kept getting shorter. At this point, I realized the problem was not simple. This time, a restart would not solve the problem. Therefore, I applied for machine permissions and began investigating the issue. All screenshots below are from my reproduced demo and unrelated to the online environment.
Problem Discovery
Upon encountering an issue, the first step is to analyze and hypothesize, then verify, and finally identify and modify. According to the situation at the time, I made the following assumptions.
Note: Subsequent screenshots are all from local reproductions.
Hypothesis 1
The socket resources were continuously maxed out, and since this had never happened before, I suspected if the service was overwhelmed by too many requests.
After checking the real-time QPS, I dismissed this idea. Although there was an increase, it was still within the server’s capacity (far below the benchmark value for stress testing).
Hypothesis 2
Failures on two machines occurred simultaneously. Restarting one alleviated the other, which is very unusual for independently deployed services in two clusters.
With this basis, I deduced that the underlying resources on which the service relies had issues, otherwise, it would be impossible for services in independent clusters to fail simultaneously.
Since monitoring indicated a socket issue, I used the netstat command to examine the current TCP connection status (my local tests, the online actual values were much larger).
Code language: javascriptCopy
/go/src/hello # netstat -na | awk '/^tcp/ {++S[$NF]} END {for(a in S) print a, S[a]}'LISTEN 2CLOSE_WAIT 23 # Highly abnormalTIME_WAIT 1Most connections were found in the CLOSE_WAIT state, which is unbelievable. I then checked with the netstat -an command.
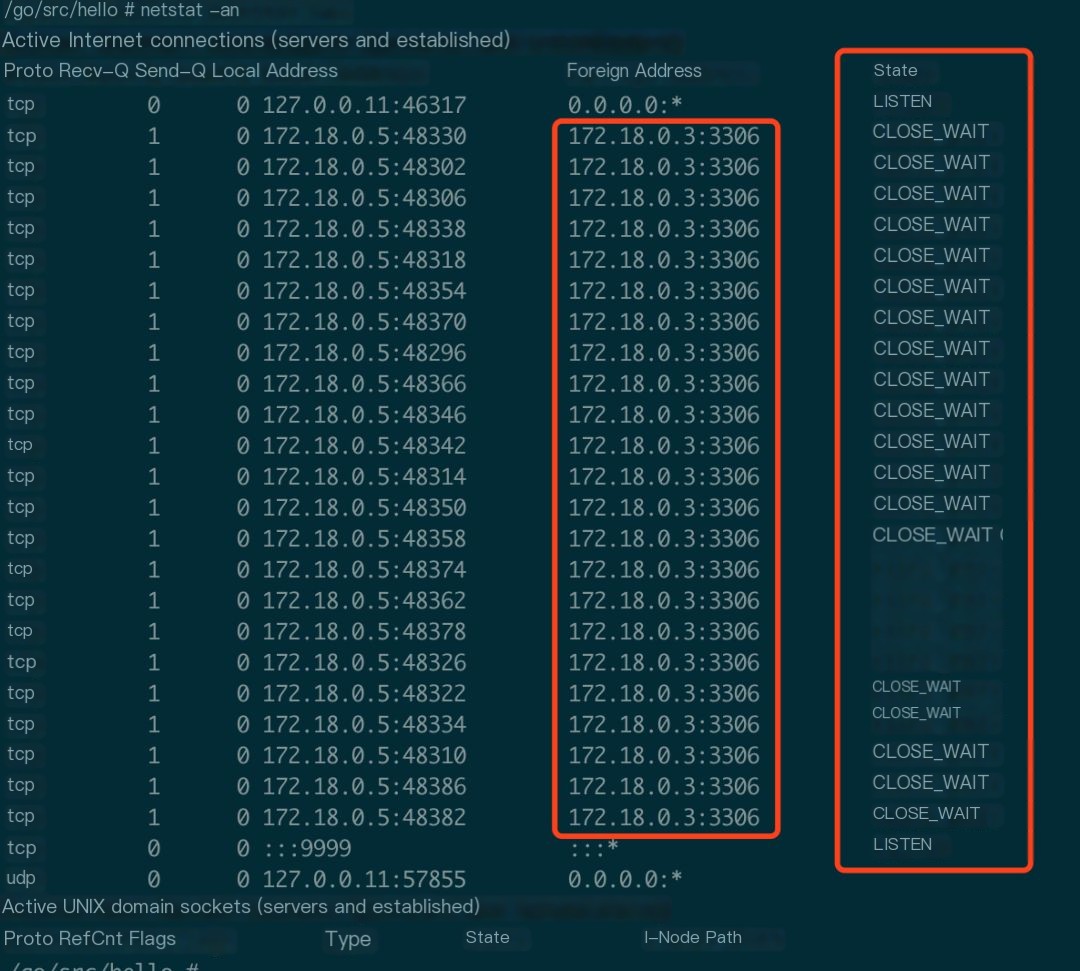
Figure 4: Large number of CLOSE_WAIT
CLOSED indicates a socket connection not being used. LISTENING indicates listening for incoming connections. SYN_SENT indicates an attempt to establish a connection. SYN_RECEIVED indicates initial connection synchronization. ESTABLISHED indicates an established connection. CLOSE_WAIT indicates the remote computer closed the connection, waiting for the socket connection to be closed. FIN_WAIT_1 indicates a closed socket connection, in the process of terminating the connection. CLOSING indicates closing the local socket connection first, then the remote socket connection, waiting for confirmation message last. LAST_ACK indicates waiting for an acknowledgment signal after the remote computer closes. FIN_WAIT_2 indicates waiting for the close signal from the remote computer after closing the socket connection. TIME_WAIT indicates waiting for the remote computer to resend the closing request after the connection closes.
Then, I began to focus on why there were so many MySQL connections in CLOSE_WAIT? To clarify, let’s interject some knowledge about TCP’s four-way handshake.
TCP Four-Way Handshake
Let’s look at how the TCP four-way handshake process unfolds:
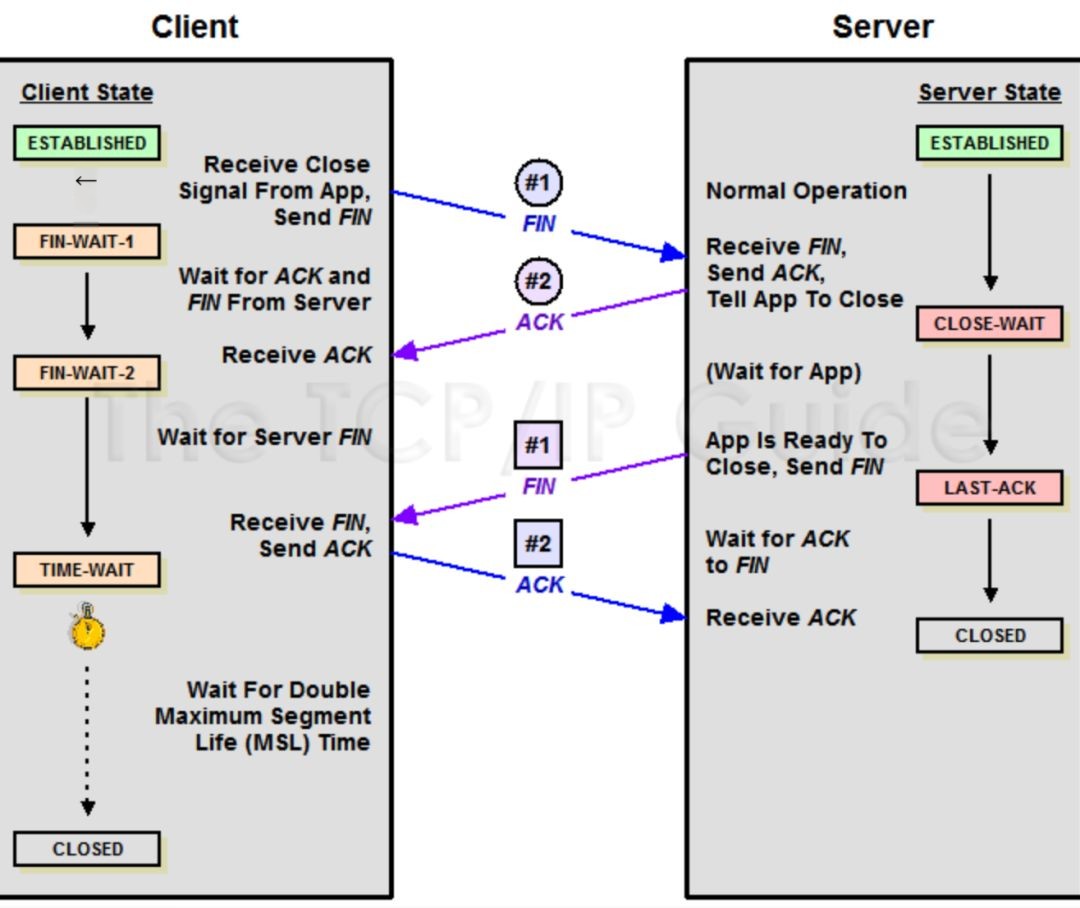
Figure 5: TCP Four-Way Handshake
In layman terms:
Client: Server, I'm done with my work, preparing to leave, here corresponds to the client sending a FIN
Server: Noted, but hold on, I have to wrap up, which corresponds to the server receiving the FIN and responding with ACK
After the above two steps, the server enters the CLOSE_WAIT state. After some time, the Server finishes cleaning up
Server: Brother, I'm done here, you can go, the server sends a FIN
Client: Goodbye, this is the client’s ACK to the server
At this point, the server can exit, but not the client. Why not? The client must still wait for 2MSL of time. Why can’t the client leave immediately? Mainly to prevent the server from not receiving the ACK and retransmitting the FIN asking again; if the client leaves immediately, there would be no one to respond when the server retransmits. The length of this waiting time is also crucial.
Maximum Segment Lifetime indicates the longest time a segment can exist in the network before being discarded
The important point is not to confuse the client/server in the diagram with the client-server in the project. Just remember: the side actively closing sends a FIN packet (Client), while the passively closing side (Server) responds with ACK packet, then enters the CLOSE_WAIT state. If everything proceeds correctly, the passively closing side will later send a FIN packet, then move to the LAST_ACK state.
In that case, let’s analyze TCP packets:
Code language: javascriptCopy
/go # tcpdump -n port 3306# Three-way handshake occurred11:38:15.679863 IP 172.18.0.5.38822 > 172.18.0.3.3306: Flags [S], seq 4065722321, win 29200, options [mss 1460,sackOK,TS val 2997352 ecr 0,nop,wscale 7], length 011:38:15.679923 IP 172.18.0.3.3306 > 172.18.0.5.38822: Flags [S.], seq 780487619, ack 4065722322, win 28960, options [mss 1460,sackOK,TS val 2997352 ecr 2997352,nop,wscale 7], length 011:38:15.679936 IP 172.18.0.5.38822 > 172.18.0.3.3306: Flags [.], ack 1, win 229, options [nop,nop,TS val 2997352 ecr 2997352], length 0# MySQL actively disconnects the link11:38:45.693382 IP 172.18.0.3.3306 > 172.18.0.5.38822: Flags [F.], seq 123, ack 144, win 227, options [nop,nop,TS val 3000355 ecr 2997359], length 0 # MySQL load balancer sends a FIN packet to me11:38:45.740958 IP 172.18.0.5.38822 > 172.18.0.3.3306: Flags [.], ack 124, win 229, options [nop,nop,TS val 3000360 ecr 3000355], length 0 # I reply with an ACK to it... ... # Normally, I would have to send a FIN to it, but I didn’t, leading to CLOSE_WAIT. Why is this?src > dst: flags data-seqno ack window urgent optionssrc > dst indicates the source address to destination address flags is the TCP packet’s flag information,S is SYN flag, F(FIN), P(PUSH), R(RST), “.” (no marked) data-seqno is the sequence number of data in the packet ack represents the next expected sequence number window is the reception buffer’s window size urgent indicates whether there’s a pointer to urgent data options are the options
Based on the above information, let me explain in words: The MySQL load balancer sends a FIN packet to my service, and I responded. At this point, I entered the CLOSE_WAIT state, but afterward, as the passive closer, I didn’t send a FIN, causing my server to remain in the CLOSE_WAIT state, unable to finally transition to the CLOSED state.
I surmise the possible causes for this situation are as follows:
- Load balancer exited unexpectedly,
which is essentially impossible, as its failure would trigger widespread service alerts, not just for my service - The MySQL load balancer timeout is set too short, causing the business code not to complete before the MySQL load balancer closes the TCP connection.
This is also unlikely, as there's no lengthy operation in this service. Nonetheless, I checked the load balancer configuration, which was set to 60 seconds. - Code issue, unable to release the MySQL connection
It currently seems to be a code quality issue, coupled with abnormal data this time, triggering a previously untested point. Currently, this seems very likely the reason
Tracing Error Cause
Since I didn’t write the business logic in the code, I worried it might take a while to spot the issue, so I directly used perf to map all call relationships using a flame graph. Since the earlier hypothesis was that the code didn’t release the MySQL connection, it could only be:
- No actual call to close
- Long operation (obvious in the flame graph), causing a timeout
- MySQL transaction not handled correctly, e.g., rollback or commit
Since the flame graph contains a lot of information, I folded some unnecessary details for clarity.
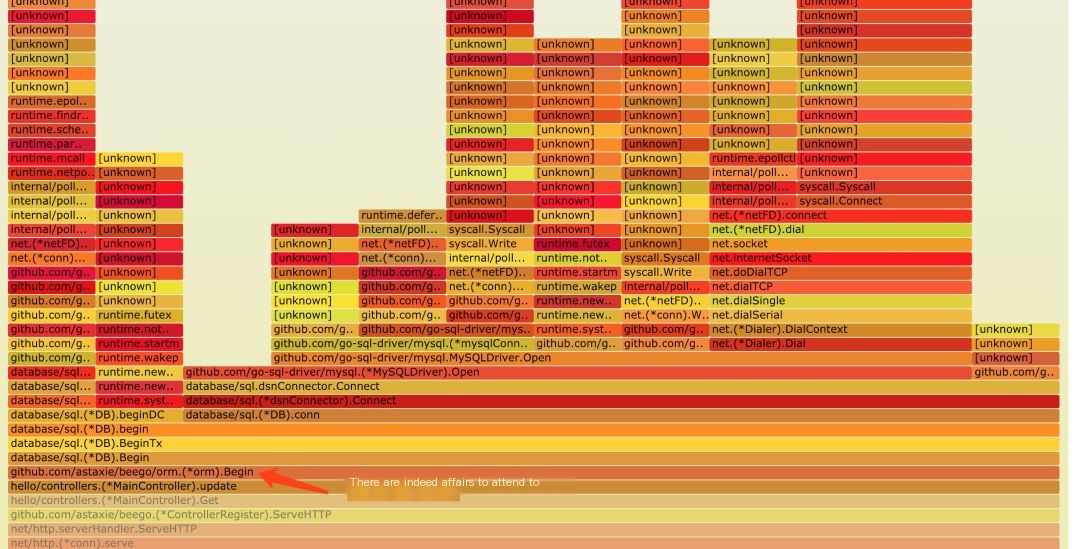
Figure 6: Faulty Flame Graph
The flame graph clearly shows the transaction started, but in the subsequent portion, there’s no Commit or Rollback operation. This will definitely cause issues. It also clearly shows the problem lies in:
MainController.update method inside, so let’s check the update method directly. The following code was found:
Code language: javascriptCopy
func (c *MainController) update() (flag bool) { o := orm.NewOrm() o.Using("default") o.Begin() nilMap := getMapNil() if nilMap == nil {// It only checks for nil without rollback or commit return false } nilMap[10] = 1 nilMap[20] = 2 if nilMap == nil && len(nilMap) == 0 { o.Rollback() return false } sql := "update tb_user set name=%s where id=%d" res, err := o.Raw(sql, "Bug", 2).Exec() if err == nil { num, _ := res.RowsAffected() fmt.Println("mysql row affected nums: ", num) o.Commit() return true } o.Rollback() return false}With that, the entire analysis concludes. Upon review, getMapNil returned nil, but the condition below didn’t trigger a rollback.
Code language: javascriptCopy
if nilMap == nil { o.Rollback()// Perform rollback here return false}Conclusion
Analyzing the entire process consumed considerable time. The main issue was a strong subjective bias – thinking how a service running for a year without issue suddenly fails? As a result, I initially doubted the SRE, DBA, and various infrastructure components (people always suspect others first), costing valuable time here.
Here’s a streamlined analytic approach:
- As soon as an issue occurs, the logs should be inspected immediately, indeed the logs didn’t reveal any problems;
- The monitoring prominently displayed a continuous socket increase, making it clear that using
netstatto check the situation to identify which process is to blame should be the next step; - According to the
netstatcheck, usetcpdumpto analyze why the connection passively disconnected (TCP knowledge is crucial); - If familiar with the code, inspect the business code directly; if not, use
perfto print out the code’s call chain; - Whether analyzing code or the flame graph, one should be able to quickly identify the problem by this point.
So, why did this scenario result in a CLOSE_WAIT? Most people might already understand, but I’ll recap simply:
Due to the absence of a transaction rollback on that line of code, the server did not actively initiate a close. Thus, when the MySQL load balancer reached 60 seconds, it triggered a close operation. However, the TCP packet capture showed that the server did not respond, as the transaction in the code wasn’t processed. This, in turn, resulted in a significant number of ports and connection resources being occupied. Here’s another look at the packet capture during the handshake:
Code language: javascriptCopy
# MySQL actively disconnects the link11:38:45.693382 IP 172.18.0.3.3306 > 172.18.0.5.38822: Flags [F.], seq 123, ack 144, win 227, options [nop,nop,TS val 3000355 ecr 2997359], length 0 # MySQL load balancer sends a FIN packet to me11:38:45.740958 IP 172.18.0.5.38822 > 172.18.0.3.3306: Flags [.], ack 124, win 229, options [nop,nop,TS val 3000360 ecr 3000355], length 0 # I reply with an ACK to itI hope this article proves helpful to those diagnosing online issues. To aid understanding, below is a comparison of the correct flame graph versus the erroneous one. Feel free to compare the two.
- Correct flame graph: https://dayutalk.cn/img/right.svg
- Faulty flame graph: https://dayutalk.cn/img/err.svg
An article I referenced posed two thought-provoking questions regarding this situation, which I find very meaningful. Consider these:
- Why does several hundred CLOSE_WAIT on one machine render it inaccessible? Don’t we often say a single machine has 65,535 file descriptors available?
- Why do I have a load balancer, yet machines for two deployed services exhibited nearly simultaneous CLOSE_WAIT?


