

Background
Slow application transmission is a common problem. Where and why is it slow? Sometimes it is difficult to answer clearly from the perspective of network packet analysis . After all, different technical directions are too professional, and full-stack masters can only look up to them. What we can do is to expand our knowledge as much as possible in addition to focusing on our own professional direction, learn to find the patterns of the problem, and propose possible solutions.
Just like this MQ case, to be honest, I know nothing about MQ, but it doesn’t mean we won’t know where to start after getting the relevant data packet trace files. We can always find ideas to solve the problem and find certain patterns.
The case is taken from SharkFest 2010 “Wireshark in the Large Enterprise”
Problem Information
The basic information of the trace file is as follows:
λ capinfos B2BXfer.pcap
File name:           B2BXfer.pcap
File type:           Wireshark/tcpdump/... - pcap
File encapsulation:  Ethernet
File timestamp precision:  microseconds (6)
Packet size limit:   file hdr: 8192 bytes
Packet size limit:   inferred: 55 bytes
Number of packets:   810
File size:           57 kB
Data size:           702 kB
Capture duration:    162.247000 seconds
First packet time:   2007-09-26 17:16:57.337002
Last packet time:    2007-09-26 17:19:39.584002
Data byte rate:      4332 bytes/s
Data bit rate:       34 kbps
Average packet size: 867.85 bytes
Average packet rate: 4 packets/s
SHA256:              dfbebcc56cd4a5ccfa42ed455daaa8e3ad4e21bcf91be01f5069afbb5271ee15
RIPEMD160:           aac286e82a30280f229055b711810f9c27809305
SHA1:                0d23af488435de254906ad7be75485d0ad8101e9
Strict time order:   True
Number of interfaces in file: 1
Interface #0 info:
                     Encapsulation = Ethernet (1 - ether)
                     Capture length = 8192
                     Time precision = microseconds (6)
                     Time ticks per second = 1000000
                     Number of stat entries = 0
                     Number of packets = 810
The trace file was captured by tcpdump on linux, with 810 packets, truncated to 55 bytes, 702k bytes of file data, 162.247 seconds of capture, and an average rate of 34k bps.
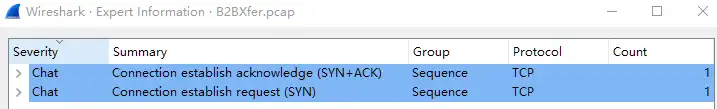
The expert information is as follows. It is unusually concise and contains no Warning-related information. This shows that the slow transmission problem is not caused by the common retransmission caused by packet loss.
Problem Analysis
The actual information of the expanded packet trace file is as follows:
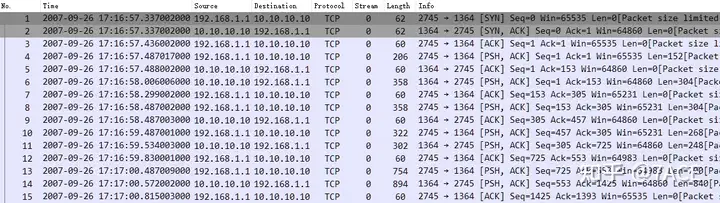
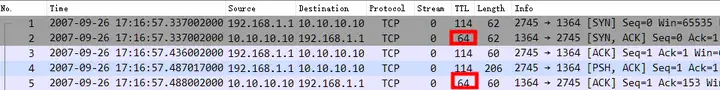
The first is the TCP three-way handshake, with an IRTT of about 0.099s. From TTL 64, we can see that the capture point is on the server or close to the server.
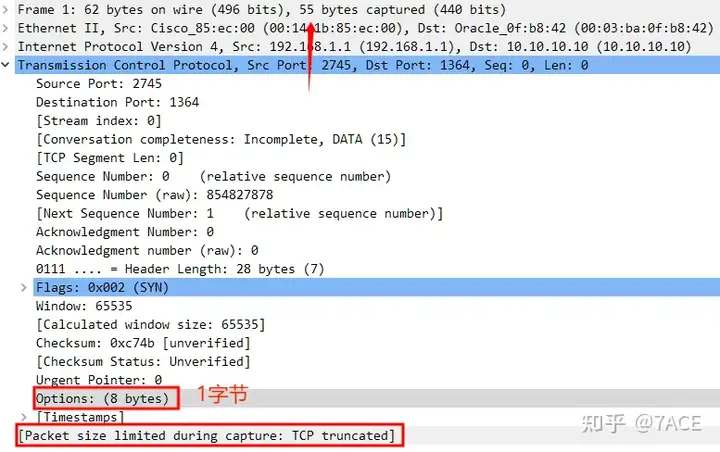
Because the data packet file is truncated to 55 bytes, the TCP Options field in the TCP SYN packet is actually only 1 byte, which is why each packet will display [Packet size limited during capture]. This setting can actually roughly determine that the slow transmission is not a problem such as the TCP window, such as the receive window is full.
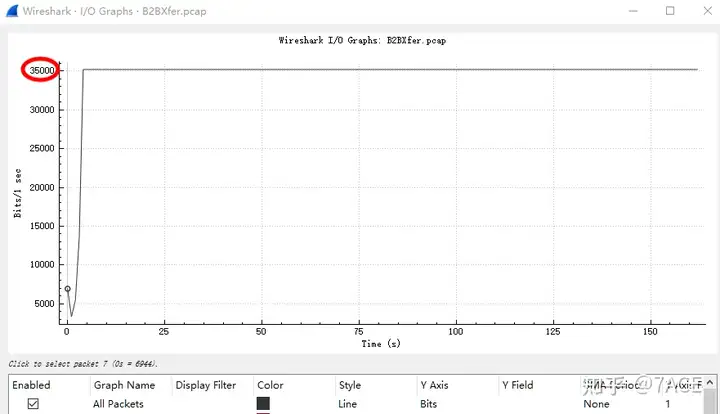
Since the transmission is slow, some graphical displays in the statistics will make it clearer. As shown below, the I/O graph shows that the transmission rate shows a straight horizontal line of about 35k bps after a certain period of time. This shows that the entire MQ transmission is interacting in an extremely regular way. There are also regularities for slowness. . .
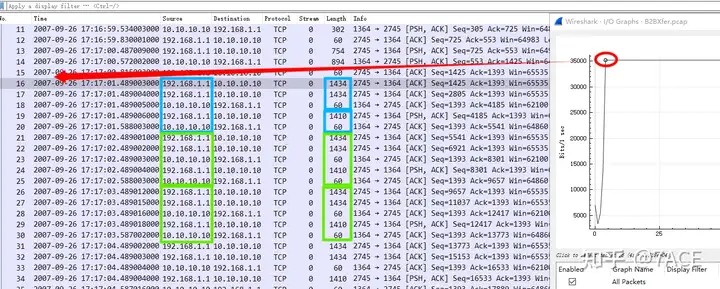
By clicking the scattered points in the I/O diagram, we can locate the transmission pattern starting from No.16 and analyze it as follows:
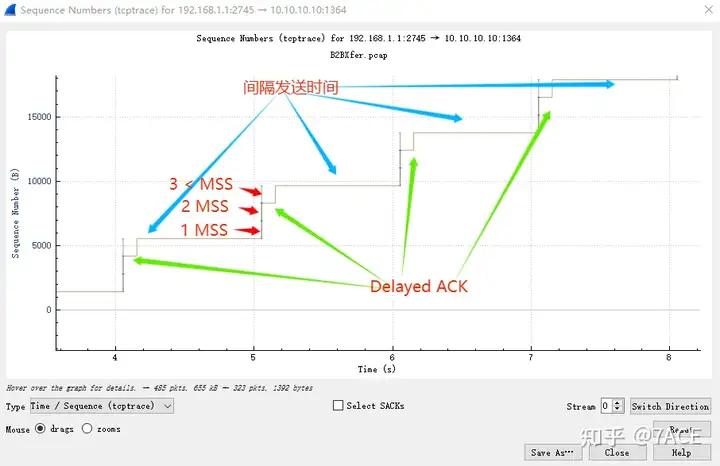
1. The client 192.168.1.1 sends three data segments at a time, with lengths of 1434, 1434, and 1410 respectively. It can be roughly determined that the MSS is 1380 (1434-54), so it is two MSS + a data segment marked with PSH (less than one MSS length);
2. After receiving two consecutive MSS data segments, the server 10.10.10.10 will immediately trigger an ACK confirmation, but after receiving the last PSH/ACK data segment, in the case of Delayed ACK, the confirmation is delayed by about 99ms ;
3. After the second ACK from the server is returned to the client, the client will wait for about 800ms (900ms – IRTT is about 100ms) before sending the next data segment (1434, 1434 and 1410), and this cycle repeats.
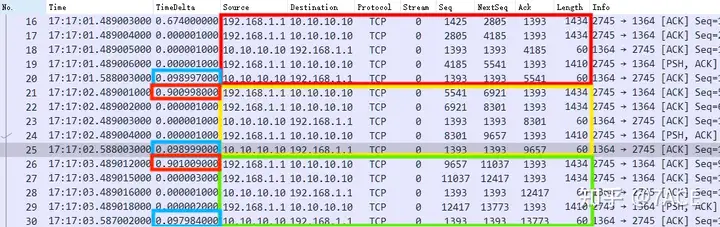
Therefore, in the entire data transmission interaction process, three rules can be seen:
- 2 MSS + 1 is less than MSS, and the data transmission pattern is fixed;
- Delay confirmation 99ms rule;
- Wait for 800ms interval to send regularly.
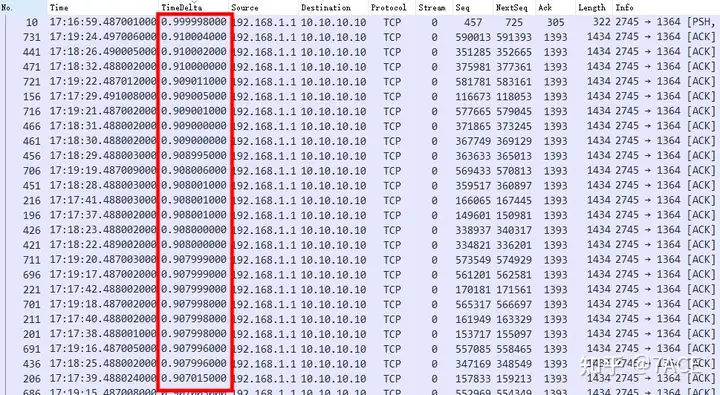
Don’t underestimate ms. If the transmission is like this for one transmission, it will be the same for every transmission. Over time, the overall transmission efficiency will naturally be quite low. By sorting the Delta Time from large to small, there are nearly 160 900+ms delays (the total number of data packets is only 810, nearly 20%).
Through the TCP Trace graph, it is easier to see the transmission rules of data packets. A picture is worth a thousand words .
Summary of the problem
In short, network packet analysis can clearly identify the problem of slow transmission and where it is slow. As for why the transmission pattern is like this (MQ sending), it still has to go back to the professional direction of MQ application. Again, it may not be possible to determine the root cause in the end, but network packet analysis can point us in the right direction.