

Background
A case from a friend, a certain customer reported that the computer application software was very slow to open, and provided a data packet file captured when it was slow and the server IP. As mentioned before, there are many phenomena of so-called slowness, and there are also many reasons. In the absence of more input conditions, how to judge and analyze a data packet capture file, including some personal habits or experiences, is simply recorded here.
Problem Information
The packet trace file information is mainly as follows:
λ capinfos 0918.pcapng
File name: 0918.pcapng
File type: Wireshark/... - pcapng
File encapsulation: Ethernet
File timestamp precision: microseconds (6)
Packet size limit: file hdr: (not set)
Number of packets: 8976
File size: 7217 kB
Data size: 6913 kB
Capture duration: 246.083460 seconds
First packet time: 2023-xx-xx 11:06:48.091668
Last packet time: 2023-xx-xx 11:10:54.175128
Data byte rate: 28 kBps
Data bit rate: 224 kbps
Average packet size: 770.19 bytes
Average packet rate: 36 packets/s
SHA256: xxxxx
RIPEMD160: xxx
SHA1: xxx
Strict time order: True
Capture hardware: Intel(R) Pentium(R) CPU G3260 xxx
Capture oper-sys: 64-bit Windows 7 Service Pack 1, build xxx
Capture application: Dumpcap (Wireshark) 3.0.0 (v3.0.0-0-g937e33de)
Number of interfaces in file: 1
Interface #0 info:
Name = \Device\NPF_xxxxx
Description = Local connection
Encapsulation = Ethernet (1 - ether)
Capture length = 262144
Time precision = microseconds (6)
Time ticks per second = 1000000
Time resolution = 0x06
Operating system = 64-bit Windows 7 Service Pack 1, build xxx
Number of stat entries = 1
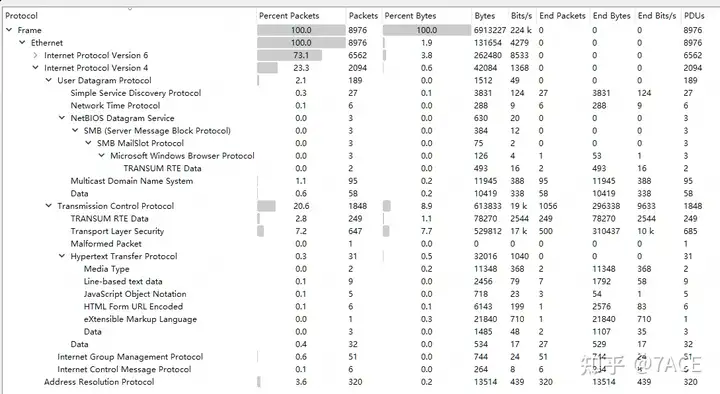
Number of packets = 8976The client is a Windows 7 64-bit system (quite old… the hardware is also old). The data packets were captured through Wireshark. The capture time was 246s, the number of data packets was 8976, the file size was 6913kB, and the average rate was about 224kbps. Overall, the rate was very low.
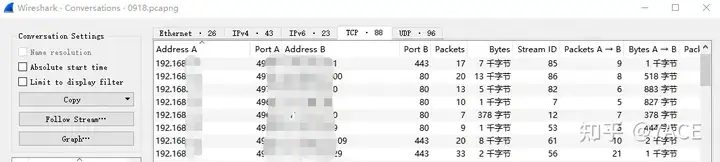
According to the Wireshark statistics function, we can pay attention to the protocol layering and session information. Among them, IPv6 accounts for 73.1% of the protocol, and TCP accounts for 20.6% of IPv4. Specifically for TCP communication sessions, we can see that the number of TCP sessions is 88, which is a lot.
As an aside, if the user does not provide the server IP, it is difficult to find the information you really want in these vast number of data packets. This also brings up a common topic: how to effectively capture and filter in complex client traffic situations.
I mentioned
complex client traffic before. Regarding the usage errors in capture, I said that invalid traffic needs to be avoided. As a server, it goes without saying that traffic comes more from actual business, while the client is more particular, more targeted at office computer client scenarios. In this case, due to the operation of multiple applications, a lot of invalid traffic will be generated, which will interfere with the later analysis. Although it can be filtered by displaying
filter expressions during analysis , it is better to maintain a pure fault test environment during capture, and turn off the programs that need to be turned off.
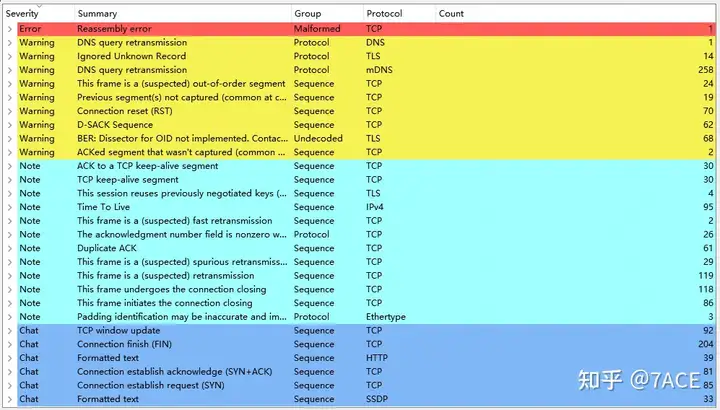
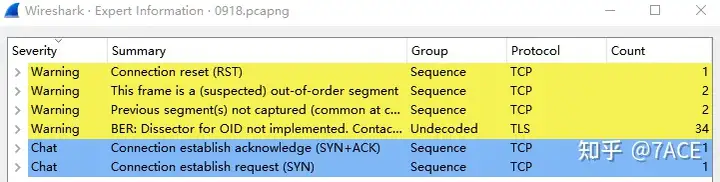
The same problem also exists in expert information. In the case of complex client traffic, expert information is extremely complicated and cannot assist in judgment and analysis.
Therefore, in the case of complex client traffic, the captured data packet file can filter out some data packets by displaying the filter expression. The format is similar, as shown below.
tcp
tcp or icmp or icmpv6

!(eth.dst.ig == 1) and !(arp or dns or ntp)
!(arp or stp or dns or ntp)
not arp && not stp && not dns
Problem Analysis
filter
Constructs a session IPv4 filter expression based on the provided server IP.
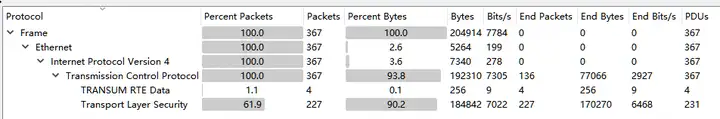
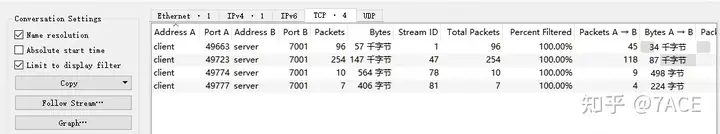
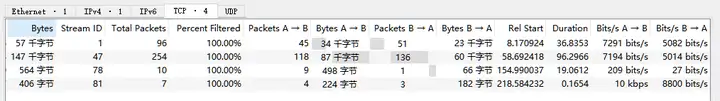
ip.addr eq 192.168.1.1 and ip.addr eq 100.1.1.1After such precise filtering, the protocol layer and session information in the statistics are reduced as follows: 367 TCP packets, 4 sessions for service port 7001, namely TCP Stream 1, 47, 78, and 81.
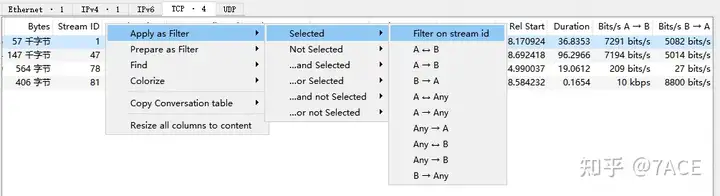
At this point, you can right-click on the session and filter by TCP Stream ID, which is generally known as tracking the stream, to see specifically what the problem is.
analyze
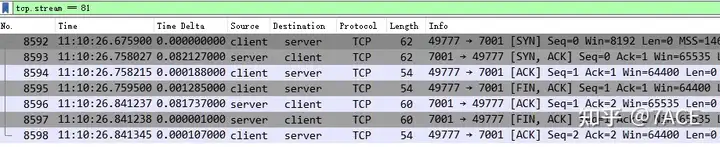
In the above statistics of TCP session, 4 TCP streams can be seen, among which the number of packets of Stream 78 and 81 are 10 and 7 respectively, which is obviously too small. It can be roughly estimated that there is no data transmission.
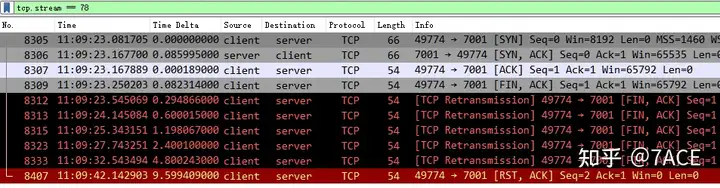
According to the TCP tracking flow, the specific data packets are indeed simple in composition, basically consisting of TCP three-way handshake and TCP four-way handshake phase data packets.
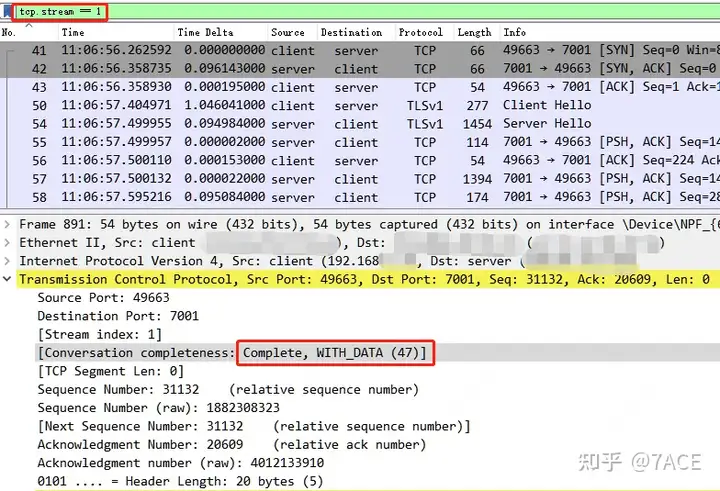
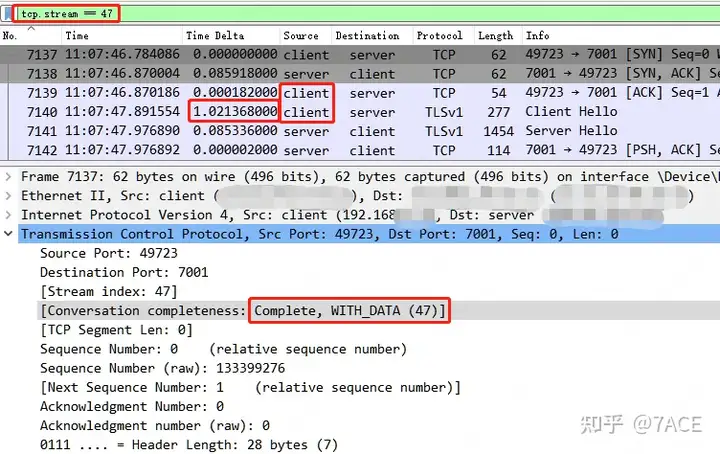
The remaining TCP Streams 1 and 47 are analyzed in turn. First, TCP Stream 1, where Packet Detailsthe TCP session integrity information in is Complete, WITH_DATA(47), which means that the value of the tcp.completeness field is 47, as follows:
- 1 : SYN
- 2 : SYN-ACK
- 4 : ACK
- 8 : DATA
- 16 : FIN
- 32 : RST
1 + 2 + 4 + 8 + 32 = 47 , which is the value of SYN + SYN-ACK + ACK + DATA + RST . This means that TCP Stream 1 is a complete TCP session with Data, from the TCP three-way handshake, to the intermediate data transmission, and then to the final TCP RST to end the connection. Although there is no FIN, which is a bit abrupt, it is not a big deal.
For an introduction to TCP session integrity analysis and how to use the display filter expression for tcp.completeness, see the previous article
“Wireshark Tips and Tricks | TCP Session Integrity Analysis”
Then you can take a quick look at the expert information to see if there are any error messages, but there is actually no special information.
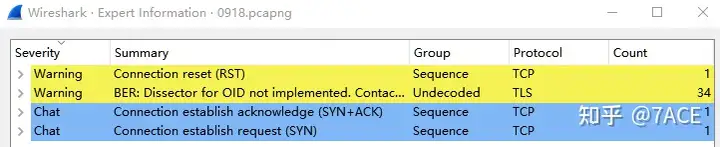
Because the feedback phenomenon is that the application is slow to use, generally speaking, a common situation is that the data packet is lost or timed out and retransmitted, and you will see timeout retransmission or fast retransmission, as well as other problems such as DUP ACK, etc. Since there is no similar phenomenon in the above expert information, you can add frame.time_delta_displayedinformation columns to assist in analysis and check if there are any special problems with the interval time of each data packet.
Note: 0.096143s is the time interval between No.42 SYN/ACK and No.41 SYN, that is, 0.358735 – 0.262592 = 0.096143.
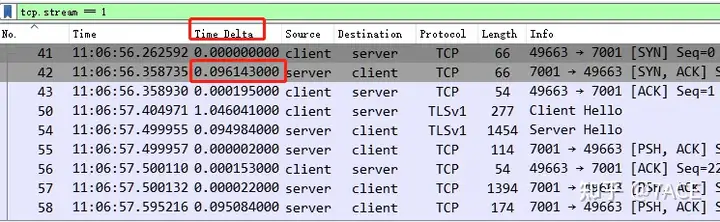
Click the Time Delta column and sort the data packets from size to size. The packets with the largest interval between adjacent packets will appear at the top.
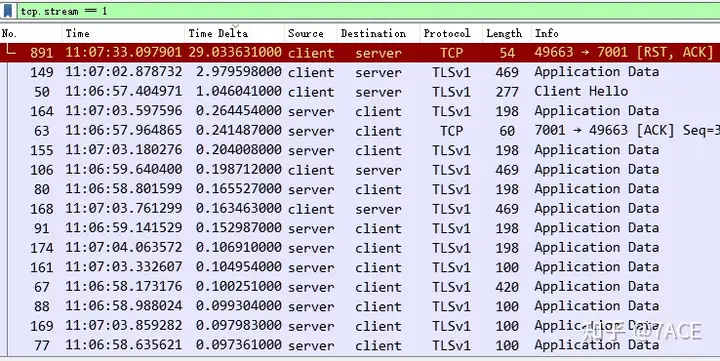
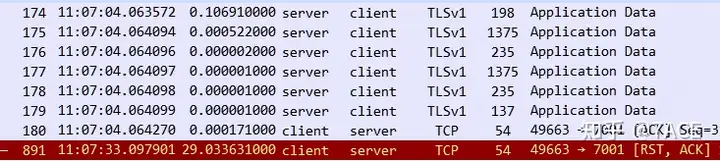
There are three larger ones. The first RST interval is 29 seconds. This is relatively easy to understand. During the data transmission process, after the No.180 client ACKs all the data segments transmitted by the server, there is an interval of 29 seconds without any interaction. The client reaches an application timeout and directly RSTs to disconnect. Although the use of FIN is not very standard, the 29 seconds here is not the direct cause of the slow application.
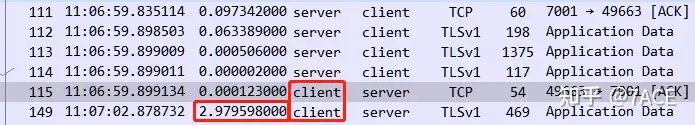
The second 2.97 seconds is a bit problematic. After the No.115 client ACK confirms the data segment transmitted by the server, there is a 2.97-second delay between the No.149 client and the data it sends. This slow problem occurs on the client itself.
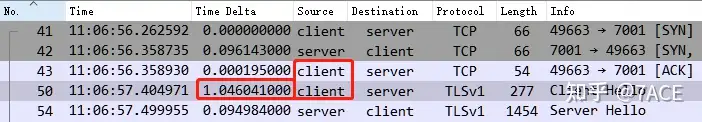
The third 1.04 seconds also occurred at the beginning of the TLS handshake. After TCP completed the three-way handshake, the client generated its own delay and initiated TLS negotiation 1.04 seconds later.
In addition, the time intervals with larger values are basically between 100-200ms. Although this is not exaggerated compared to 2.97 seconds and 1.04 seconds, if the accumulated number is large, it may also be the reason for slow application transmission in some cases. We will not analyze this too much here, and will directly check TCP Stream 47.
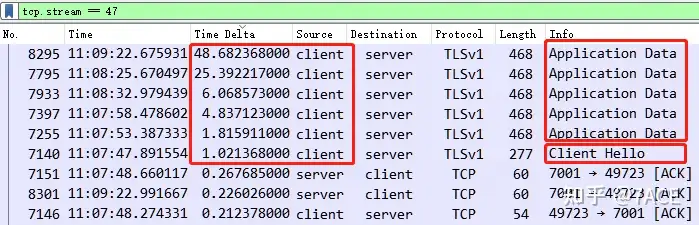
TCP Stream 47 is similar to TCP Stream 1, with the same TCP session integrity value of 47 (ending with RST), no abnormal information such as packet loss and retransmission, and a visible delay of 1.02 seconds from the client to the Client Hello.
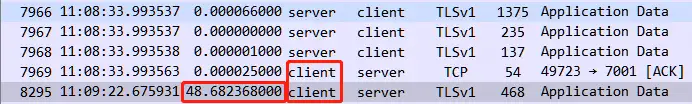
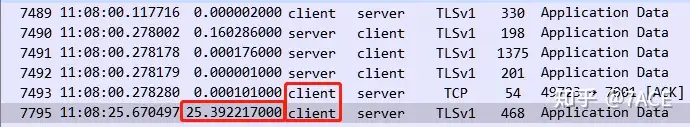
After clicking the Time Delta column again and sorting by size, the problem is obvious. The top 6 delays all come from the client itself. In addition to the initial Client Hello, the client’s own problems caused 5 large delays during the data transmission phase. For example, at 48 seconds and 25 seconds, the client paused for a long time before responding.
Combining the phenomena of TCP Stream 1 and TCP Stream 47, we can determine that the root cause of the problem lies on the client itself, either a system problem or an application problem. We need to further look for the cause on the client.
Summary of the problem
Data packets don’t lie. According to feedback from friends, the slow application problem was finally solved after the customer replaced his computer.