

Monitoring Linux servers is crucial to ensure they run smoothly and efficiently. In this article, we will introduce 30 intriguing tools and services to help you better monitor and manage your Linux servers. These tools and services cover a wide range of aspects, including system performance monitoring, log analysis, network traffic analysis, and security. Let’s explore each of them!
 >
>
System Performance Monitoring
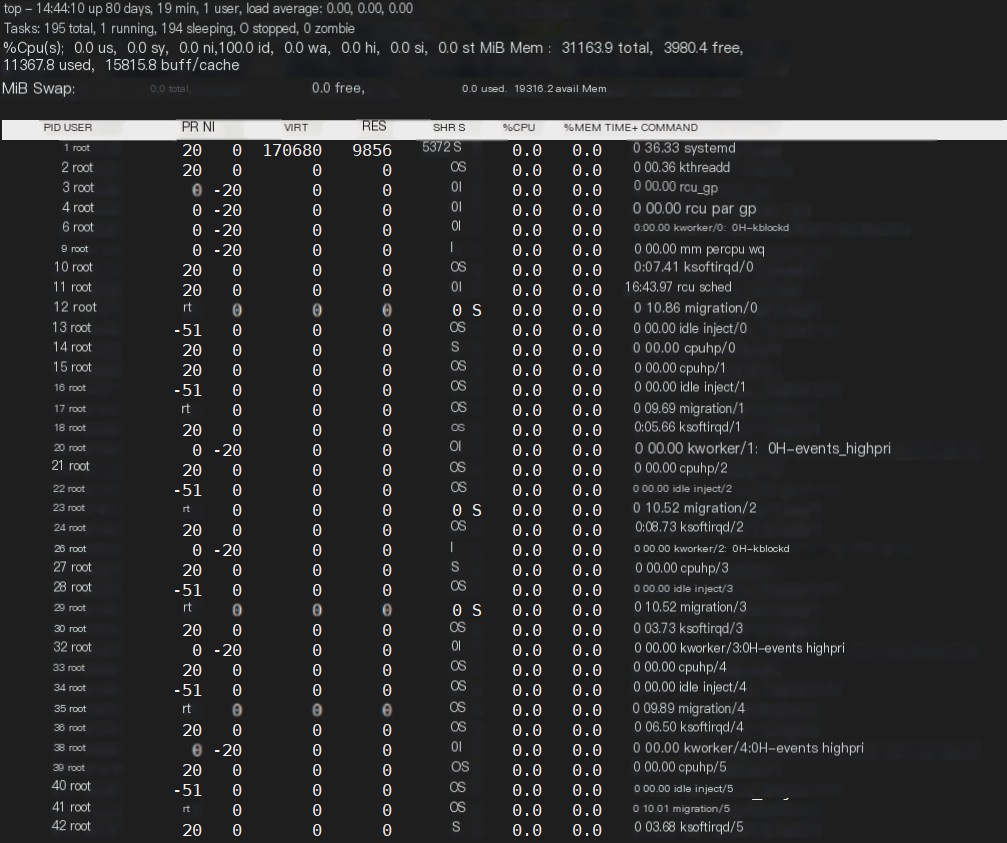
1. top
top is a command-line tool used for real-time system performance monitoring. It displays the processes running on the system and their CPU and memory usage. You can use the top command to monitor system load, memory usage, and CPU usage.
 >
>
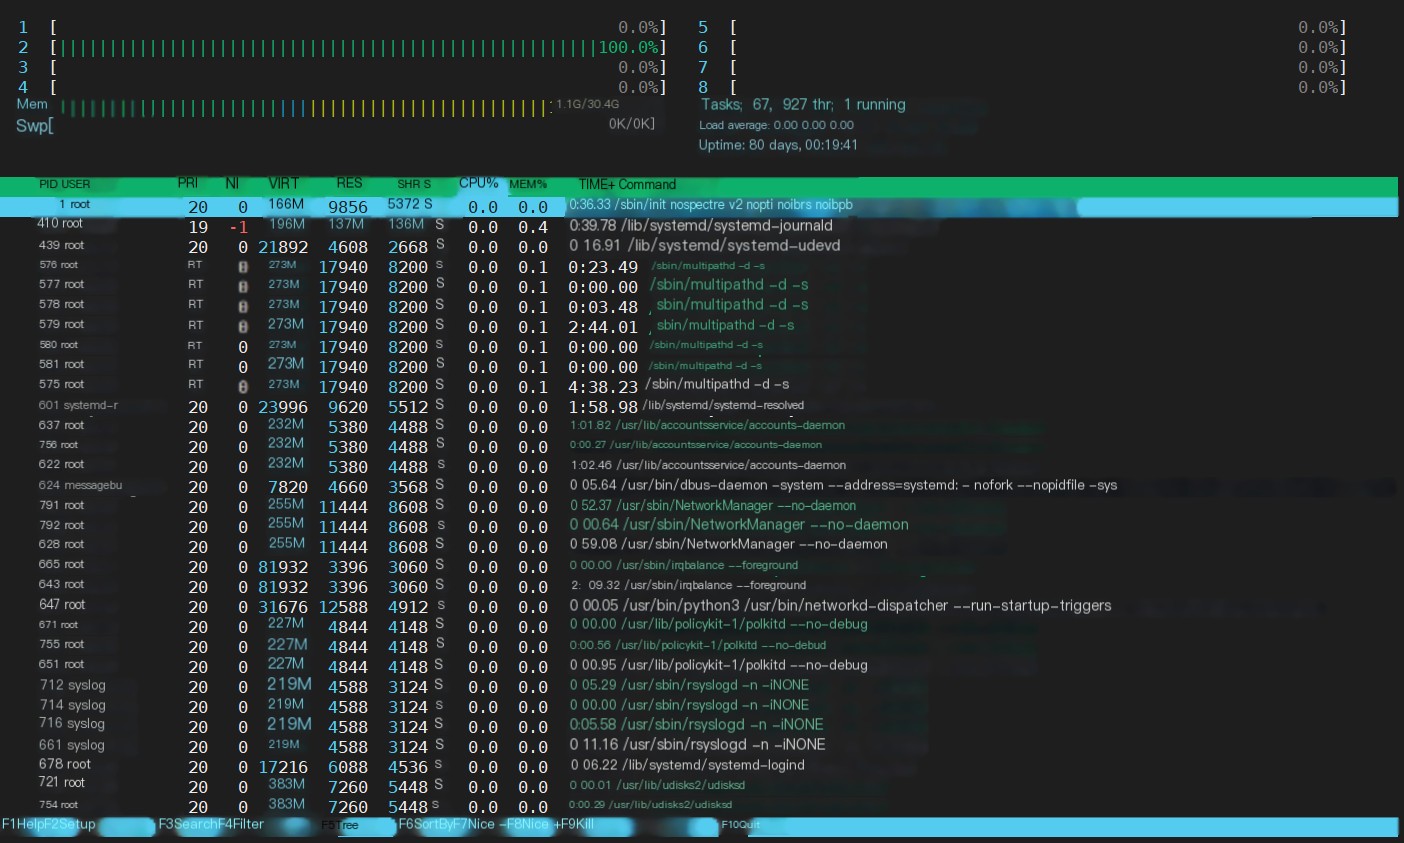
2. htop
htop is an enhanced version of the top command with a better user interface and more features. htop can display currently running processes and sort them by CPU, memory, and network usage. You can use the htop command to monitor system load, memory usage, and CPU usage.
3. Glances
Glances is a cross-platform system monitoring tool that provides real-time monitoring of system resources, including CPU, memory, disk usage, and network traffic. It can also monitor Docker containers, virtual machines, and Raspberry Pi devices. You can use Glances to monitor overall system performance.
4. sar
sar is another command-line tool for system performance monitoring, providing detailed information about CPU, memory, network, and disk usage. sar can record performance data and allow you to analyze it later. You can use sar to monitor system performance and conduct performance analysis.
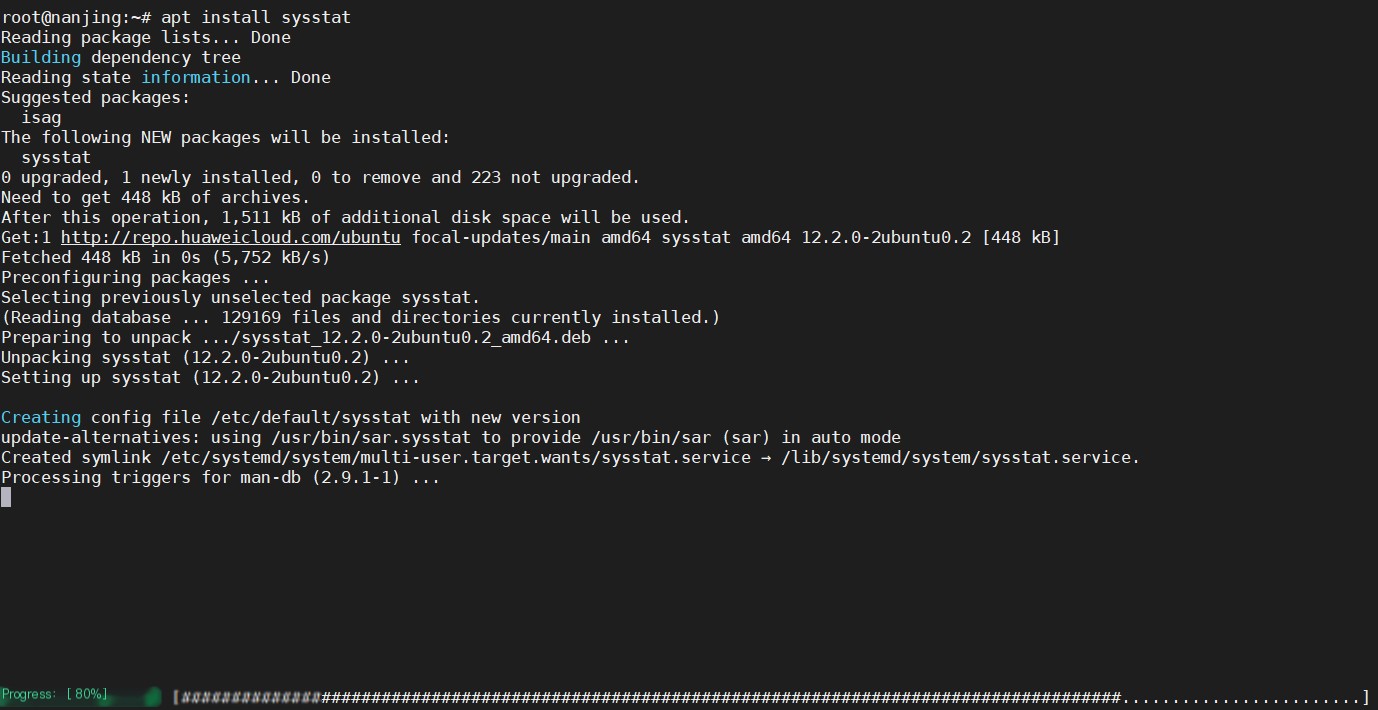 Install sar
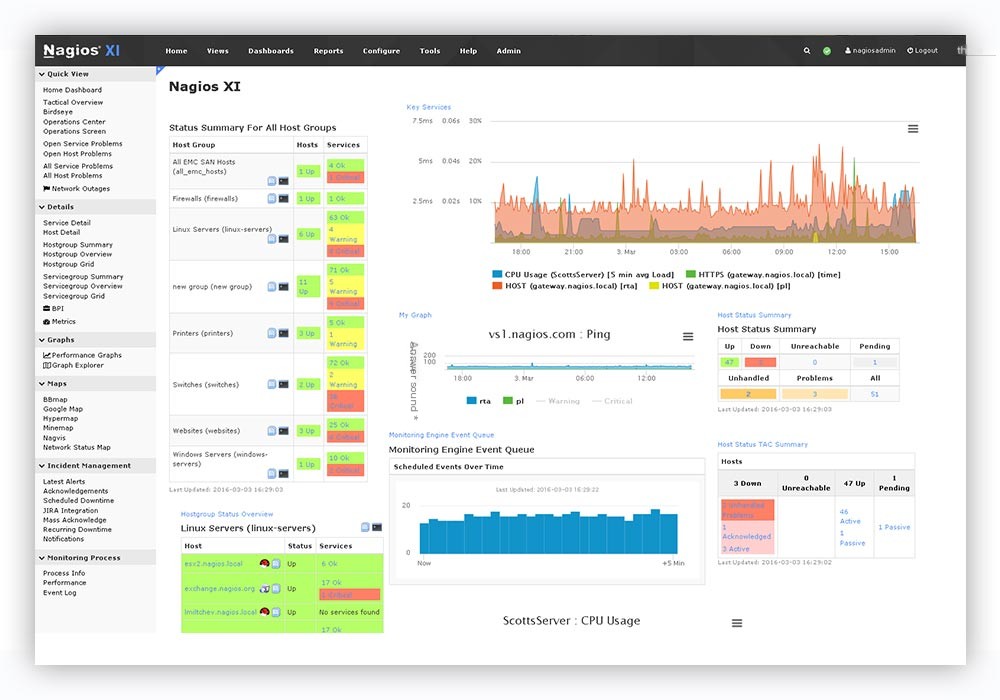
5. Nagios
Nagios is a widely used open-source network monitoring tool that can monitor networks, servers, applications, and services. Nagios can monitor CPU, memory, disk usage, network traffic, log files, and more. It can automate alerts and notifications to ensure system stability and reliability. You can use Nagios to monitor your Linux servers and applications.
Log Analysis
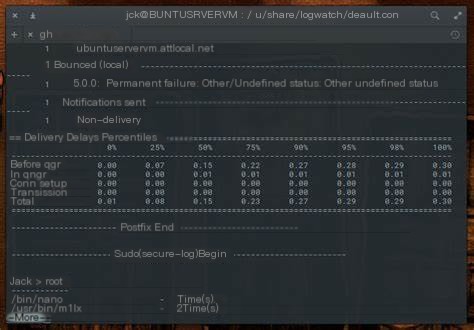
6. Logwatch
Logwatch is an open-source log analysis tool that can monitor system log files and generate summary reports. Logwatch can analyze various types of log files, including system logs, security logs, web server logs, and more. You can use Logwatch to monitor system logs, identify potential issues, and take timely action.
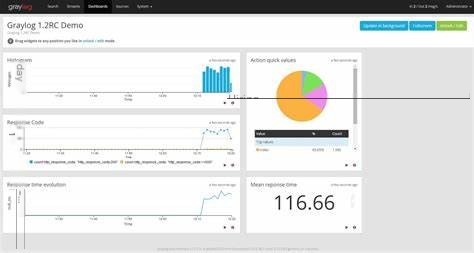
7. Graylog
Graylog is an open-source log management and analysis platform that can collect, store, and analyze log data from multiple sources. Graylog provides a web interface for searching, analyzing, and visualizing log data. It can also automate alerts and notifications and offers powerful search and filtering capabilities. You can use Graylog to manage and analyze logs from your Linux servers and applications.

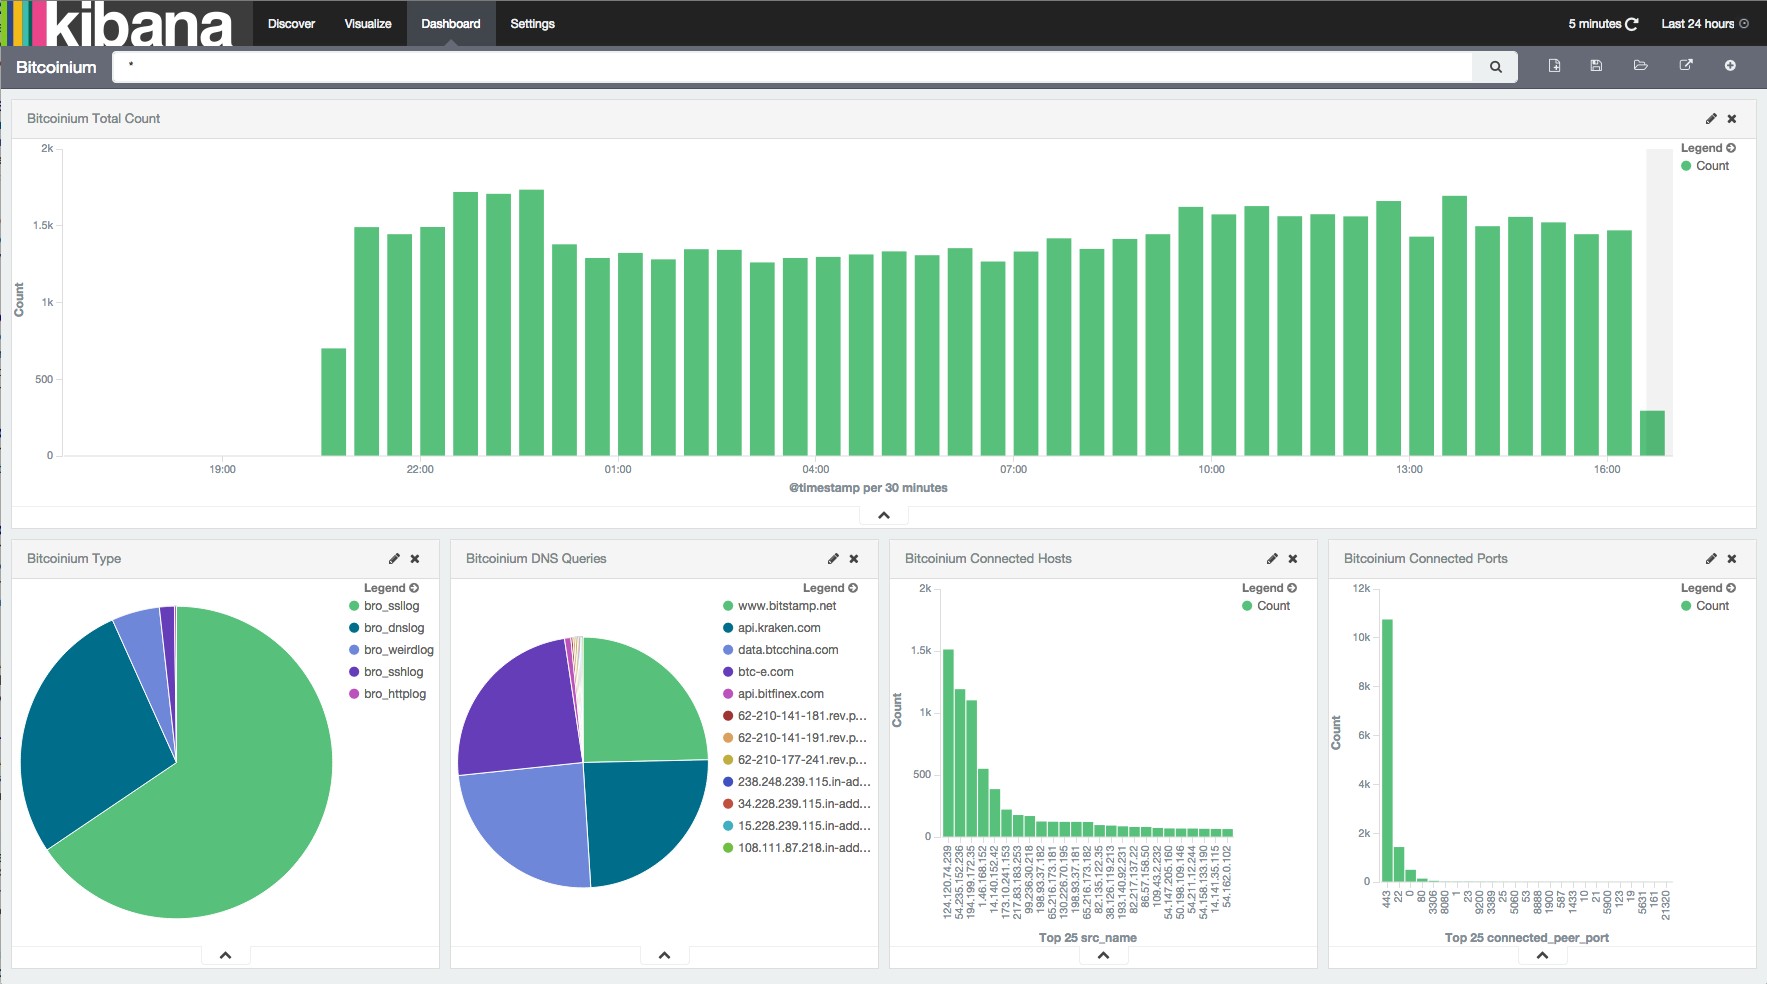
8. ELK Stack
ELK Stack is an open-source log management and analysis platform composed of Elasticsearch, Logstash, and Kibana. Elasticsearch is a distributed search engine for storing and searching large volumes of log data. Logstash is a tool for log collection, processing, and transformation. Kibana is a web interface for searching, analyzing, and visualizing log data. ELK Stack can help you manage and analyze logs from your Linux servers and applications.
Network Traffic Analysis
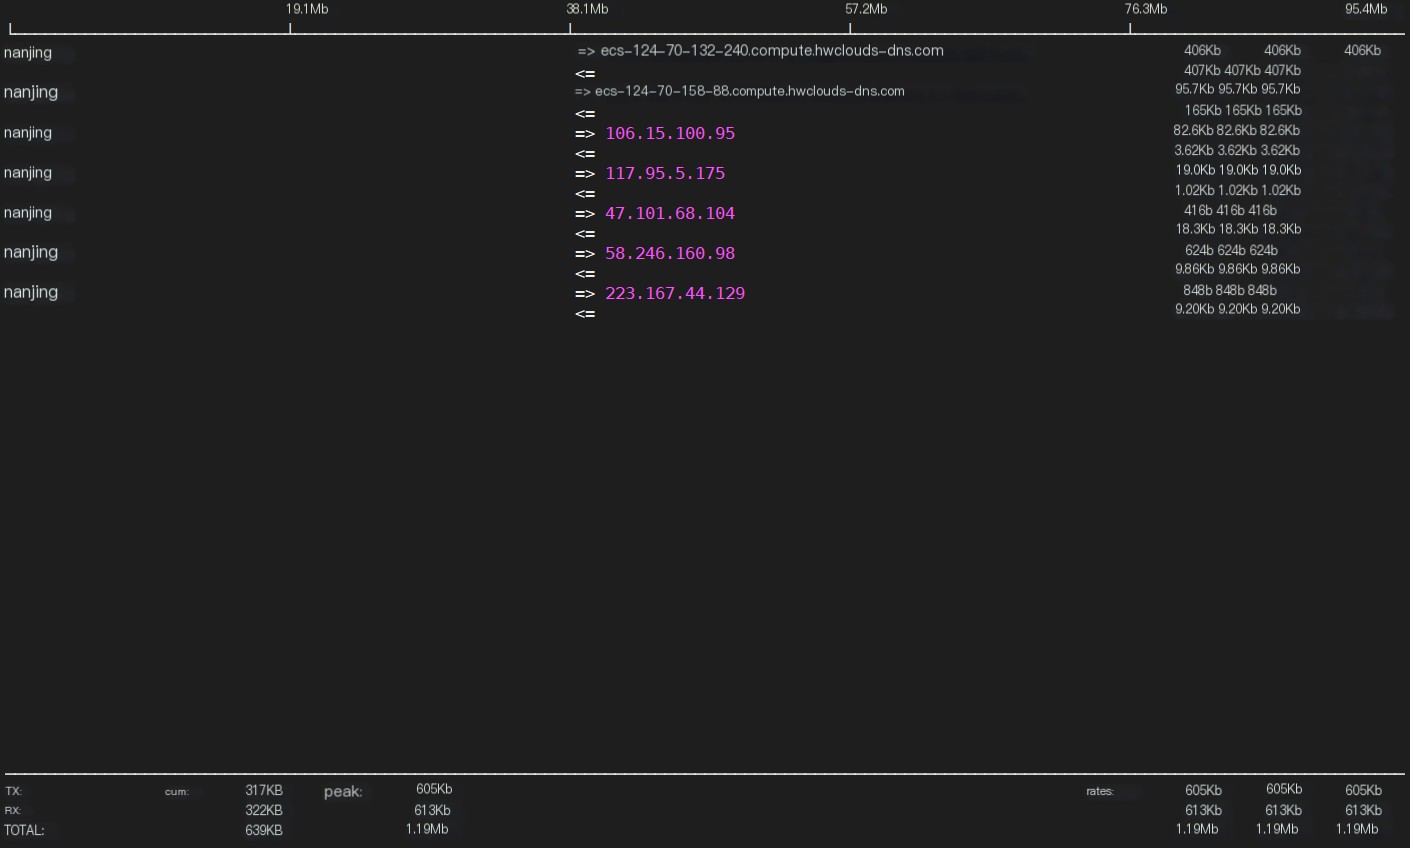
9. iftop
iftop is a command-line tool for real-time network traffic monitoring. It can display currently running processes and their network usage. iftop can help you monitor network traffic and identify processes causing network congestion.
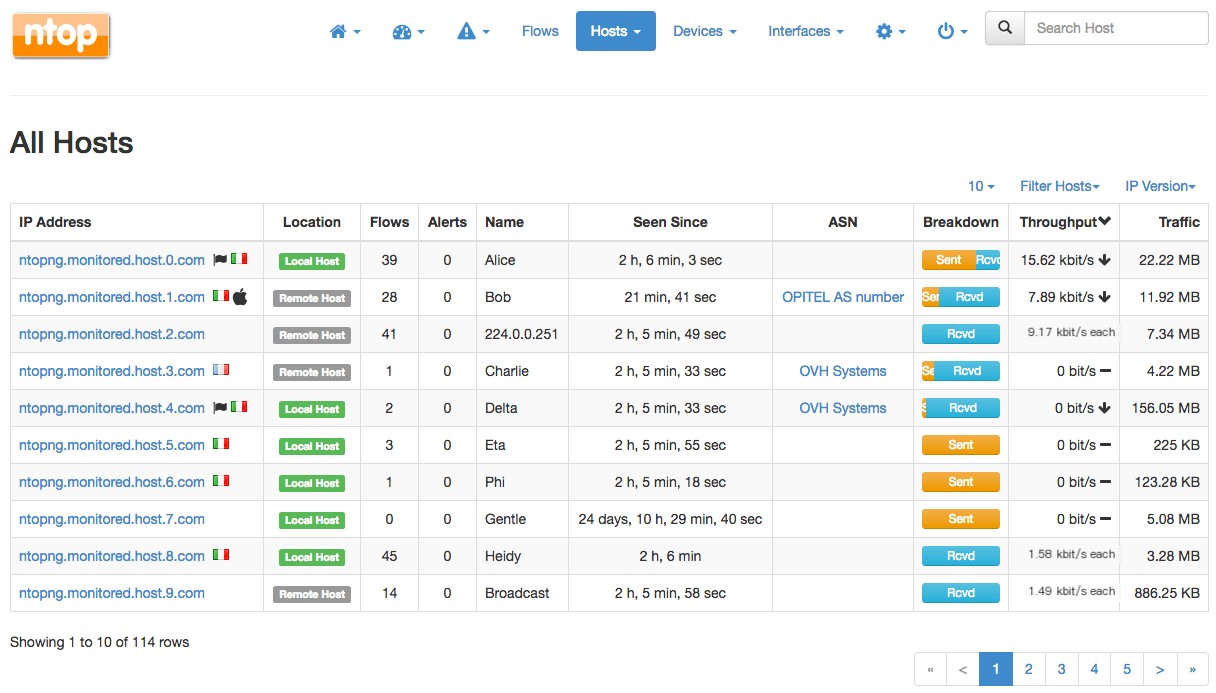
10. ntopng
ntopng is an open-source network traffic analysis tool that can monitor and analyze network traffic. ntopng provides a web interface for real-time network traffic monitoring, analysis, and reporting. It can also classify different types of network traffic like HTTP, FTP, and SMTP. You can use ntopng to monitor and analyze network traffic on your Linux servers.
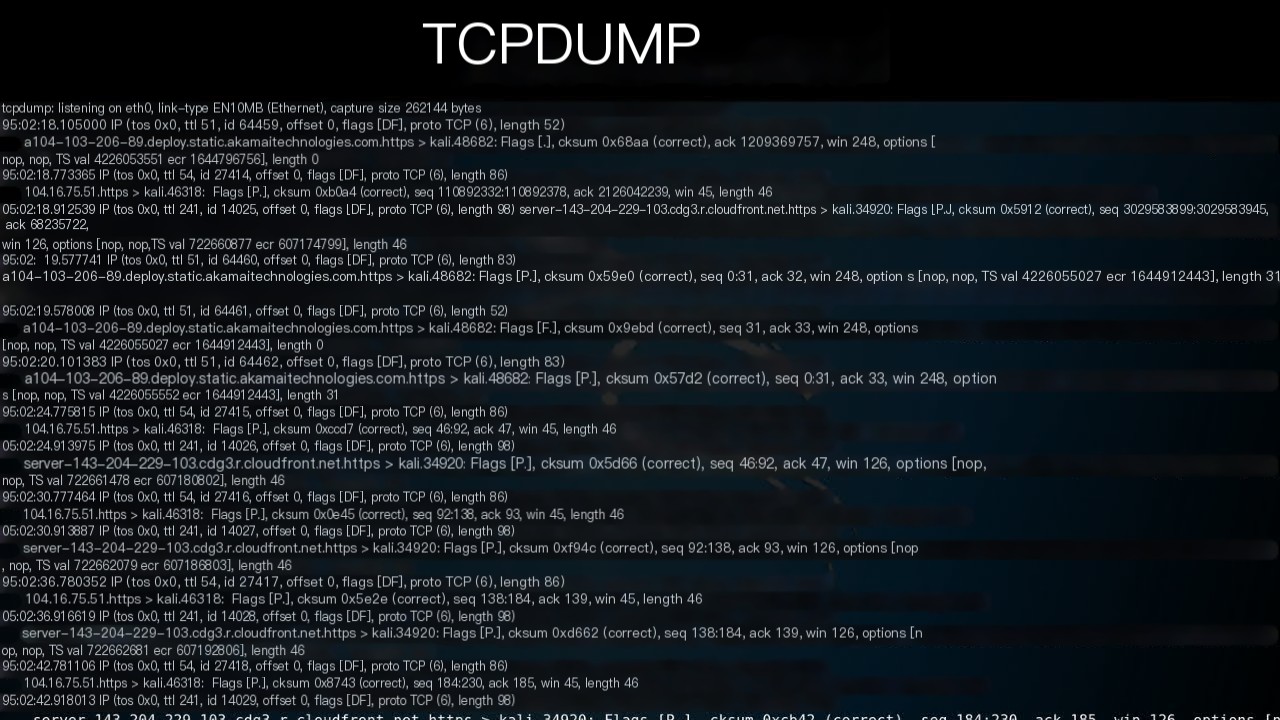
11. tcpdump
tcpdump is a command-line tool for capturing and analyzing network packets. tcpdump can monitor network traffic and capture specific types of packets. It can also save captured packets to files for later analysis. You can use tcpdump to monitor network traffic and analyze network issues.
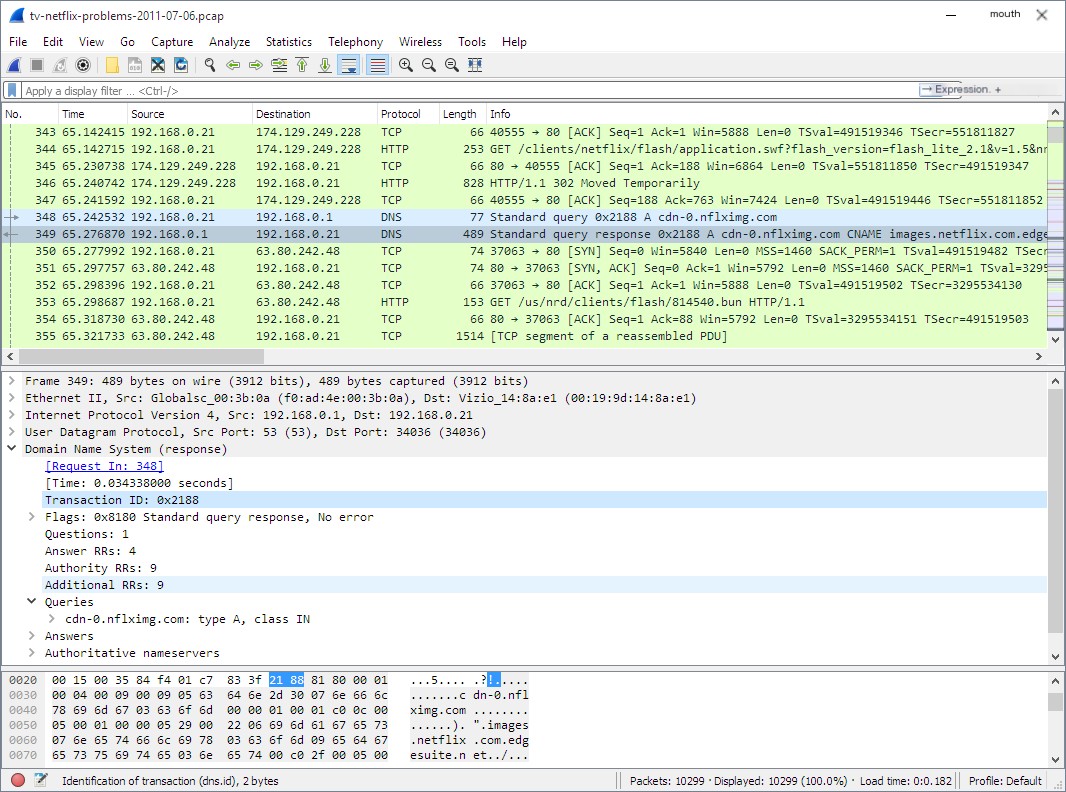
12. Wireshark
Wireshark is an open-source network protocol analysis tool that can capture and analyze network packets. Wireshark provides a graphical user interface for browsing, filtering, and analyzing network packets. It can also recognize and analyze different types of network protocols and traffic. You can use Wireshark to monitor and analyze network traffic on your Linux servers.
Security
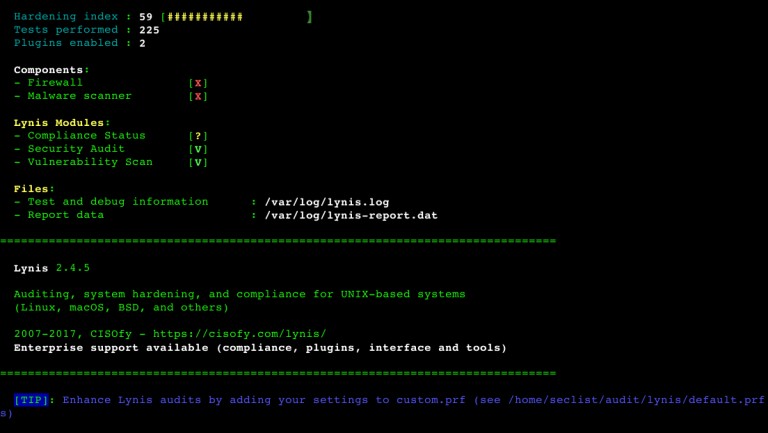
13. Lynis
Lynis is an open-source system security audit tool that can analyze the security of your Linux servers and provide reports about security vulnerabilities and recommendations. Lynis can check system configurations, file permissions, network settings, user accounts, and services for security compliance. Lynis also checks if your system adheres to best security practices and provides security recommendations and remediation actions.
14. OSSEC
OSSEC is an open-source intrusion detection system that can monitor your Linux servers for any potential intrusion activities. OSSEC can monitor system logs, file changes, registry modifications, process behaviors, and alerts you via email, SMS, and other notification methods. OSSEC also provides many advanced features such as file integrity monitoring, vulnerability scanning, and host firewalling. You can use OSSEC to protect your Linux servers against intrusions and attacks.

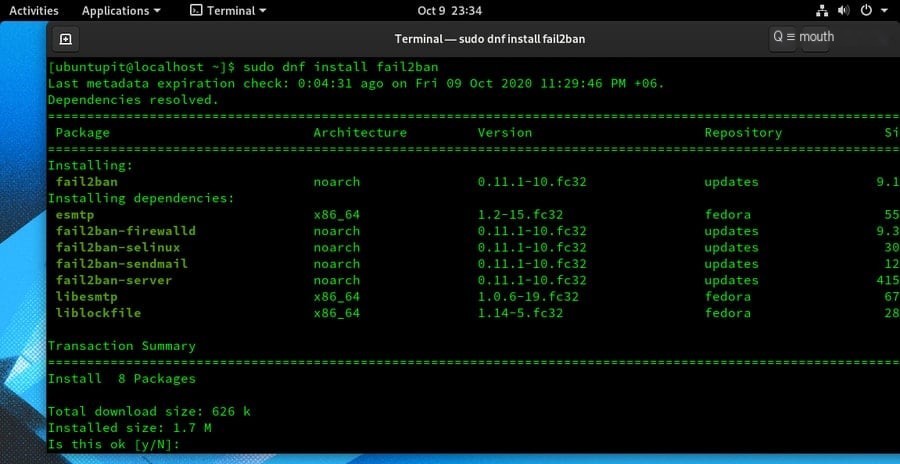
15. Fail2ban
Fail2ban is an open-source intrusion prevention tool that can prevent malicious attackers from brute forcing your Linux servers. Fail2ban monitors system logs and automatically bans malicious IP addresses after detecting multiple failed login attempts. Fail2ban provides many configuration options, such as defensive rules, ban durations, and email notifications. You can use Fail2ban to protect your Linux servers from brute force attacks and intrusions.
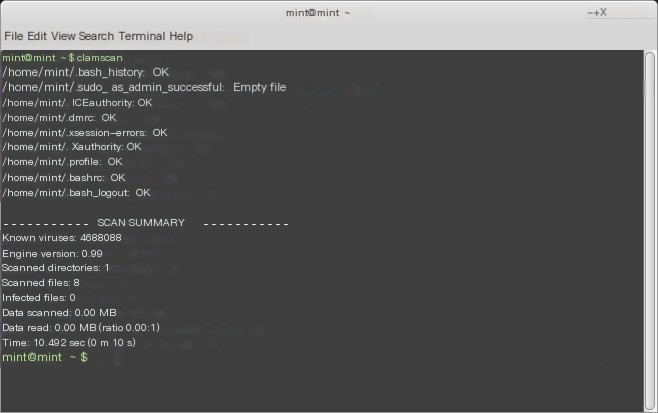
16. ClamAV
ClamAV is an open-source antivirus engine that can detect and clear malware and viruses on your Linux servers. ClamAV can scan files, emails, and other content, providing detailed information about malware and viruses. ClamAV also offers many advanced features like file compression support, multi-threaded scanning, and virus definition updates. You can use ClamAV to protect your Linux servers from malware and virus attacks.
Performance Monitoring
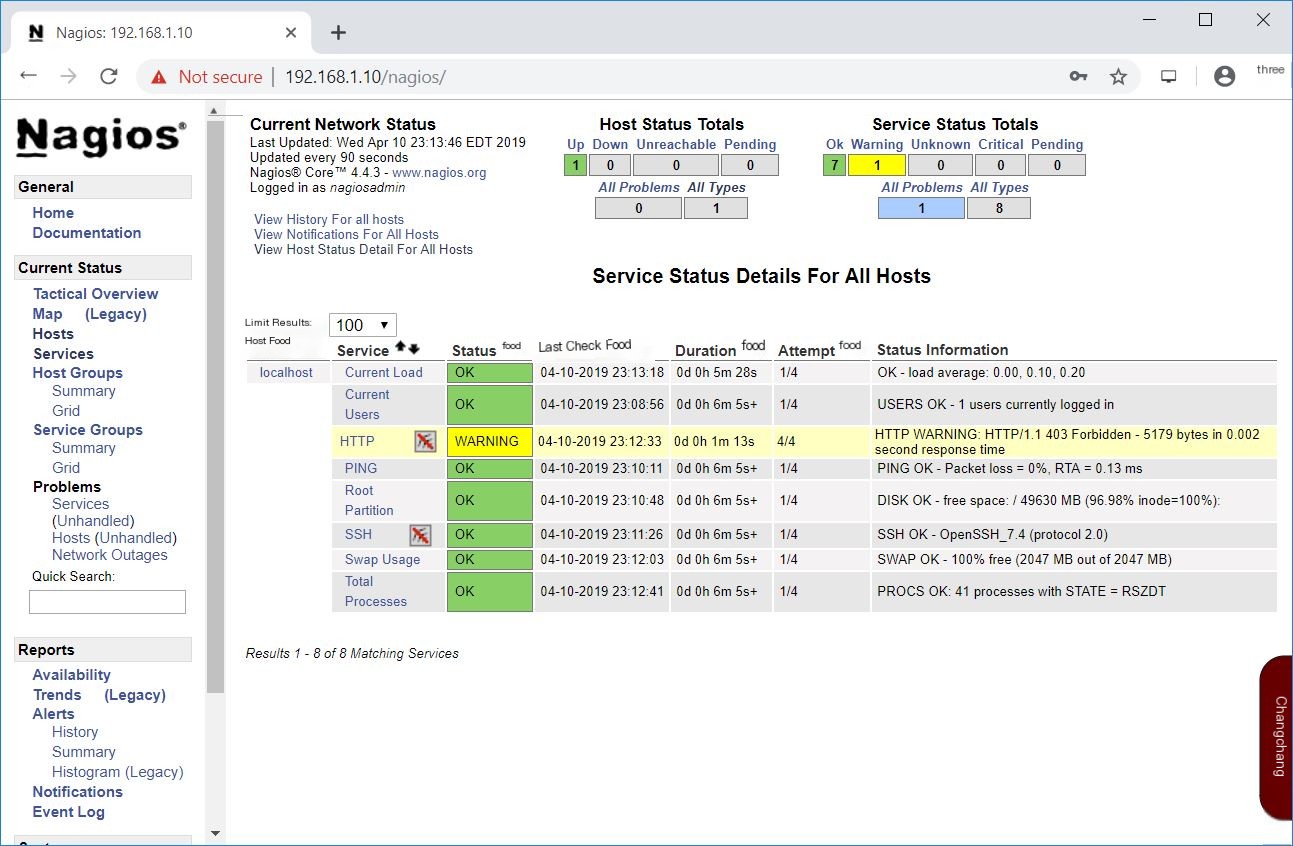
17. Nagios
Nagios is an open-source network monitoring system that can monitor your Linux servers and network devices, providing performance and availability reports. Nagios can monitor server CPU, memory, disk, and network usage, as well as the status of applications and services. Nagios also automates alerts and notifications, offering powerful reporting and analysis features. You can use Nagios to monitor the performance and availability of your Linux servers and network devices.
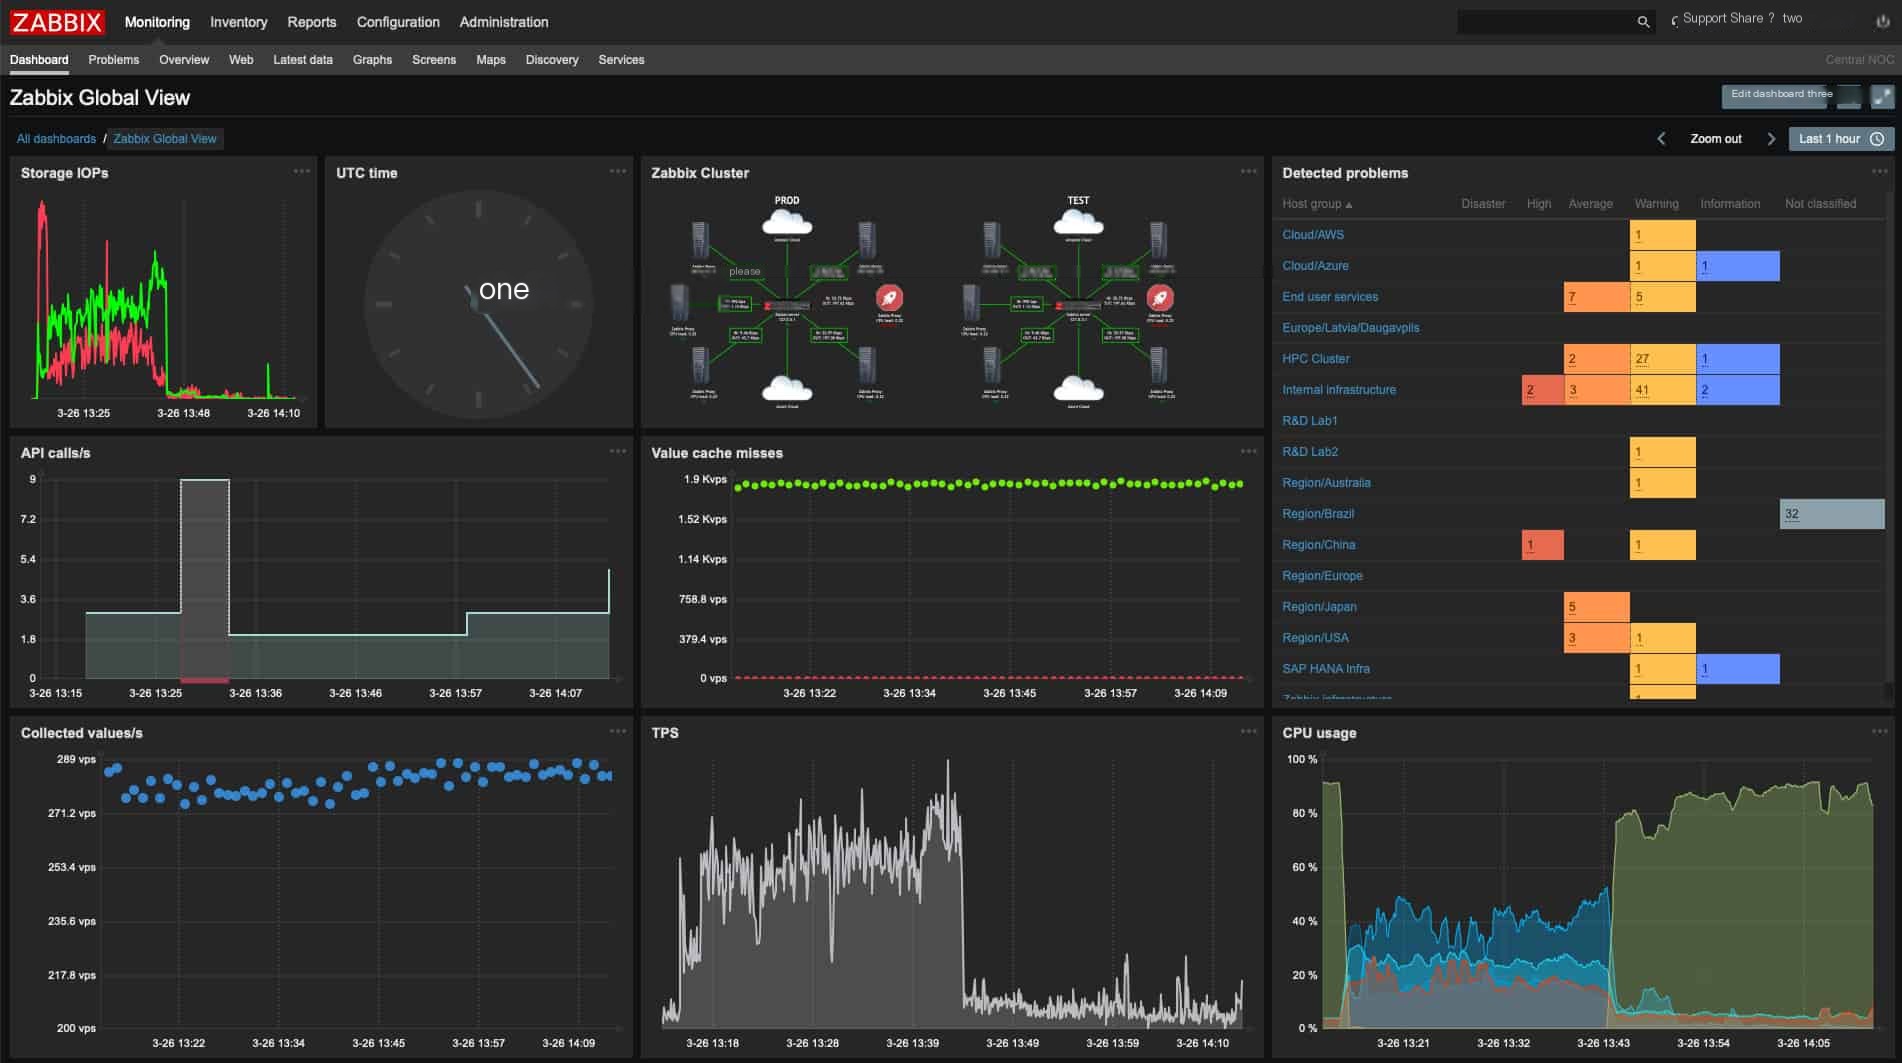
18. Zabbix
Zabbix is an open-source network monitoring system that can monitor your Linux servers and network devices, providing performance and availability reports. Zabbix can monitor server CPU, memory, disk, and network usage, as well as the status of applications and services. Zabbix offers many advanced features like automated alerts and notifications, historical data storage, visualization, API support, and distributed monitoring. You can use Zabbix to monitor the performance and availability of your Linux servers and network devices.
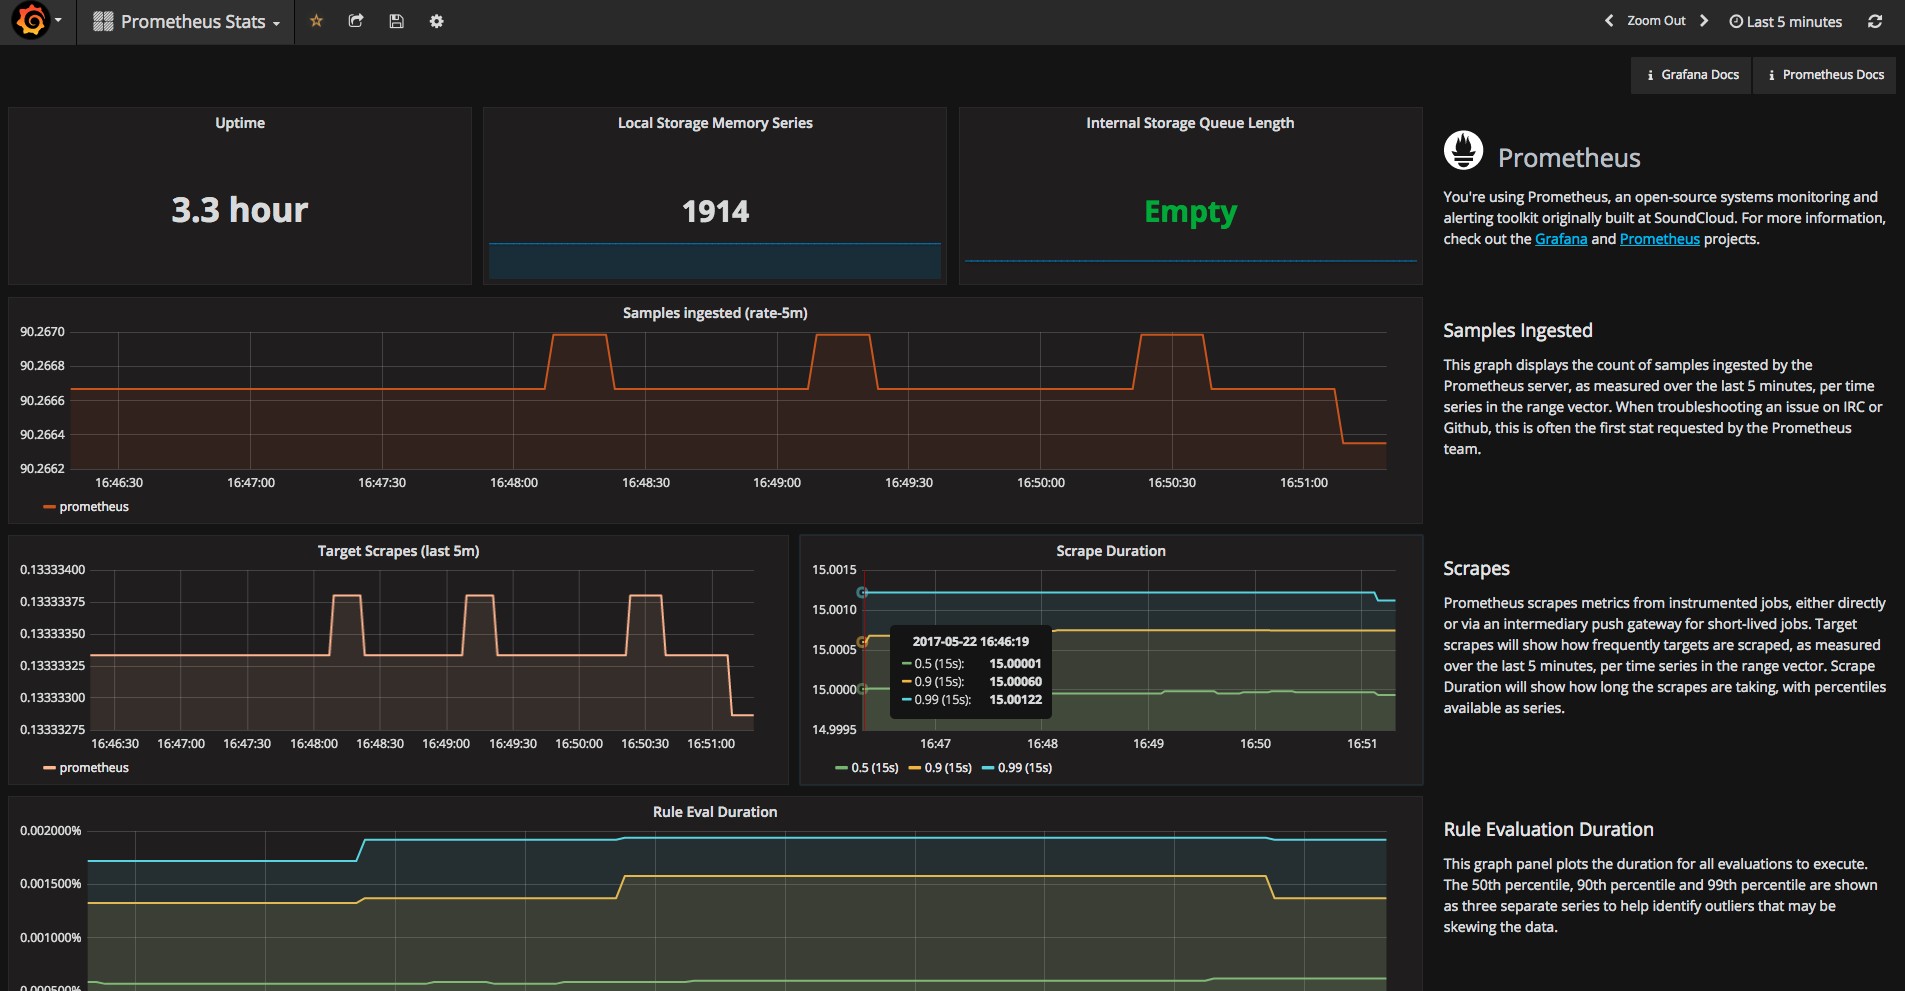
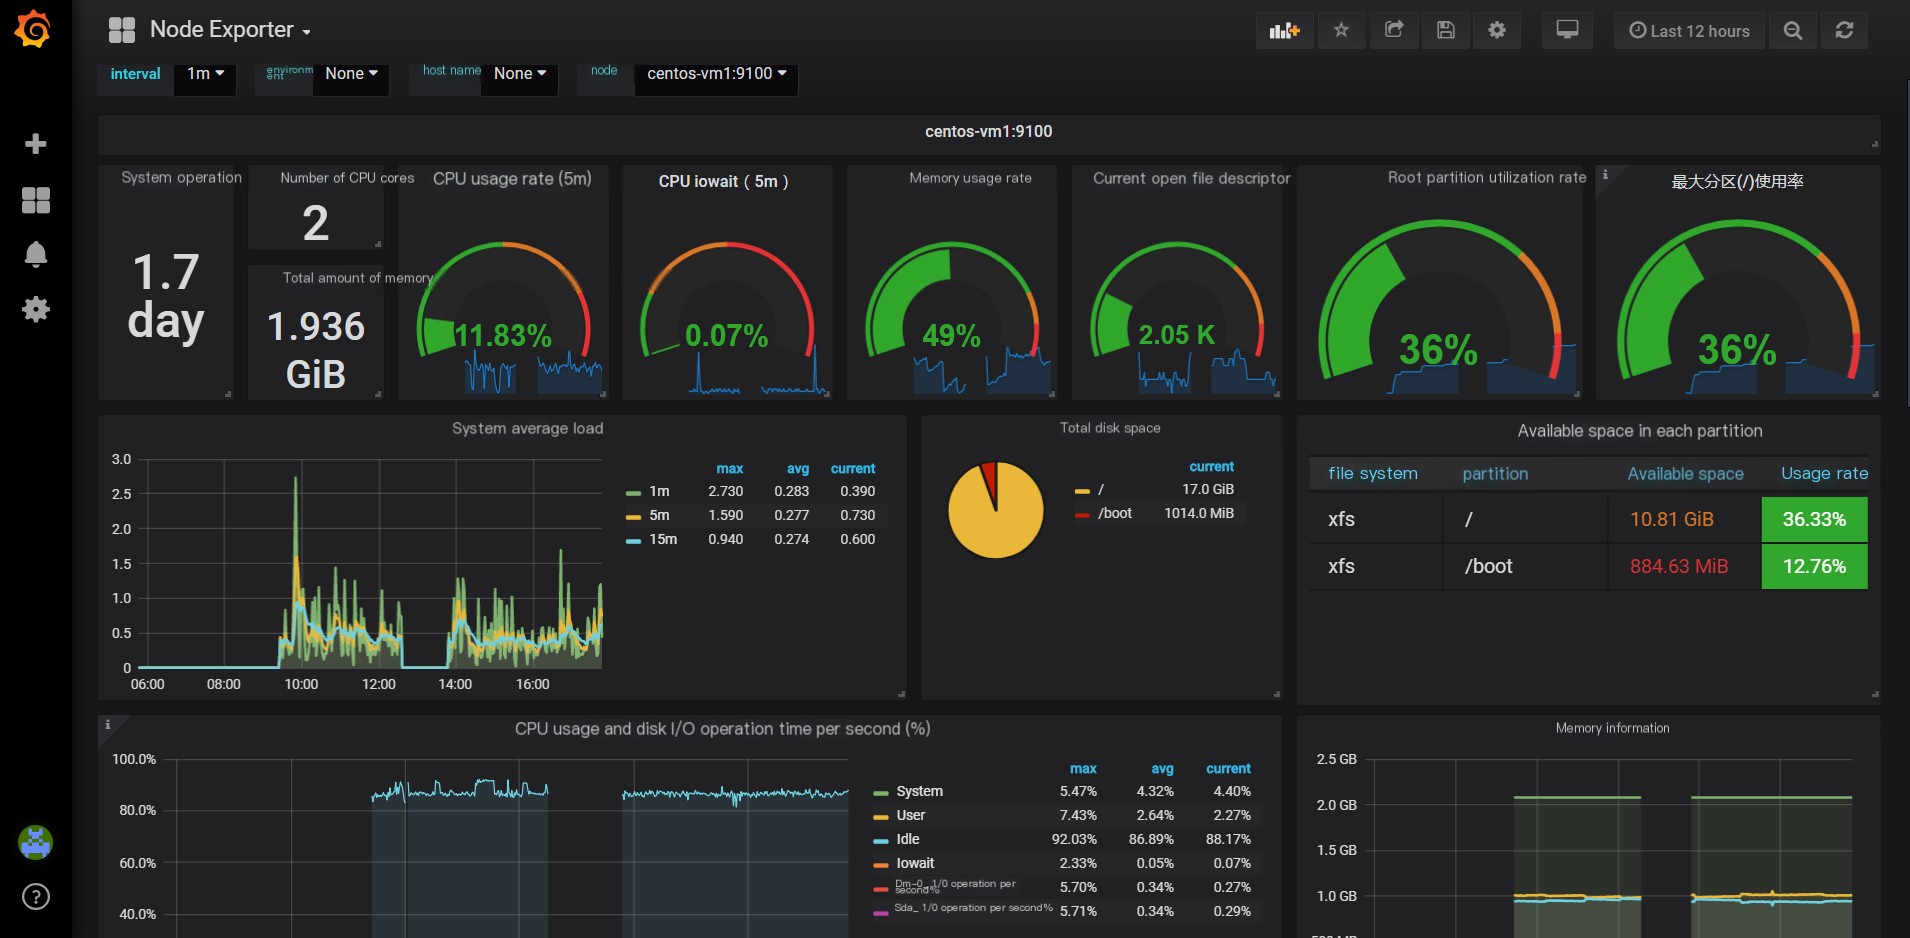
19. Prometheus
Prometheus is an open-source system monitoring and alerting tool that can monitor your Linux servers and applications, providing performance and availability reports. Prometheus can monitor server CPU, memory, disk, and network usage, as well as the status of applications and services. Prometheus offers many advanced features like a multidimensional data model, powerful query language, visualization, and alerting. You can use Prometheus to monitor the performance and availability of your Linux servers and applications.
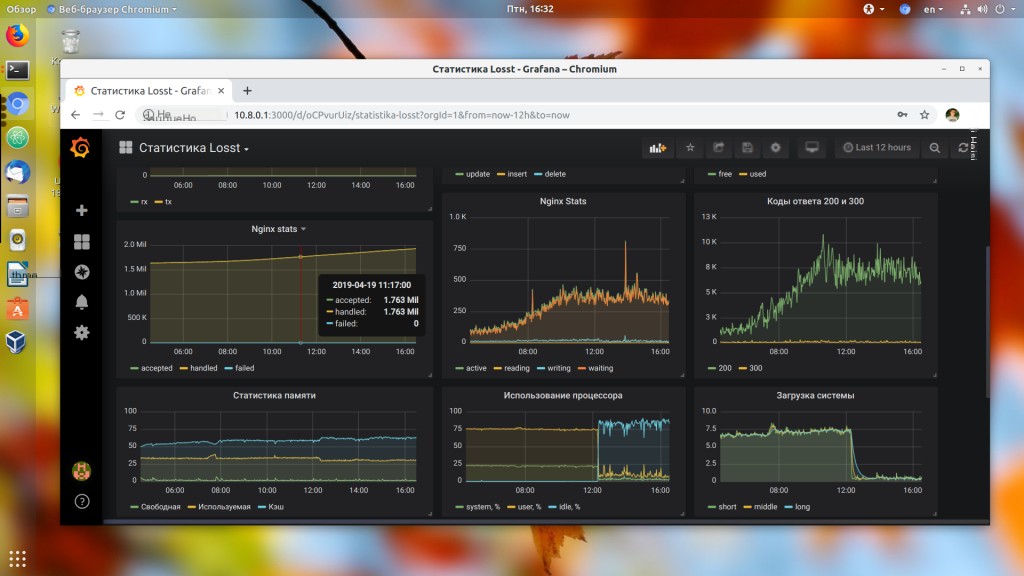
20. Grafana
Grafana is an open-source visualization and alerting tool that can integrate with other monitoring systems, providing beautiful and easy-to-understand reports and dashboards. Grafana can display data from various monitoring systems and create attractive dashboards with powerful visualization tools. Grafana offers many advanced features like alerts, annotations, visualization templates, and data source plugins. You can use Grafana to visualize performance and availability data of your Linux servers and applications.
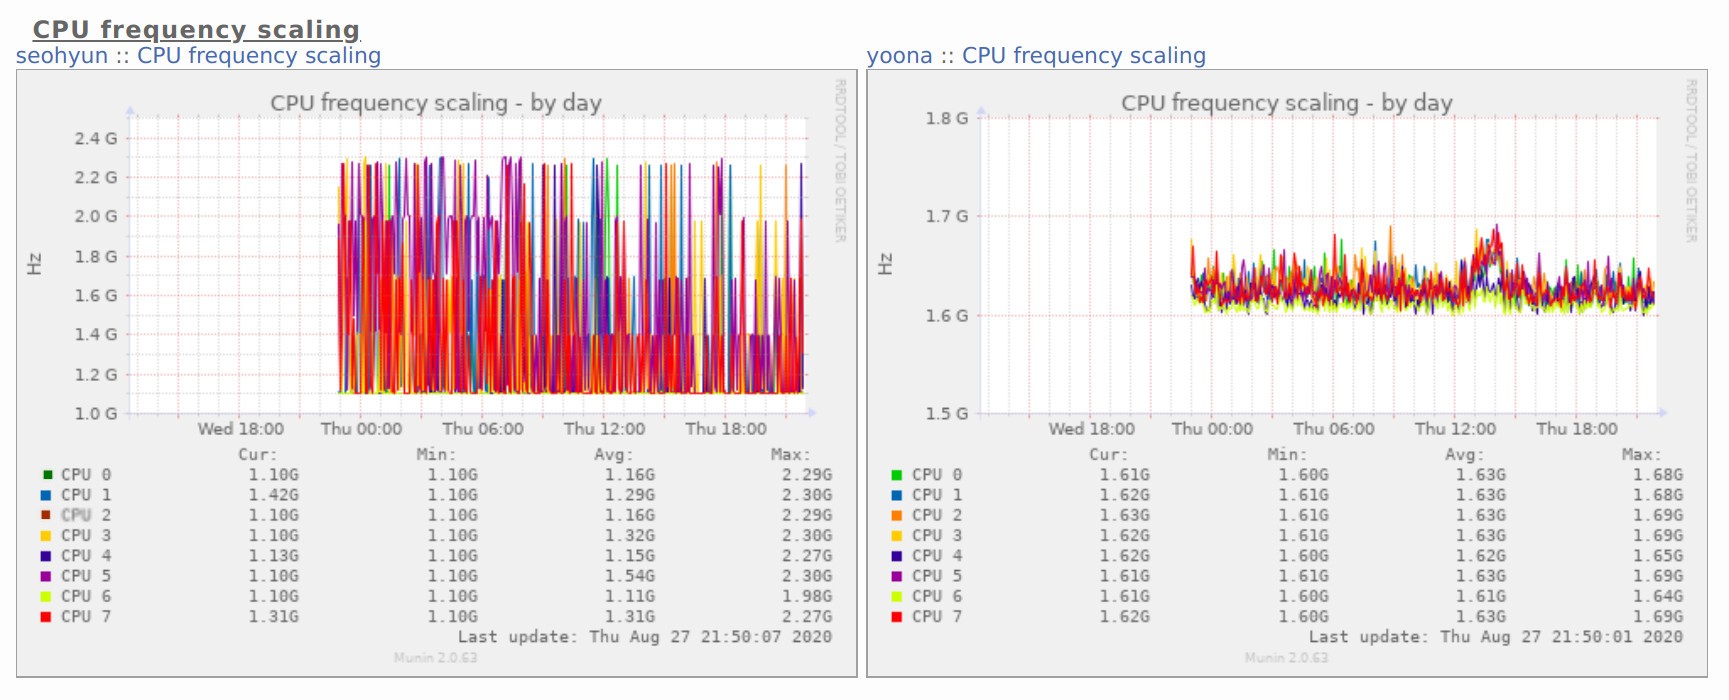
21. Munin
Munin is an open-source network monitoring system that can monitor your Linux servers and network devices, providing performance and availability reports. Munin can monitor server CPU, memory, disk, and network usage, as well as the status of applications and services. Munin offers many advanced features like automated alerts and notifications, historical data storage, visualization, plugin support, and distributed monitoring. You can use Munin to monitor the performance and availability of your Linux servers and network devices.
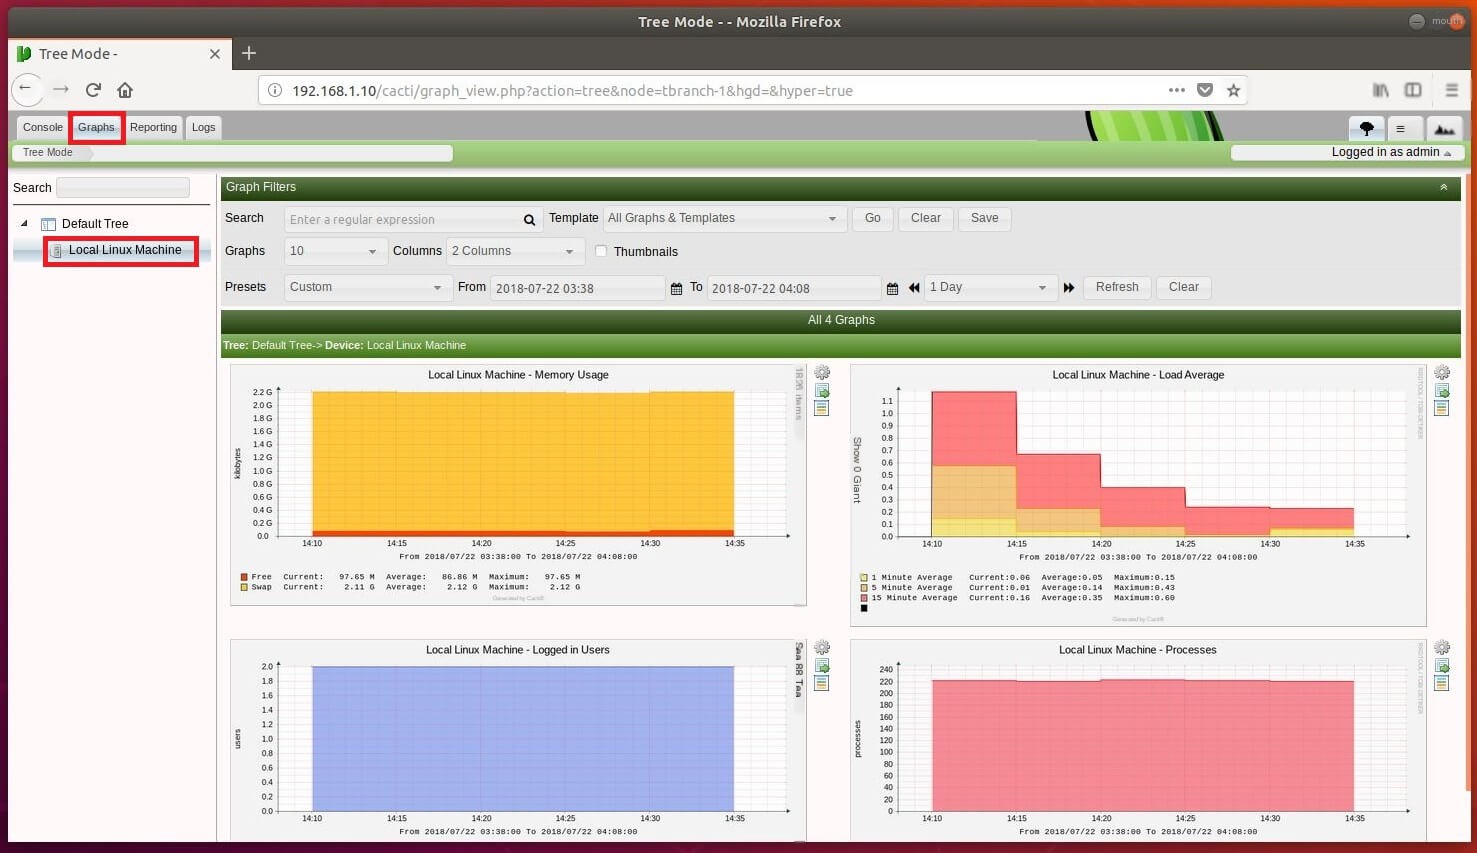
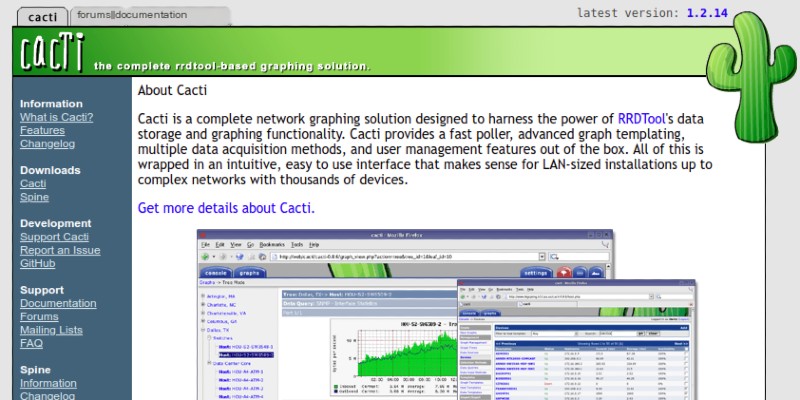
22. Cacti
Cacti is an open-source network monitoring system that can monitor your Linux servers and network devices, providing performance and availability reports. Cacti can monitor server CPU, memory, disk, and network usage, as well as the status of applications and services. Cacti offers many advanced features like automated alerts and notifications, historical data storage, visualization, plugin support, and distributed monitoring. You can use Cacti to monitor the performance and availability of your Linux servers and network devices.
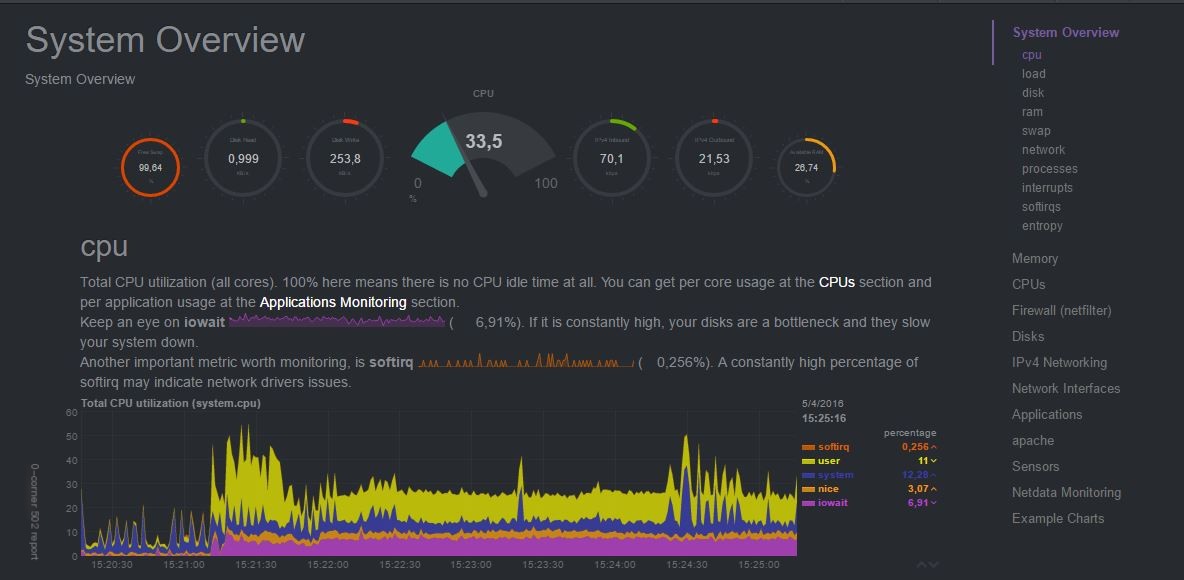
23. Netdata
Netdata is an open-source real-time performance monitoring tool that can monitor your Linux servers and applications, providing real-time performance and availability reports. Netdata can monitor server CPU, memory, disk, and network usage, as well as the status of applications and services. Netdata offers many advanced features like real-time alerts and notifications, visualization, and scalability. You can use Netdata to monitor the real-time performance and availability of your Linux servers and applications.
24. Collectd
Collectd is an open-source system statistics collection tool that can monitor your Linux servers and applications, providing performance and availability reports. Collectd can monitor server CPU, memory, disk, and network usage, as well as the status of applications and services. Collectd offers many advanced features like plugin support, data storage, and visualization. You can use Collectd to monitor the performance and availability of your Linux servers and applications.
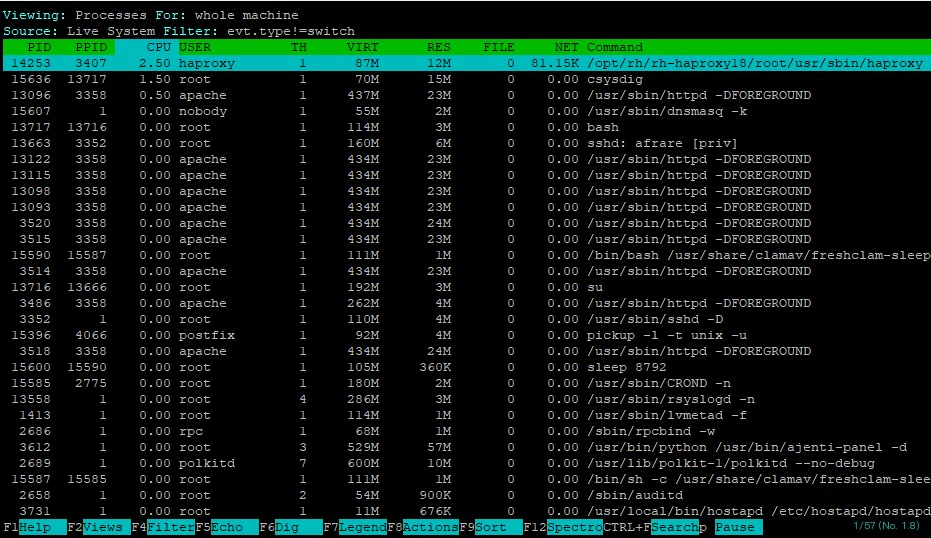
25. Sysdig
Sysdig is an open-source system monitoring and security tool that can monitor your Linux servers and containers, providing performance, security, and availability reports. Sysdig can monitor server CPU, memory, disk, and network usage, as well as the status of applications and services. Sysdig offers many advanced features like container monitoring, event recording, security auditing, and alerts. You can use Sysdig to monitor the performance, security, and availability of your Linux servers and containers.
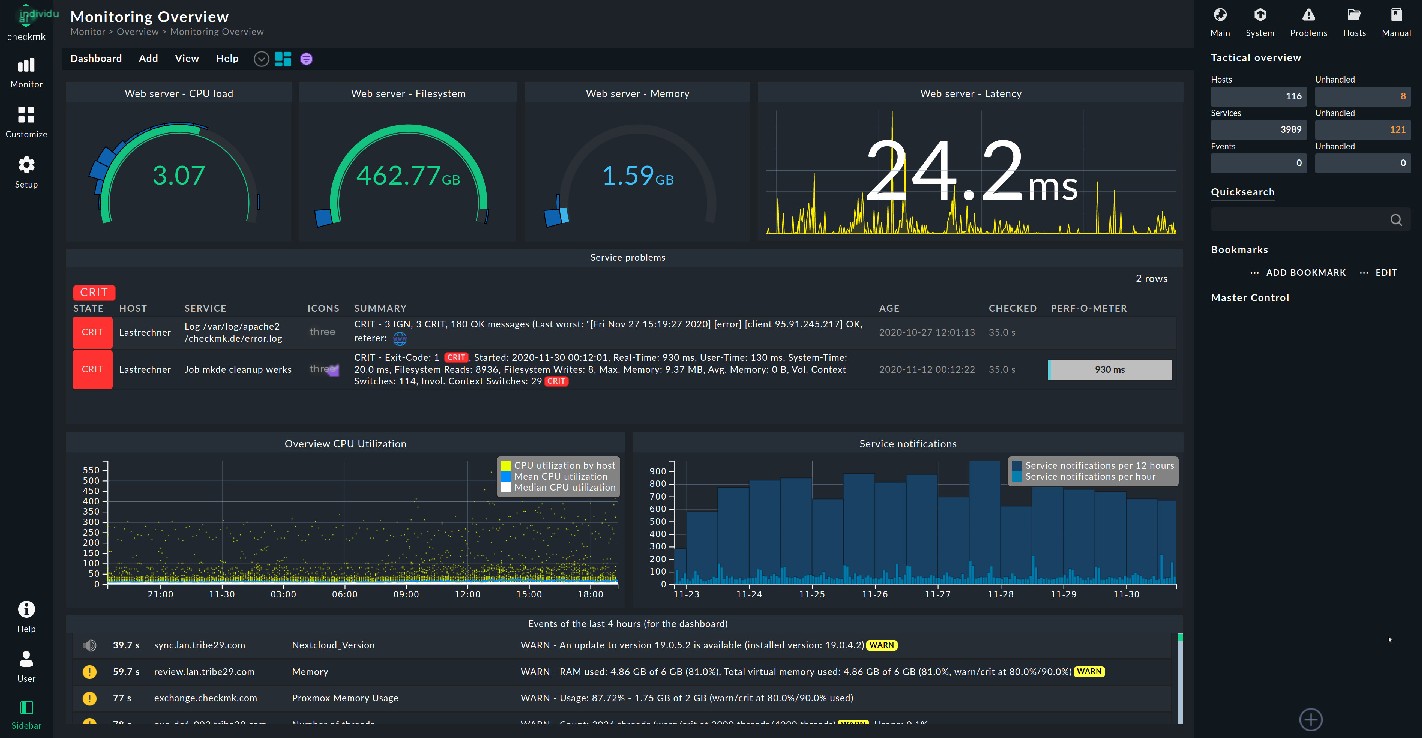
26. Checkmk
Checkmk is an open-source IT monitoring and automation tool that can monitor your Linux servers and network devices, providing performance and availability reports. Checkmk can monitor server CPU, memory, disk, and network usage, as well as the status of applications and services. Checkmk offers many advanced features like automated alerts and notifications, historical data storage, visualization, configuration management, and automation. You can use Checkmk to monitor the performance and availability of your Linux servers and network devices and automate their management and maintenance.
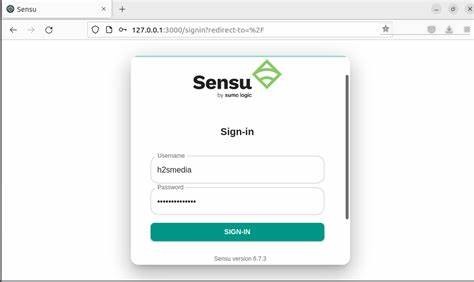
27. Sensu
Sensu is an open-source infrastructure and application monitoring tool that can monitor your Linux servers and applications, providing performance and availability reports. Sensu can monitor server CPU, memory, disk, and network usage, as well as the status of applications and services. Sensu offers many advanced features like plugin support, custom alerts and notifications, historical data storage, and visualization. You can use Sensu to monitor the performance and availability of your Linux servers and applications, quickly diagnose, and resolve issues.
28. Cacti
Cacti is an open-source network graphing tool that can monitor your Linux servers and network devices, providing performance and availability reports. Cacti can monitor server CPU, memory, disk, and network usage, as well as bandwidth, traffic, and connection counts of network devices. Cacti offers many advanced features like graphical configuration and management, custom data sources, and data queries. You can use Cacti to monitor the performance and availability of your Linux servers and network devices and manage them graphically.
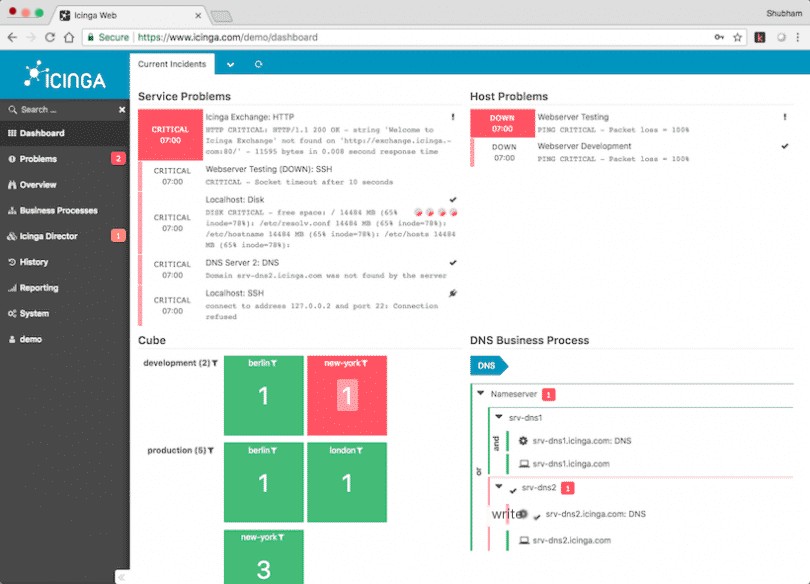
29. Icinga
Icinga is an open-source IT monitoring and alerting tool that can monitor your Linux servers and network devices, providing performance and availability reports. Icinga can monitor server CPU, memory, disk, and network usage, as well as the status of applications and services. Icinga offers many advanced features like custom alerts and notifications, visualization and reporting, automation, and configuration management. You can use Icinga to monitor the performance and availability of your Linux servers and network devices and automate their management and maintenance.
30. Graylog
Graylog is an open-source log management and analysis tool that can monitor the logs of your Linux servers and applications, providing performance and availability reports. Graylog can monitor system logs, application logs, and log files on your servers, providing real-time search, filtering, and analysis capabilities. Graylog offers many advanced features like alerts and notifications, visualization and reporting, data storage, and security. You can use Graylog to monitor your Linux servers and applications’ logs and analyze and resolve issues.
Conclusion
Linux servers are the core infrastructure for many enterprises and organizations, requiring monitoring and management to ensure their performance and availability. This article introduced 30 intriguing tools and services to monitor your Linux servers, covering extensive areas in performance monitoring and alerting, log management and analysis, security, and automation. Choosing the right tools and services can greatly enhance the performance and availability of your Linux servers and help you quickly diagnose and resolve issues.