

5)Network Performance Testing Tools
“An Overview of Network Performance Testing Tools”
ab is a performance testing tool developed by Apache. In Ubuntu, it can be installed using the command apt-get install -y apache2-utils.
The test URL is on port 8000 of 192.168.0.23, with a concurrency number of 10, and a total of 1000 requests sent.
The name of the test server.
The host name of the request URL.
The port on which the web server listens.
The absolute path in the request URL, by analyzing the file’s extension, one can usually determine the type of request.
The body length of the HTTP response data.
The number of concurrent users, which is the parameter in -c.
The total number of requests, which is the parameter in -n.
Indicates the number of failed requests. Here, failure refers to exceptions in stages like connecting to the server, sending data, and timeout when there’s no response.
The total sum of response data lengths from all requests, including both the headers and body of HTTP response data.
The total of body data in response data from all requests, basically removing the header length from the Total transferred in HTTP response data.
Throughput rate, calculated as Complete requests / Time taken for tests, the total number of requests / the time taken to complete those requests.
The average wait time for a user request is calculated as: Time token for tests / (Complete requests / Concurrency Level). The time taken to complete all requests / (total requests / number of concurrent users).
Indicates the average server request wait time, calculated as Time taken for tests / Complete requests, which is exactly the reciprocal of throughput. It can also be computed as Time per request / Concurrency Level.
Indicates the data length fetched from the server per unit time by these requests, calculated as: Total transferred / Time taken for tests. This statistic describes the server’s demand for outbound bandwidth when its processing capacity reaches the limit.
This section of data describes the distribution of processing time for each request. For instance, in the above test, 80% of request processing times do not exceed 177ms. This processing time refers to the previous Time per request, meaning the average processing time for each request for a single user.
“Review of Network Performance Testing Tools: An Overview of WRK”
wrk is a simple HTTP benchmarking tool that is hosted on Github at https://github.com/wg/wrk. A notable feature of wrk is its capability to generate a high level of concurrency with a minimal number of threads. This is because it uses some high-performance I/O mechanisms specific to the operating system, such as select, epoll, kqueue, etc. It reuses the redis ae asynchronous event-driven framework. Precisely speaking, the ae event-driven framework was not invented by redis but comes from the Tcl interpreter jim. This small but efficient framework became more well-known because of its adoption by redis.
View the distribution of response times.
A total of 12 threads, 100 connections, lasting 30 seconds.
Indicates statistical data for a single thread, where latency represents delay time, and Req/Sec indicates the number of requests completed per second by a single thread, each having average value, standard deviation, maximum, and the proportion of plus/minus one standard deviation.
A total of 2391 requests were made within 30 seconds, with a total of 4.29MB of data read.
All threads, on average, completed 79.46 requests per second, with 146.04KB of data read per second.
6)Two Important Tools for Network Analysis
① tcpdump
The tcpdump tool can completely capture data packets transmitted over the network for analysis. It supports the filtering of network layers, protocols, hosts, networks, or port numbers, and provides logical expressions like and, or, not to help eliminate useless information. While running performance tests, tcpdump can be used to capture data for further analysis.
Ø -nn.
Indicates not resolving domain names (i.e., no reverse resolution), protocols, and port numbers within the captured packets.
Ø udp port 53.
Only displays packets where the UDP protocol’s port number (including both source and destination ports) is 53.
Ø host 123.56.135.186.
Only displays packets with the IP address (including both source and destination addresses) of 123.56.135.186. The “or” between these filters means that if either of these conditions is met, it will be displayed.
Ø 22:42:01.829302.
Timestamp.
Ø IP.
Protocol.
Ø 192.168.58.129.39735.
Source address.Source port.
Ø > .
To.
Ø 192.168.58.2.53:.
Destination address.Destination port.
Ø 49863+ A? www.3testing.com.(34).
Detailed information about the network packet.
u49863+.
The query identification value, which also appears in the response, with the plus sign indicating recursive query enabled.
uA?.
Query A records.
uwww.3testing.com.
The domain name to query.
u(34).
Message length.
② wireshark
Wireshark (formerly known as Ethereal) is a network packet analysis software. The function of network packet analysis software is to capture and as much as possible display detailed network packet data. Wireshark uses WinPCAP as an interface to directly interact with the network card for data packet exchange. When running performance tests, first use the tcpdump tool with -w to store results in a .pcap file.
tcpdump -nn host 192.168.58.129 -w web.pcap
Then start the Wireshark tool to analyze software performance. As shown in Figure 3-36.
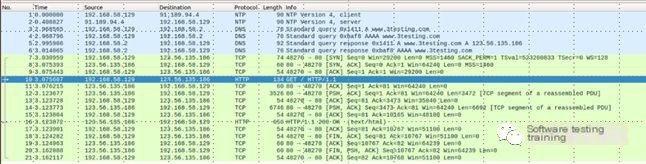
Figure 3-36 Wireshark
There is a lot of introduction material about Wireshark available online, and it won’t be detailed here.
7)Summary
The concepts involved in this section include network protocol stack, Linux network stack, and network performance metrics. The commands involved are ifconfig, ip, sar, ping, performance testing tools: ab and wrk, performance analysis tools: tcpdump, and Wireshark.
5. Performance Monitoring Tool nmon
For the Linux performance analysis tool nmon, please refer to Section 8.4.1. Generally, when conducting performance tests, this tool is used for server-side monitoring, while the aforementioned commands are used during debugging.