

Preface
One day, a colleague from the R&D center reported that the system access was abnormal and the system could not be opened from time to time. Production problems affect the normal operation of the business, so it is natural to respond urgently. So I worked with R&D colleagues to investigate and deal with it. The whole process was full of twists and turns. In summary, this case is quite interesting.
Problem Description
After sorting out the information related to the business system failure together with the R&D colleagues, the following is the summary:
- The fault phenomenon is that when business users use the system, the system occasionally cannot be opened, which occurs at irregular intervals;
- The service access path is from the Internet DMZ area to the intranet area;
- The same business system works normally in the test environment ;
- The technical support personnel of the outsourced business system are not competent and cannot provide relevant and effective information.
Because the system worked fine in the test environment, but there were problems in the production environment, the R&D colleagues suspected that there was a problem with the network from the beginning. How could they judge like this? The blame came from the sky, of course, it can’t be taken casually. After a simple understanding of the problem, the Ping and other monitoring of the servers at both ends were normal, and I felt relieved, vaguely feeling that it was not a network problem.
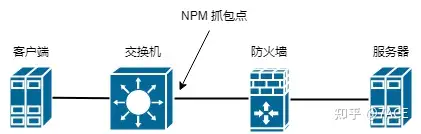
Because the network has deployed NPM in the key DMZ area (which happens to be the mirror node on the access switch where the client is located ), the traffic was traced back based on the provided failure time point and business IP communication, and substantive analysis was carried out.
Problem Analysis
Phase 1
The data packet file exported by the device is analyzed through NPM traceback . The basic information is as follows:
λ capinfos test.pcapng
File name:           test.pcapng
File type:           Wireshark/... - pcapng
File encapsulation:  Ethernet
File timestamp precision:  nanoseconds (9)
Packet size limit:   file hdr: (not set)
Packet size limit:   inferred: 70 bytes - 1518 bytes (range)
Number of packets:   6463
File size:           2174 kB
Data size:           1906 kB
Capture duration:    5990.797626192 seconds
First packet time:   2022-11-18 16:45:07.192079642
Last packet time:    2022-11-18 18:24:57.989705834
Data byte rate:      318 bytes/s
Data bit rate:       2545 bits/s
Average packet size: 294.95 bytes
Average packet rate: 1 packets/s
SHA256:              e97bbdffd9f98d0805737cb93d6d8255acd045241aa716a8af3966b0ae5ca76f
RIPEMD160:           0329186f9145dcf38fac739077219a3d93298b34
SHA1:                9a3f06a04163f388b8800889d46fe3db04453c26
Strict time order:   True
Capture comment:     Sanitized by TraceWrangler v0.6.8 build 949
Number of interfaces in file: 1
Interface #0 info:
                     Encapsulation = Ethernet (1 - ether)
                     Capture length = 2048
                     Time precision = nanoseconds (9)
                     Time ticks per second = 1000000000
                     Time resolution = 0x09
                     Number of stat entries = 0
                     Number of packets = 6463
The packet file was downloaded through NPM backtrace analysis, and was specifically filtered based on IP communication pairs and processed by TraceWrangler anonymization software. The total capture time was 5990 seconds, the number of packets was 6463, and the rate was 2545 bps, which is very low.
1. For an introduction to TraceWrangler anonymization software, please refer to the previous article
“Wireshark Tips and Tricks | How to Anonymize Data Packets” ;2. Another special thing is that
Packet size limit: inferred: 70 bytes - 1518 bytes (range)generally speaking, the truncation based on snaplen should be a unified value, that is, the length of all data packet captures should be the same, rather than a range value. This is the reason why the NPM backtracking analysis device handles the settings.
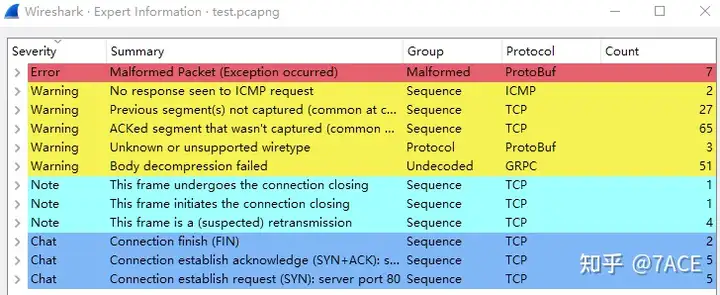
The expert information is as follows. There are some Error problems in protocol parsing , as well as Warning problems such as previous segments not being captured and ACK confirming segments that were not captured. Considering the phenomenon, it is more about packets not being captured, which is not a problem.ACKed unseen segment
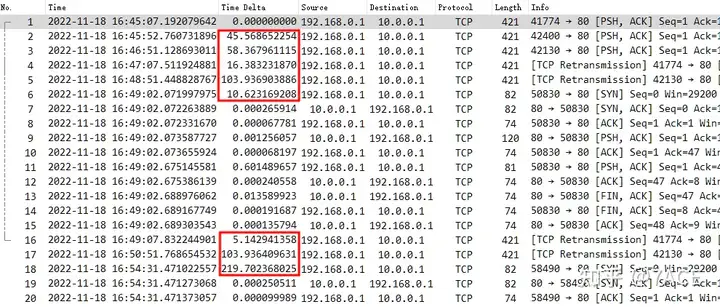
At the failure time node 16:45 – 16:48 provided by the business, the relevant data packet details are expanded as shown below. It can be clearly seen that the client 192.168.0.1 sends data packets at a long interval.
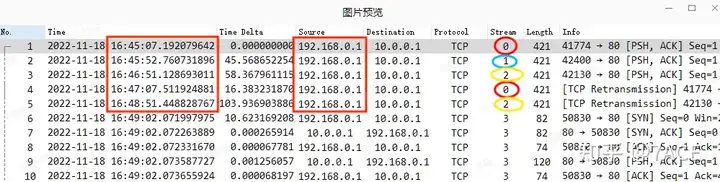
If you add the TCP flow information column, you can see that they belong to different TCP data flows (this is related to business applications and will not be discussed in detail). The interval time between uploading and downloading data packets in a single flow is longer.
During the communication, the business reported another abnormality that the data packet could not be opened, so we extended the packet capture time, filtered according to the client’s source address, and increased the interval time to sort from large to small, which was basically all large time intervals. However, the overall observation of the rules showed that the fixed time intervals (such as 60s) in some flows were more like the application logic of the GRPC call itself, and did not seem to be the fundamental problem.
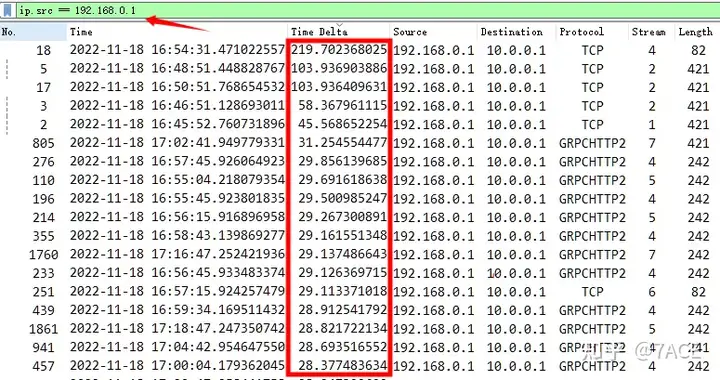
Therefore, based on the information at this stage, the advice given to the R&D colleagues was to check the client 192.168.0.1, because it fell into silence at the time of the failure and no data packets were sent, which seemed to be the problem.
Phase 2
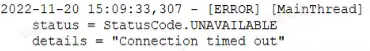
The R&D colleagues returned with questions and suggestions, and communicated with the technical vendor for two or three days, but no substantial cause was found, and the problem still occurred from time to time. Then they came back with questions, saying that the client request in the DMZ area was indeed sent, but the server could not receive it, and emphasized the time when the failure first occurred every day. There would be an abnormal phenomenon when entering the system for the first time. The phenomenon in the application showed that the request was sent when clicking the page, but the interface was always pending, and the error log Connection timed out.
Based on the above phenomenon, the packet trace file was taken again . From the perspective of the data packet, no data packet was generated at around 11-20 15:09:33. Considering that the location of the captured data packet is on the access switch where the client is located, the client has been saying that it has sent a request, but the direct switch did not see the relevant data packet when it sent it out. This is really far-fetched. Could it be that the direct connection lost packets…
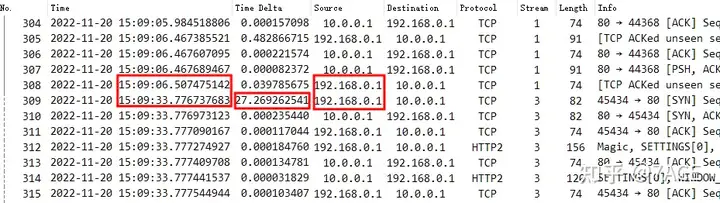
The packet capture on the switch indeed showed no data packets from 15:09:06 to 15:09:33, so we insisted on the previous conclusion, checked the client application , and requested to capture the packets directly on the client when the fault occurred to verify whether the client request was sent.
Phase 3
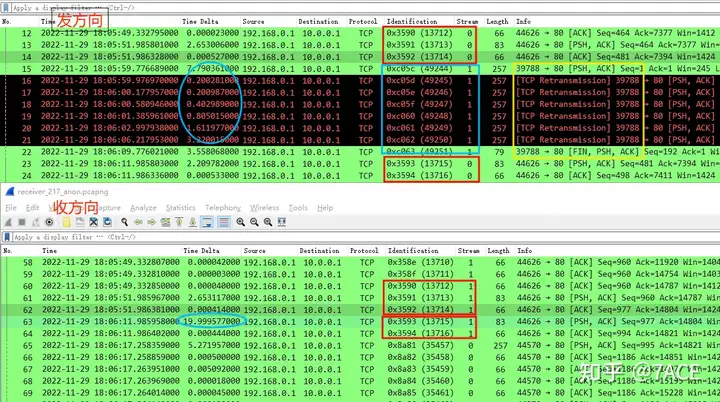
Here it comes, R&D came with local data packets and captured packets on both the client and server ends (did client->server unidirectional filtering). They said that when the system failed and could not be opened, it was obvious that the client sent a request, but the server did not receive it.
The comparison of the data packets sent by the client and received by the server is as follows:
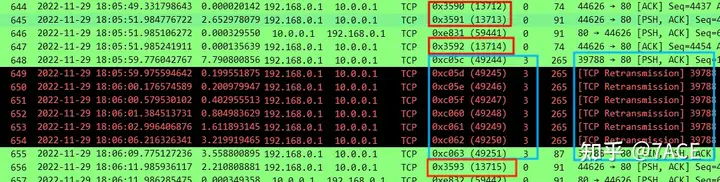
1. It can be seen that for the same TCP data stream (connected by ip.id), there is another TCP data stream 0xc05c – 0xc063 between the consecutive data packets 0x3590-0x3592 and 0x3593-0x3594 in the sending direction, but in the receiving direction, there are only data packets 0x3590-0x3594, and no data packets of another TCP data stream exist;
2. This TCP data stream is just the PSH/ACK data packet sent by the client 192.168.0.1. Because the server did not receive it, it could not return the confirmation ACK. Therefore, the client retransmitted it 6 times in total, and then FIN ended the connection.
3. After that, the previous TCP data stream started to transmit the data packets after 0x3593, with a full interval of nearly 20 seconds.
This is a speechless incident. Is it really a slap in the face? . The network switch lost packets? This is unscientific. Since there is an interaction between the client and the server, then if we trace back in NPM, is it the same phenomenon? Through the NPM traceback in the figure below, we found that the phenomenon is indeed the same. We also saw another data stream sent by the client. It can be seen that the upper switch forwarded the data packet normally. Could it be that there was packet loss in the subsequent network path ? This is impossible.
At this point, we slowly sorted out the fault phenomena and data packets in the three stages and came to the following conclusions:
1. The conclusion of phases one and two is that there is a problem with the client, the sending interval is long, and no request is sent when there is a suspected system failure. However, an important problem was actually overlooked at that time. No response packets were seen from the server. Regardless of whether there is a problem with the client or not, the server will at least respond when receiving the request.
2. In phase 3, from the packet capture on the client, upper switch, and server, it is clear that the client did send and retransmit the request, but the server did not receive it. Combined with the occasional fault phenomenon, it is unlikely that the network switch lost packets, because the switch would not specifically drop a certain TCP data stream.
3. When the failure occurs, another data stream must start to be transmitted. It is not generated out of thin air, but starts directly with PSH/ACK, which means that the connection has always existed before. Then what kind of interaction will this data stream have? !
With the above questions, I traced back one hour of data on NPM, that is, the data packets from 17:00 to 18:05 when the fault occurred, and found an important phenomenon. During such a long period of time, the data flow was empty, and there was no data packet interaction. Only a few data packets 0xc05c – 0xc063 were generated in one direction on the client at the time of the fault, and the FIN connection was terminated after no response. At this point, I suddenly understood the problem. I had always overlooked a key link, the firewall . When I thought of the firewall, I reviewed the entire troubleshooting process and finally located the cause. The summary is as follows:
1. The system application is a long-connection application, but the keep-alive mechanism is not enabled at the application layer and TCP layer . After the TCP connection is idle for a certain period of time, the maximum idle time limit of the firewall session is reached. Therefore, the firewall dismantles the session, but the client and server still maintain the connection, and there is no good termination mechanism;
2. According to business feedback, the first time the failure occurs every day, there will be an abnormal phenomenon when entering the system for the first time, which means that the data packet continues to be sent on the original long connection, but because the firewall does not have this session information, the data packet is discarded, and the server cannot receive it normally. After the client repeatedly retransmits and fails, FIN closes the connection.
3. After the business personnel exit the system application and log in again, it can be opened normally. However, if there is no operation, that is, it is idle for too long, the firewall will still delete the session and the system will not be opened when used again. So this is the problem of occasional system access failure reported by the business.
Summary of the problem
Because the firewall was not maintained by the network group, it was later transferred to the security group for processing. Later, it was learned that the idle session time limit (the default setting is one hour) was adjusted separately for the application IP communication pair on the firewall. At this point, the business system returned to normal.