Here’s a situation that every system administrator is familiar with. An employee tells you they can’t use certain network services. However, they can’t provide you with any specific data, such as the exact time they were unable to access which service, or if it was the same server connection.
How do you solve this issue? By using the Allegro Network Multimeter, you can narrow down the cause of the failure within minutes, and then take corrective action.
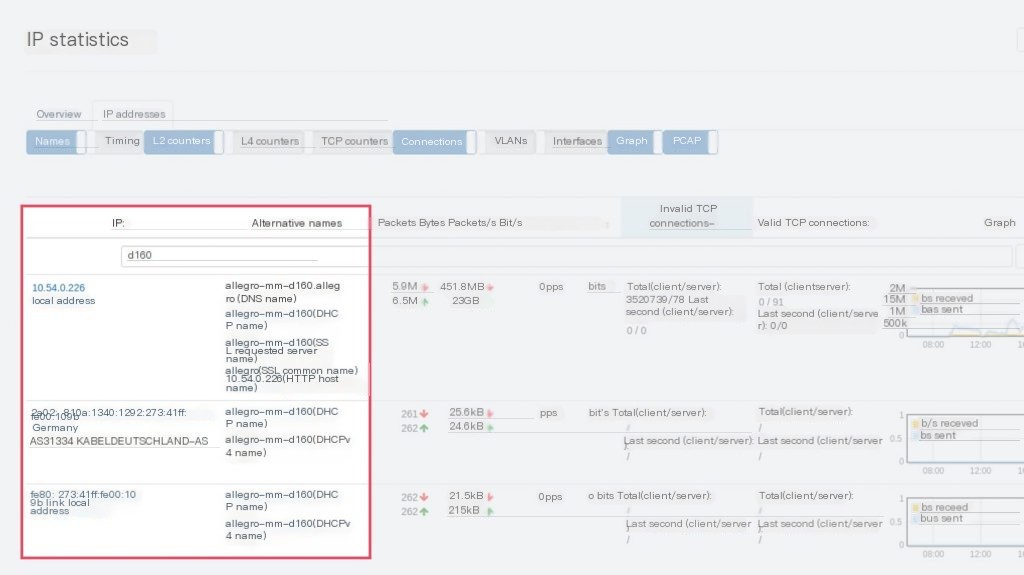
Start by searching for the user through the browser-independent web interface. This can be intuitively done by entering the user’s name in the full-text search in the IP address list of the central IP section. The matching computer will be immediately displayed.
 />
/>
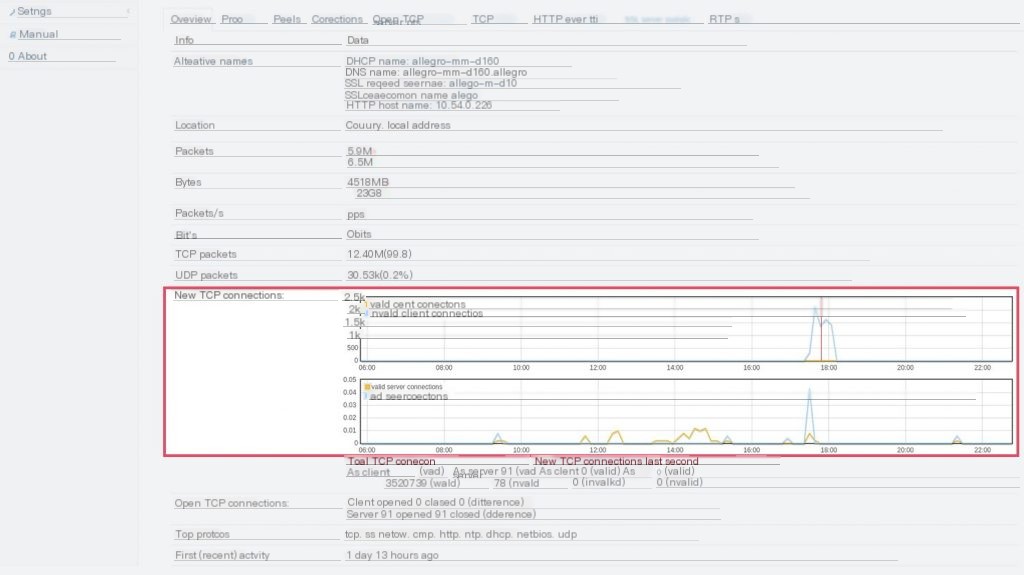
Click to select the computer related to the employee. The detailed view that opens now contains a wealth of information segmented by different tabs. Go to the overview page and check the problematic server connections.
These “invalid connections” are shown in blue in the “New TCP Connections” chart. By default, current server connections are displayed. If you zoom in, the time interval expands to show the past few hours. A significantly large number of problematic server connections occurring at certain times will become immediately apparent.
 />
/>
Accurately Locating Problematic Server Connections
To examine the potential problematic server connections more closely, click a peak to restrict the time range to this interval. Similarly, zooming in several times can display a very short time interval.
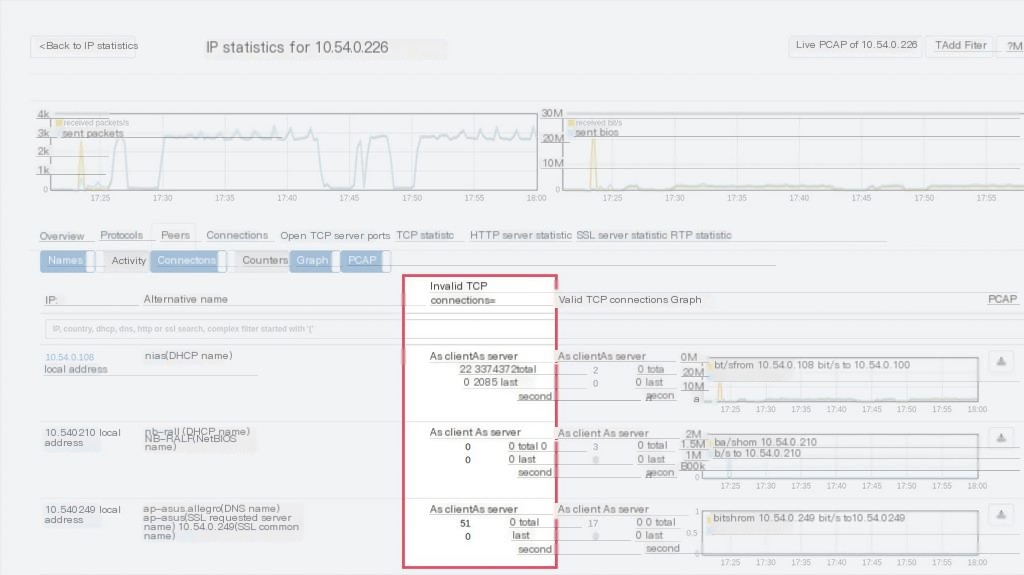
Switch to the “peers” tab, and you can now see the servers contacted during the relevant time interval. Sorting by “invalid connections” again allows you to immediately see the servers with the most errors (see screenshot). For a more detailed understanding of why the server connections are not working, you can now start recording for the selected time and IP pair from the browser. You can opt for the traditional pcap download for later investigation or using Wireshark. Alternatively, you can further analyze directly in the browser by clicking the Webshark preview, generating a Wireshark-like display of pcap. Click the download button to choose the analysis tool Webshark or start downloading pcap.
Therefore, despite vague user information, you can still identify the affected server in seconds and conduct a detailed examination of the failure by isolating the network traffic.