To understand a knowledge point, we must first quickly establish a conceptual model for this knowledge point. Similarly, if we want to fix packet loss, creating a conceptual model helps us identify the potential causes and systematically address them. After developing this model, constantly adding details will aid in grasping both the essence of knowledge and the nuances of packet loss issues.
What is Bandwidth?
It is crucial to fix packet loss in understanding how bandwidth, the ability of the network to transmit data, is impacted. This process involves examining the network card’s capacity to transfer network packets to and from the kernel buffer and network card buffer. Additionally, factors such as the receive window or congestion window play significant roles. Essentially, if there is a decrease in the receiving capacity at the other end, the bandwidth cannot increase, highlighting the importance of how to fix packet loss in network performance.
When the link of the entire network becomes longer, the network situation is very complicated. Network packets may pass through multiple routers or lines between different operators to exchange data, and the network traffic between different agents is extremely large, which will cause your network packets to be lost or retransmitted. Given this situation, when deploying service nodes, if you can design links, it is best to avoid such network exchanges between different agents and optimize the link selection capability of the entire network transmission. This is also one of the principles of CDN to provide global acceleration.
The principle of CDN is to be able to deploy many nodes all over the world, and then the link selection between each node is carefully arranged by the service operator. It can ensure that the links of your entire network are optimized, which can reduce the loss or retransmission of your network packets.
Process of Sending and Receiving Network Packets
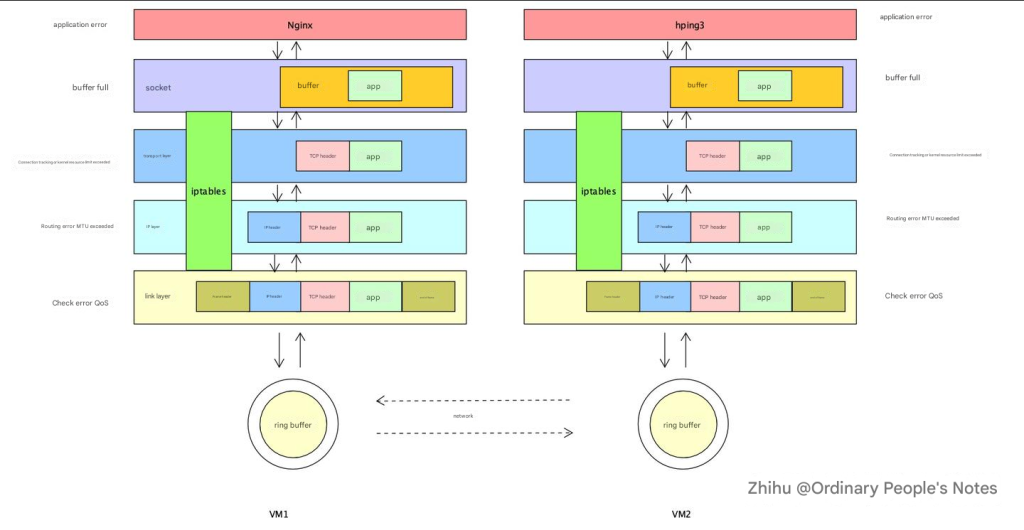
We need to understand how a network packet passes through the application.

Generally, an application initiates a network request. The data of this network request will be written to the kernel’s socket buffer. The kernel will then add a TCP header or UDP header to the data in the socket buffer. It will then pass through the IP layer and add another IP header. In the middle, the network packet will be filtered by a series of firewall rules to see whether it should be discarded or continue to be sent to the network card. After finally reaching the link layer, the network packet will be sent to the ring buffer on the network card via the link layer, and finally sent by the network card to the entire network. Packet loss may occur in each link.
Understanding the process of sending and receiving network packets and establishing such a conceptual model will help us fix packet loss issues.
Fix Packet Loss by Measuring the Quality of Network Conditions
When monitoring application services, how to measure the quality of network conditions is generally also used to measure the quality of hardware resources.
As a general routine, we usually first look at the performance of network indicators at the system level, then see which specific process causes the abnormal performance, and then locate the problem code.
Specifically for the network, how do we look at the quality of the network from a system level or what tools do we use?
From the system level, there are several important indicators of the network. MBS represents how many M bytes the network card sends or receives per second, and Mbps represents how many M bits per second. The unit of bandwidth is usually Mbps. Generally, if the bandwidth is 100M, the conversion to MBS is Mbps divided by 8.
When choosing a server node, in addition to bandwidth, there are also apps, which is the number of packets sent and received per second, which is also limited.
When we encounter network performance problems, we can first observe whether these two indicators on your machine node have reached a bottleneck state. If the bandwidth is only 100Mbps, and then use the tool to check the node bandwidth on the machine, when it is about to exceed this value, the bandwidth has likely become a bottleneck at this time, and the machine quota may need to be upgraded.
sar
# Use sar to count the activity of the network interface once a second, and display it 5 times in a row

sar -n DEV 1 5
- IFACE is the name of the network card interface
- rxpck/s, txpck/s The number of packets received or sent per second
- rxkB/s, txkB/s The number of bytes received or sent per second, in kB/s
- rxcmp/s, txcmp/s The number of compressed packets received or sent per second
- rxmcst/s Multicast ( multicast is a point-to-multipoint communication) packets received per second
After looking at the network situation at the entire system level, we can look at this issue more carefully from the perspective of the process.
iftop
# https://www.tecmint.com/iftop-linux-network-bandwidth-monitoring-tool/

yum  -y install libpcap libpcap-devel ncurses ncurses-devel

yum install epel-release

yum install -y iftop

iftop -P

It can list the Mbps of each link in the system and find out which IP consumes the most traffic. Most of the time, it is not the system network that has reached a bottleneck, but the process’s ability to process network packets cannot keep up.
nethogs
yum install nethogs

# Check the bandwidth usage of the process
nethogs ens33
List the data of the sent and received traffic of each process and find out which process consumes the most traffic, which will make it easier for us to locate the problem of which process.
The go trace tool can analyze the delay problems caused by network scheduling. It can also indirectly provide feedback that your program may be performing frequent network scheduling on a certain piece of code. It is possible that after frequent scheduling, it consumes more bandwidth, which may indirectly reflect that the delay will be slightly increased. go trace can also allow us to indirectly find a problematic code in network performance issues.

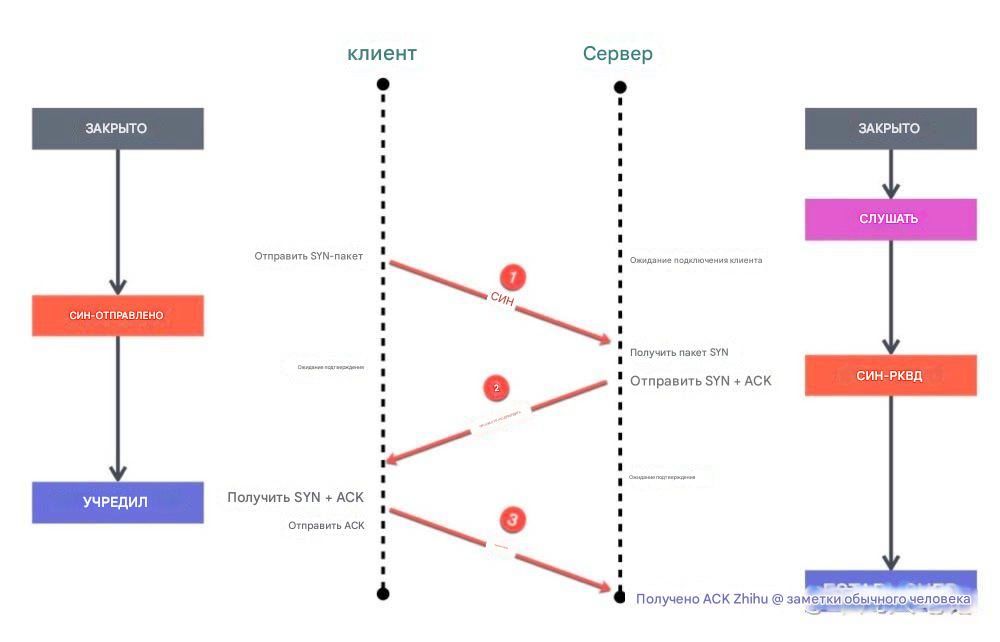
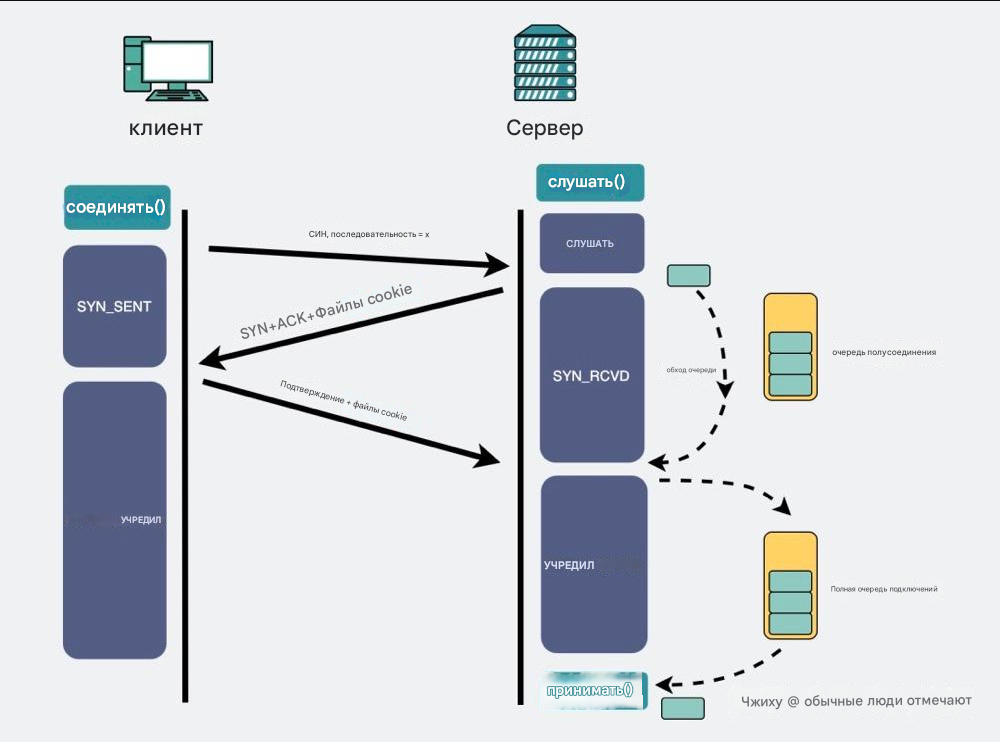
One of the more important points in network performance is how to find and fix packet loss problems. For the above figure [network packet transmission process], analyze it from top to bottom. First, look at the application layer. When listening to the socket through the listen method, there will be two queues during the three-way handshake. First, when the server receives the syn packet from the client, it will create a semi-connection queue. This semi-connection queue will put those connections that have not completed the three-way handshake but have sent a syn packet into it and will reply to the client with a syn+ack. After the client receives the ack and syn packet, it will reply to the server with an ack. At this time, the kernel will put this connection in the full-connection queue. When the server calls the accept method, it will take this connection out of the full-connection queue. So this involves two queues. If these two queues are full, packet loss may occur.


First, let’s look at the semi-connection queue, which is determined by kernel parameters and can be adjusted. A connection can only be established through a three-way handshake, but since this queue mechanism is likely to cause the queue to be full and then drop packets when the concurrency is large, the kernel provides a tcp_syncookies parameter, which can enable the tcp_syncookies mechanism. When the semi-connection queue overflows, it allows the kernel to not directly discard the new packet, but reply with a packet with syncookie. At this time, when the client requests the server again, it will verify the syncookie, which can prevent the service from being unavailable when the semi-connection queue overflows.
How to determine whether packet loss is caused by overflow of the semi-connection queue?
By searching for TCP drop in the log through dmesg, we can find and fix packet loss. dmesg is a kernel log record, and we can find some kernel behaviors from it.
dmesg|grep "TCP: drop open erquest form"Then see how to view the full connection queue. Through the ss command, you can see the size of the full connection queue when your service is listening.
ss -lnt

# -l shows listening
# -n does not resolve service name
# -t only shows TCP socket
For your listening service, its Send-Q represents the current full connection queue length, that is, the TCP connection that has completed the three-way handshake and is waiting for the server to accept(). Recv-Q refers to the size of the current full connection queue. The above output shows that the maximum full connection length of the TCP service listening to port 9000 is 128. Recv-Q is usually 0. If there is a situation greater than 0 and it will last for a long time, it means that your service is slow in processing connections, which will cause the full connection queue to be overfilled or discarded. At this time, your service should speed up its ability to process connections.
For connections with a status of ESTAB, the ss command does not look at your listening service, but at indicators related to an established connection. Recv-Q represents the number of bytes received but not read by the application, and Send-Q represents the number of bytes sent but not confirmed. Through these two indicators, you can see whether the application is slow in processing data, or whether the client is slow in processing received data. Generally, these two values are both 0. If one of them is not 0, you may need to check whether it is a client problem or a server problem.
When the connection queue is full, the kernel will discard the packet by default, but you can also specify another behavior of the kernel. If the value of tcp_abort_on_overflow is set to 1, a reset packet will be sent directly to the client to disconnect the connection, indicating that the handshake process and the connection are abolished.
After passing through the application layer, the network packet will reach the transport layer, where there will be a firewall. If the firewall is turned on, the connection tracking table is related to the firewall: nf_conntrack. Linux will generate a connection record for each data packet passing through the kernel network stack. When the server processes too much, the connection tracking table where the connection record is located will be full, and then the server will discard the data packet of the newly connected connection. Therefore, sometimes packet loss may be caused by the firewall’s connection tracking table being designed too small.
How to view the size of the connection tracking table?
# View the maximum number of connections in the nf_conntrack table

cat /proc/sys/net/netfilter/nf_conntrack_max

# View the current number of connections in the nf_conntrack table

cat /proc/sys/net/netfilter/nf_conntrack_count
Through this file, you can see the maximum number of connections in the connection tracking table, nf_conntrack_max. Therefore, when packets are lost, you can check this part to see if the connection tracking table is full.
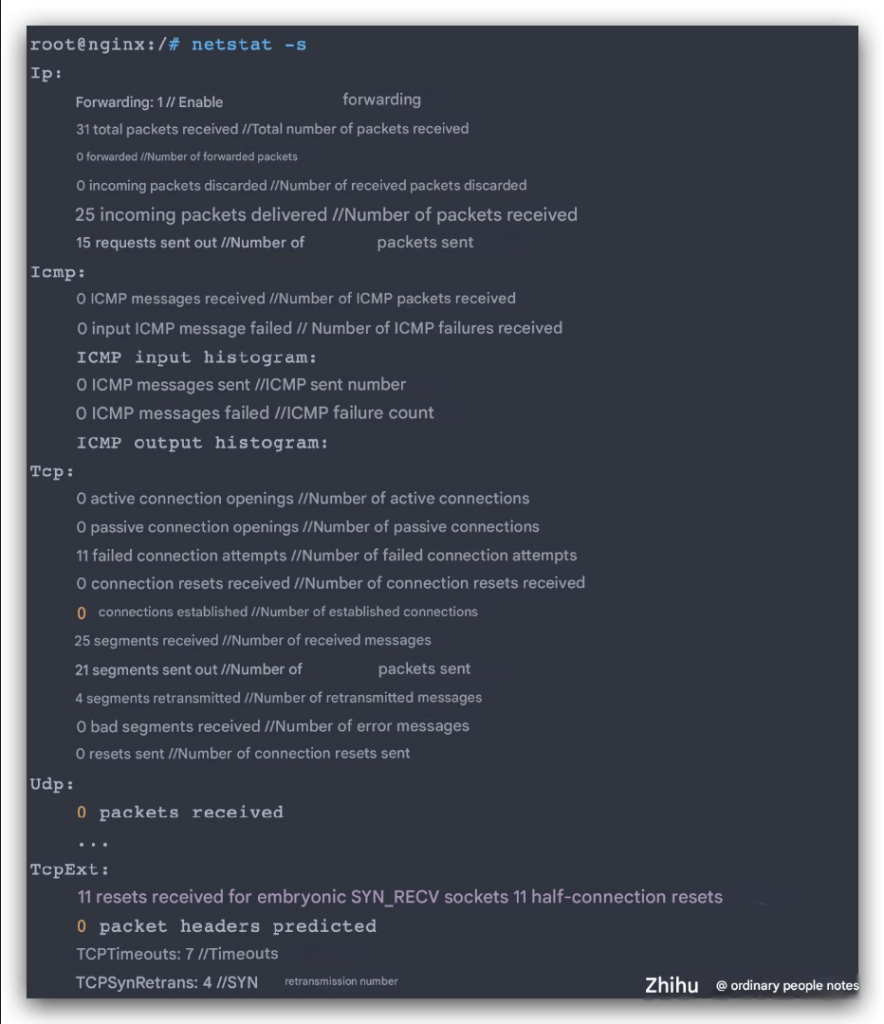
After the network packet passes through the transport layer, we look at the network layer and the physical layer. When it comes to the network layer and the physical layer, we have to look at the network card. Through the netstat command, you can see the packet loss and packet reception of the network card on the entire machine.
If the RX-DRP indicator data is greater than 0, it means that the network card has packet loss. The data recorded here is the data from the startup to the present, so when analyzing, check whether this indicator has increased at regular intervals.
The RX-OVR indicator shows the discarding behavior that occurs when the ring buffer of this network card is full.
Netstat can be used to analyze and fix packet loss of the network card.
# netstat can count network packet loss and ring buffer overflow

netstat -i
netstat can also count the packet loss at the network protocol layer.

MTU
When the network packets of the application layer pass through the network layer, they will be divided into packets and sent according to the size of the data packets.
When the size of the TCP data packet is sent to the network layer, the network layer finds that the packet is larger than its MTU value, and the packet will be split. When setting up the network card, it will be set as your transport layer packet. If it is larger than the MTU value, the network packet can be directly discarded. This is also a packet loss problem that is often encountered in real life.
When fix packet loss, if the link is long, it might be challenging to assess, but with a short link, you can more easily determine the MTU of the entire connection and verify whether the MTU settings of each network card across the link differ. If there is a discrepancy, it might lead to packet loss, as the forwarding of a packet depends on the MTU value configured on the network. For instance, if the value is set larger than the MTU, the packet could be discarded. Additionally, if the size of the sent MTU packet exceeds the limit specified by the network card and the card doesn’t permit fragmentation, packet loss will occur.


