Background
Many articles have addressed the issue of slow application transmission, which is a common challenge in network performance. However, pinpointing where and why the slowdown occurs is often tricky, particularly when relying solely on network packet analysis. The broad definition of applications and the specialized nature of different technologies make it challenging to identify root causes without extensive expertise. Full-stack professionals may excel in their own domains but often find it difficult to tackle every technical aspect of slow transmission issues.
In this case, we focus specifically on a slow HTTP file transfer—a problem often encountered in network protocol analysis. The underlying cause here is not particularly unique, but the packet captures taken simultaneously from both the client and server reveal interesting contrasts in how the data can be interpreted. By looking at both perspectives, we can better understand the process and identify effective solutions.
This analysis is based on a case study from SharkFest 2019, titled “Troubleshooting Slow Networks.”
Problem Information
The basic information of the trace file is as follows:
λ capinfos "Exercise *.pcapng"
File name:           Exercise 1_tcp-slowtransfer-client.pcapng
File type:           Wireshark/... - pcapng
File encapsulation:  Ethernet
File timestamp precision:  microseconds (6)
Packet size limit:   file hdr: (not set)
Number of packets:   1098
File size:           1159 kB
Data size:           1121 kB
Capture duration:    0.841554 seconds
First packet time:   2011-06-27 23:07:28.687320
Last packet time:    2011-06-27 23:07:29.528874
Data byte rate:      1332 kBps
Data bit rate:       10 Mbps
Average packet size: 1021.39 bytes
Average packet rate: 1304 packets/s
SHA256:              33d7e7d717e35777942e112d94b88db84a9f6ea366e5c29fcbbcd602481caa02
RIPEMD160:           8fb7fdf74b72310a1199b093618d691428563c91
SHA1:                c388865c714612dca27797a134ca9f9234818d16
Strict time order:   True
Capture application: Editcap (Wireshark) 3.0.1 (v3.0.1-0-gea351cd8)
Capture comment:     Sharkfest 2019 - Exercise 1.   This was a slow file transfer. Let's troubleshoot.   1. What is the highest throughput that this file transfer can achieve? Acceptable? 2. What is the network roundtrip time between client and server? 3. Is there any packet loss in this trace file?  4. In the handshakes, what TCP options are there? Which ones are missing?  5. What do you think the reason for the low throughput was?   Use Example 2 to validate your findings.      This work is licensed under the Creative Commons Attribution-NonCommercial-NoDerivatives 4.0 International License. To view a copy of this license, visit http://creativecommons.org/licenses/by-nc-nd/4.0/ or send a letter to Creative Commons, PO Box 1866, Mountain View, CA 94042, USA.  This packet capture file is provided by:  Name    : Sake Blok E-mail      : [email protected] Twitter  : @SYNbit Web   : www.SYN-bit.nl  If you would like to use this file in any other way than is permitted by the "CC BY-NC-ND 4.0" license, please contact me.
Number of interfaces in file: 1
Interface #0 info:
                     Encapsulation = Ethernet (1 - ether)
                     Capture length = 65535
                     Time precision = microseconds (6)
                     Time ticks per second = 1000000
                     Number of stat entries = 0
                     Number of packets = 1098

File name:           Exercise 2_tcp-slowtransfer-server.pcapng
File type:           Wireshark/... - pcapng
File encapsulation:  Ethernet
File timestamp precision:  microseconds (6)
Packet size limit:   file hdr: (not set)
Number of packets:   1098
File size:           1159 kB
Data size:           1121 kB
Capture duration:    0.841489 seconds
First packet time:   2011-06-27 23:07:24.313428
Last packet time:    2011-06-27 23:07:25.154917
Data byte rate:      1332 kBps
Data bit rate:       10 Mbps
Average packet size: 1021.39 bytes
Average packet rate: 1304 packets/s
SHA256:              8a1f6e89f9b8535c6d8b7293ecb57f21cd9a1c445a45fb27078ceb2d9af7a78e
RIPEMD160:           a31d97b6f5211160836abd4a6f576d20b1171b4f
SHA1:                a52f180d6302582f38250a362ed31c6b0e35c3af
Strict time order:   True
Capture application: Editcap (Wireshark) 3.0.1 (v3.0.1-0-gea351cd8)
Capture comment:     Sharkfest 2019 - Exercise 2  This is the server side of the same file transfer. Let's see how this perspective can help.   1. Look at the handshake, what is the network latency? What TCP options are missing?  2. What is the highest level of throughput acheived?  3. What TCP errors do we see? How can we interpret these? Is the server doing something wrong?  4. Why don't we see this in the client side trace file?      This work is licensed under the Creative Commons Attribution-NonCommercial-NoDerivatives 4.0 International License. To view a copy of this license, visit http://creativecommons.org/licenses/by-nc-nd/4.0/ or send a letter to Creative Commons, PO Box 1866, Mountain View, CA 94042, USA.  This packet capture file is provided by:  Name    : Sake Blok E-mail: [email protected] Twitter     : @SYNbit Web   : www.SYN-bit.nl  If you would like to use this file in any other way than is permitted by the "CC BY-NC-ND 4.0" license, please contact me.
Number of interfaces in file: 1
Interface #0 info:
                     Encapsulation = Ethernet (1 - ether)
                     Capture length = 65535
                     Time precision = microseconds (6)
                     Time ticks per second = 1000000
                     Number of stat entries = 0
                     Number of packets = 1098
The packet trace files were captured simultaneously via Wireshark, and the basic information remained consistent, with 1098 packets, 1159k bytes of file size, 0.84 seconds of capture, and an average rate of 10 Mbps. At the same time, some modifications were made via Editcap, and descriptions were also added to both files, including problem information and CC BY-NC-ND 4.0 license instructions.
There is not much research on the CC
Creative Commons License Agreement . The copyright of the data package file still belongs to the author Sake Blok. This article is only used for learning and analysis.
Client data package file, the problem information is as follows:
- What is the highest throughput that this file transfer can achieve? Acceptable?
- What is the network roundtrip time between client and server?
- Is there any packet loss in this trace file?
- In the handshakes, what TCP options are there? Which ones are missing?
- What do you think the reason for the low throughput was?
The server-side data packet file has the following problem information:
- Look at the handshake, what is the network latency? What TCP options are missing?
- What is the highest level of throughput acheived?
- What TCP errors do we see? How can we interpret these? Is the server doing something wrong?
- Why don’t we see this in the client side trace file?
Problem Analysis
Client
First, start with the client “Exercise 1_tcp-slowtransfer-client.pcapng” packet trace file. Expand the packet information as follows. You can see the packets of the standard TCP three-way handshake phase, as well as the packets of HTTP GET request and data response transmission, and finally end with the FIN four-wave packet.


1. In the figure above, the HTTP response 200 OK appears so late in a TCP stream. After completing a request and response, the connection is terminated with FIN. Therefore, the calculated
http.time will appear to be very large. In fact, you can modify the judgment logic of Wireshark through options. For details, see
“Wireshark Tips and Tricks | Time Analysis” .2.
http.timeIt is the time field in the HTTP protocol (Time since the request was sent), which indicates the time interval from the HTTP request to the response. More specifically, it is the time difference between the timestamp of the HTTP request and the timestamp of the HTTP response.
The expert information is as follows. It is unusually concise and contains no Warning-related information. This shows that the slow transmission problem is not caused by the common retransmission caused by packet loss.

The TCP session integrity analysis tcp.completeness == 31also explains the relevant information of the TCP session: 31 = 1 + 2 + 4 + 8 + 16, where 1 is SYN, 2 is SYN/ACK, 4 is ACK, 8 is DATA, and 16 is FIN.
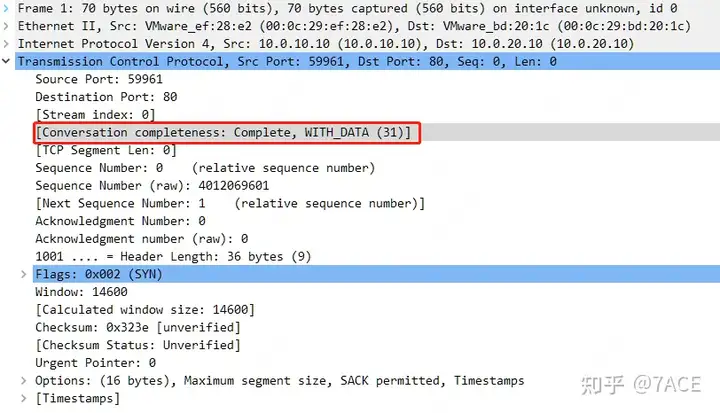
For detailed instructions on TCP session integrity analysis, see
Cutting straight to the problem in the packet trace file, the explanation is as follows:
- What is the highest throughput that this file transfer can achieve? Acceptable?
According to the I/O graph and Throughput graph, the basic file transfer rate is about 10Mbps. Is this acceptable? Probably not…
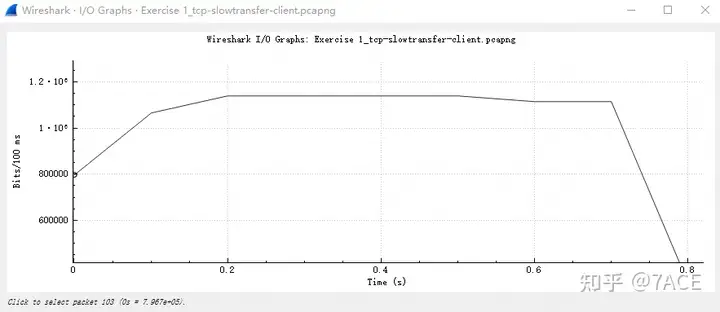
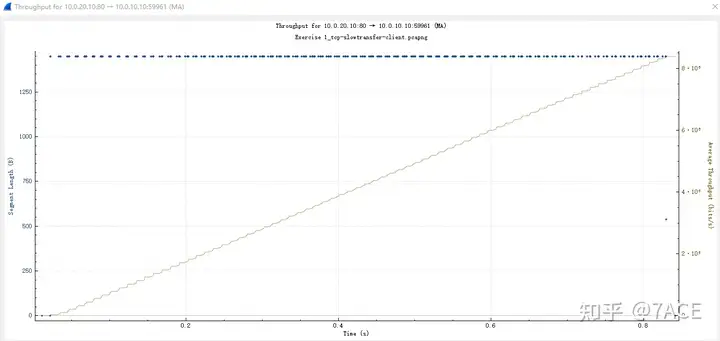
2. What is the network roundtrip time between client and server?
The RTT diagram is as follows. As for IRTT, it is 0.010904 seconds based on the TCP three-way handshake time.
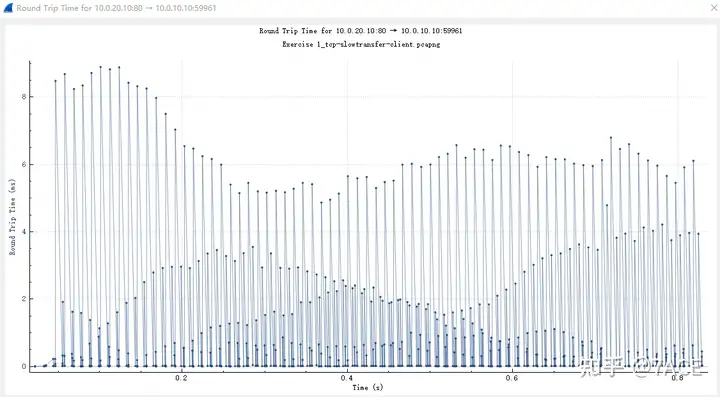
3. Is there any packet loss in this trace file?
No, you can get the result by filtering with display filter expressions such as and tcp.analysis.lost_segment.tcp.analysis.retransmission
4. In the handshakes, what TCP options are there? Which ones are missing?
TCP options are shown in the figure below. What is missing is the common Window Scale, which is not available on both the client and server sides.

5. What do you think the reason for the low throughput was?
The reason for low throughput can actually be judged to be a problem with the TCP receive window , that is, the lack of the Window Scale factor, which makes it impossible to increase the amount of data transmitted, and the window is full or nearly full.
But from the client’s perspective, why can’t we see the window full phenomenon? We can see that the phenomenon is always the standard 2 MSS + 1 ACK. Similarly, the size of the data segment in the Tcptrace diagram is still far from the client’s receive window. After all, the client immediately confirms that it has received it, and the upper layer of the application processes it in a timely manner, so the size of the Win notified to the outside world has always remained at a relatively fixed value.

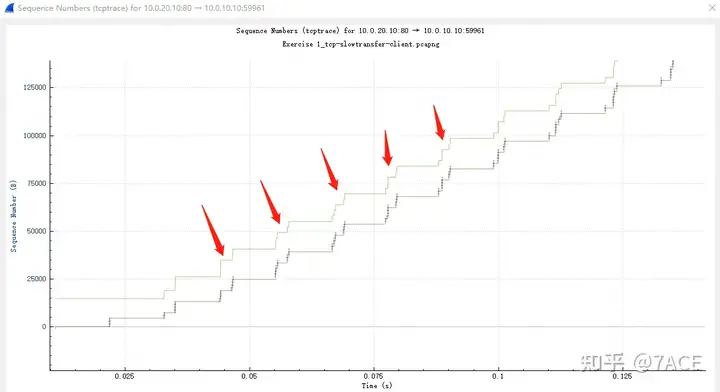
Therefore, the next step in analyzing the problem requires taking a different perspective and turning to the server side.
Server Side
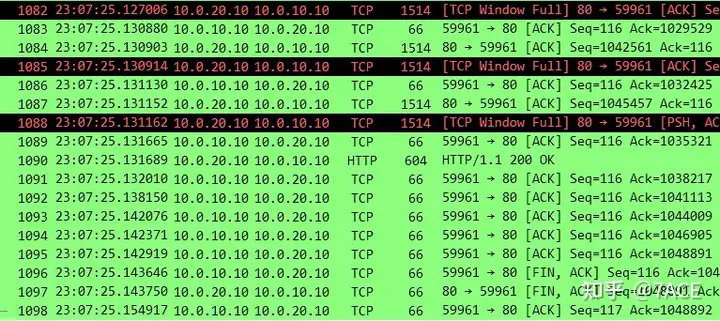
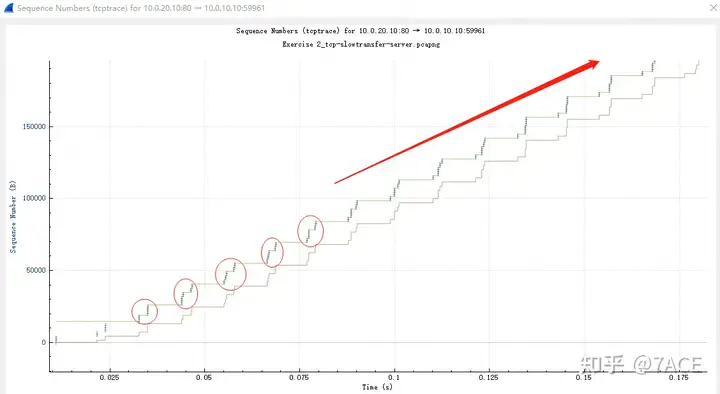
Open the server-side “Exercise 2_tcp-slowtransfer-server.pcapng” packet tracing file and expand the packet information as shown below. The problem is very obvious, including the clear prompt in the TCP expert information and Warning: TCP window specified by the receiver is now completely fullthe total number of times reported as 355 times, basically from the beginning to the last stage of data transmission.

From the Tcptrace diagram, we can clearly see that the data segments sent by the server have reached the upper limit of the receiving window of the client, which is the receiving end.
Back to the packet details, before TCP Window Fullthe alarm occurred on the server side, the last client ACK received was No.21, and its ACK 7241 only confirmed the data segment of the server No.11 (Seq 5793 + Len 1448 = 7241). Since the last client No.18 ACK 5793, it only confirmed a data segment of size 1448, and the Win announced in the ACK was 11584.
At this point, the server understands that the number of bytes in transit of the data packet sent by No.20 is 10136. It receives confirmation of a 1448-byte data segment from No.21, and the client notifies me that its receive window is 11584. So how many more bytes can the server send? It is exactly 11584 – 10136 + 1448 = 2896, which is exactly two Len 1448 data segments, that is, No.22 and No.23 in the figure. They are exactly full, so No.23 will have TCP Window Fullan alarm.
Then it follows a fixed pattern. The client’s No.24 ACK confirms two segments (10137-7241=2896), and Win is still 11584 in size. The server can only send two Len 1448 data segments, which are No.25 and No.26 in the figure. They are full again, so No.26 will have TCP Window Fullan alarm, and the same process is repeated as follows.
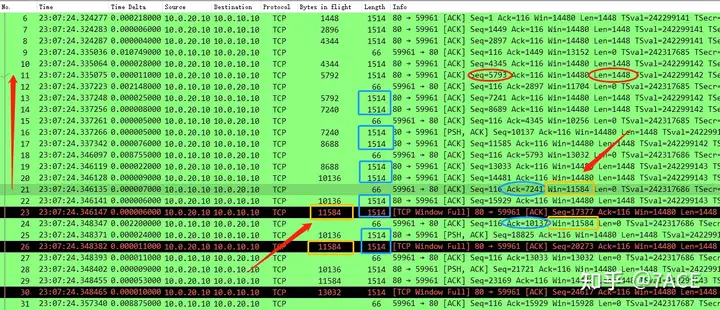
At this point, the root cause of the slow HTTP file transmission has been found. It is the lack of support for the Window Scale factor in TCP options that makes it impossible to enlarge the receive window. The data sent by the data sender reaches the upper limit of the receive window. The client needs to confirm xx data before sending a few more based on the Win size. The overall slowness is due to the receive window size and the RTT processing waiting time.
As for the several questions in the server-side packet trace file , I think the answers have been explained in the above analysis process and I will not repeat them here.
- Look at the handshake, what is the network latency? What TCP options are missing?
- What is the highest level of throughput acheived?
- What TCP errors do we see? How can we interpret these? Is the server doing something wrong?
- Why don’t we see this in the client side trace file?
Summary of the problem
In fact, data packet analysis in some scenarios does need to be captured at multiple points, including the sender or receiver, or even multiple nodes in the middle of the path, which is more helpful for analyzing network problems. Although the root cause of the problem is simple, how to locate and troubleshoot based on your own understanding and how to reverse the phenomenon of data packets still requires continuous practice and summary.


