When your application runs slowly, it’s common to blame the database queries for the poor SQL Server performance. While issues such as missing indexes or unnecessary locks can certainly cause delays, other factors like the network and the application itself could also be responsible. Dan Turner emphasizes that you can save significant time and resources by first determining the root of the problem before delving into specifics.
Slow applications first affect the end-users, but the whole team will quickly feel the impact, including DBAs, Dev teams, network administrators, and the system administrators looking after the hardware.
With so many people involved, each with their own perspectives and possible reasons, it can be difficult to pinpoint where the bottleneck is.
Generally, there are two main causes of SQL Server application performance problems:
In this article, we will detail how to diagnose these problems and understand the underlying performance issues.
Network Issues
Network performance problems broadly break down into issues related to network response speed (latency) or network capacity (bandwidth), i.e., how much data can be transmitted in a given time.
Of course, these two are interconnected. If your application (or another application on the same network) generates network traffic that overwhelms available bandwidth, this can increase latency.
Latency
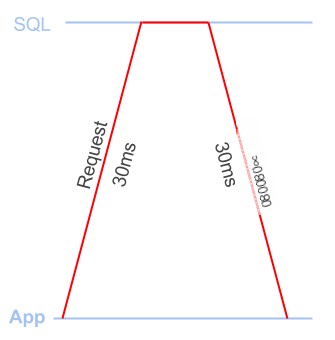
Latency is the time taken to send a TCP packet between the application and SQL Server. You generate latency going up to the DB and back down the way. People usually talk about the latency of the round trip time: that is, the time taken to get there and back.
Figure 1 shows a 60ms round trip.

Figure 1
Bandwidth
The amount of data that can be sent or received within a certain amount of time, usually measured in kb/s or Mb/s (megabits per second).
When discussing bandwidth, people often talk about “the size of the pipe,” which is a good analogy (plus it sounds a bit cheeky): the more pipes you have, the more data you can get through at once.
If your application needs to receive a 10MB response (that’s 80 megabits!), and you have a 20 Mb/s connection, the response will take at least 4 seconds. If you have a 10 Mb/s connection, it’ll take at least 8 seconds. If others on your network are streaming “Game of Thrones,” this will reduce the available bandwidth for your use.
Application Issues: Slow Processing Time
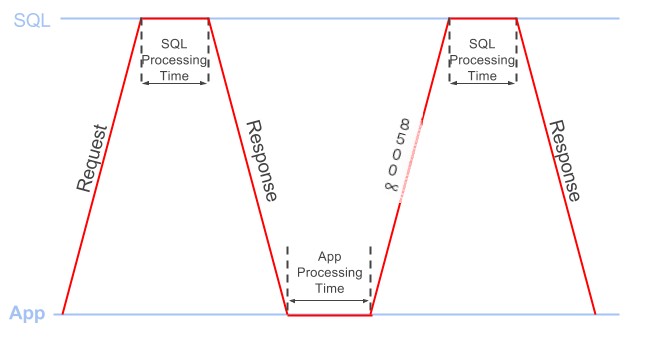
Whenever the client sends a request to SQL Server to retrieve the desired dataset, the total processing time needed to complete the request includes:
Application processing time: How long the application takes to process data from the previous response before sending the next request. SQL processing time: How long SQL takes to process the request before sending a response. Figure 2 provides a simple illustration of this concept.

Figure 2
Where Is All the Time Going?
We’ve spent a lot of time investigating the performance of client/server SQL applications, and there are a plethora of tools, scripts, and methods to help troubleshoot any number of different types of performance issues.
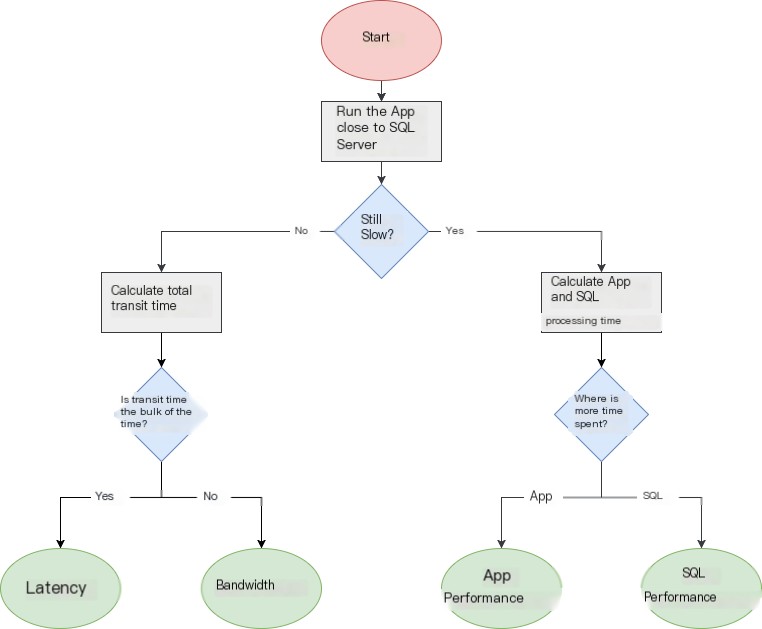
So when faced with slow application response times, can we quickly identify the root cause of the problem? The flowchart in Figure 3 shows a systematic approach to solving the problem.

Figure 3
When investigating performance issues, there may be multiple issues. It’s worth looking at several different parts of the application. Is this a widespread problem? Or slower than others?
It’s best to start small. If you can focus on a specific area of the particularly slow application, it can make life easier, such as if it takes 10 seconds to load results when you click the “select all” button on the invoice page. Focusing on a small, repeatable workflow will allow you to isolate the issue.
The next question, of course, is why does it take 10 seconds? The first and easiest way to narrow down the problem is to run the application as close to the SQL Server as possible, on the same machine or on the same LAN.
If you effectively eliminate any network latency and bandwidth restrictions, it suddenly takes a second or less to select all invoices, then you need to investigate what network issues might vanish in the remaining time.
If the application still takes 10 seconds to load the results, then congratulations, you’ve eliminated two of the 4 issues again! Now, you need to see which part of the processing time is taking up most.
Let’s take a closer look at how to resolve where most of this time is being consumed. You’ll need Wireshark or SQL Profiler (whichever you are more comfortable with).
Investigating Application Processing Time
You will see time between two places: between sending the application response and getting the next request (application processing time) or between issuing the SQL Server request and getting the response (SQL processing time).
To resolve which is causing your problem, you can use Wireshark or SQL Profiler as both can tell us roughly the application and SQL processing time (although the exact figures may differ slightly).
Using Wireshark
We can use Wireshark to capture network traffic as the workflow executes. With Wireshark, we can filter out non-application traffic and view the time differences between all the packets in a workflow.
Calculate approximate application processing time:
The above filter will only show the first TDS packet in each request, and the “delta” column will now display the time between the last response packet from the previous request and the next request. Make sure packets are sorted by the “No.” column, as this will ensure packets are ordered by send/receive sequence.
To get a rough SQL processing time:
The above filter will only show the first TDS packet in each response, and the “delta” column will now display the time between the last request packet of the previous request and the first response packet sent back from SQL Server. Also, make sure packets are sorted by the “No.” column.
Using SQL Profiler
While it’s known that collecting diagnostic data with SQL Profiler adds some overhead to your workflow, it can still give you a broad processing time. You can minimize this overhead by running a server-side trace and then exporting the data as described below. Alternatively, if you are confident with Extended Events and XQuery, you should be able to get similar data through that route.
First, capture a Profiler trace of the workflow, using the “Standard (default)” trace template. Ensure there’s nothing else triggering the database at the same time so you only capture your traffic. After capturing the workload in a trace, save it to a trace table using File | Save As | Trace Table.
In SQL Management Studio, use the following two queries on the table you created to provide you with approximate application and SQL processing times:
Investigating Latency and Bandwidth Issues
If the application runs quickly locally, it seems you have a network problem. At this point, you will need to know the latency between the application and SQL Server. You can get a rough idea with a ping, which will tell you the round trip time between the two. Try and measure when the network is under low load as high network load can increase the ping times.
If you calculate the number of queries the application issues, you can calculate the time the latency has consumed.
To get the query count in Wireshark, you can apply the following filter and see the “displayed” count in the status bar:
To get the query count in SQL Profiler, create a trace table as described previously, and run the following query:
You need to multiply this query count by the network latency (ping value). For example, if the application sends 100 queries and your network latency is 60ms, then the total travel time is 100 * 60ms = 6000ms (6 seconds).
This should tell you if latency is your issue. If not, you have a bandwidth problem.
When, after a while, we don’t see an obvious bandwidth issue, and we’ve just ruled out other problems. How do we confirm? Good question, I’m afraid it’s a bit unsettling.
If you have a network-level device with traffic monitoring and a dedicated connection to SQL Server, you can see if your workflow saturates the available bandwidth.
Alternatively, when you know there’s no bandwidth bottleneck, you need to see how much bandwidth your application uses. To do this, you still need to run the application close to the database, capture packets in Wireshark, and check the bandwidth used by the application. Again, ensure you are not running any other local SQL applications except the one you’re attempting to capture.
Once you complete the capture in Wireshark:
Of course, for an accurate comparison, you’ll need to run both tests with SQL Server and the application on similar hardware. For instance, if SQL Server is running on less powerful hardware, it will generate less traffic over the network in a given time.
Root Cause Analysis
It’s likely you have multiple problems! However, after completing the above steps, you should be able to account for all the time spent processing the workflow. If the 10-second processing time breaks down into 6 seconds of SQL processing time, 3 seconds of transport time, and 1 second of application processing time, you’ll know how to prioritize your investigations.
If the primary issue is slow SQL processing time, there is plenty of information on tuning and tracing the problems. For example, since we already captured Profiler traces, Gail Shaw’s article gives great insights on how to find the procedures and batches most contributing to performance problems in traces. Additionally, Jonathan Kehayias’ book is great for troubleshooting common performance issues in SQL Server.
Conversely, if most of the time is spent on client-side processing, you may need to consider profiling the application code to find the problem. Depending on your programming language (e.g., for .NET languages, you could use ANTS from Redgate or JetBrains’ dotTrace), there are many profiling tools available.
If you encounter a network bandwidth issue, you may need to limit the size of the data you’re requesting. For example, don’t use “SELECT *” when requesting data. Only return the necessary columns and use WHERE or HAVING filters to only return the necessary rows.
In our experience, a common cause of performance issues is running “chatty” applications over a high-latency network. A chatty application is one that sends many repetitive and unnecessary queries, causing more network round trips than necessary.
Usually, these applications were initially developed and deployed on a high-speed LAN, so the chattiness never caused an issue. What happens when data moves to different locations, such as the cloud? Or clients from different continents try to access it? Or you need to build a geographically diverse disaster recovery environment? If you consider how a query on a 1ms LAN slows down 60 times over a 60ms WAN, you can see how this affects your performance.
In short, when writing client/server applications, you need to avoid executing the same queries frequently to minimize the necessary round trips to collect the required data. The two most common ways to achieve this are:
We have done a lot of research on these issues while developing tools and adopting a machine learning approach to predict what an application will do and pre-fetch the necessary data so it is ready as the application requests it.
Summary
Before you spend a significant amount of time and money on potential solutions, make sure you’re addressing the root of the problem. We have seen companies spend vast sums and man-hours optimizing SQL queries when the biggest issue lay in application performance problems. Conversely, we have seen companies plow more memory or CPU into SQL servers, which never compensated for the added time from network latency. If you can identify where the real use of workflow processing time lies, you can direct your time and effort in the right manner.
We hope this gives you an understanding of how to investigate your application’s performance or begin tracking down any issues you may encounter.


