

Monitoring Disk IO Performance (Commands: iostat, iotop)
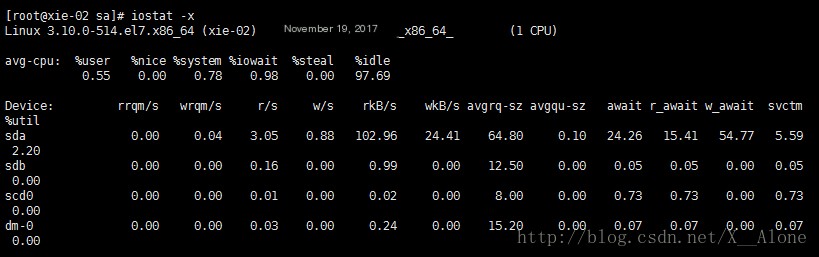
Check disk read/write status: iostat -x %util: Indicates IO wait, which is the percentage of CPU occupied by disk usage. If the percentage is high, like 50% or 60%, it means the disk IO is poor because the disk is busy, and the read/write status values rkb/s, wkb/s will also be high.
 >
>
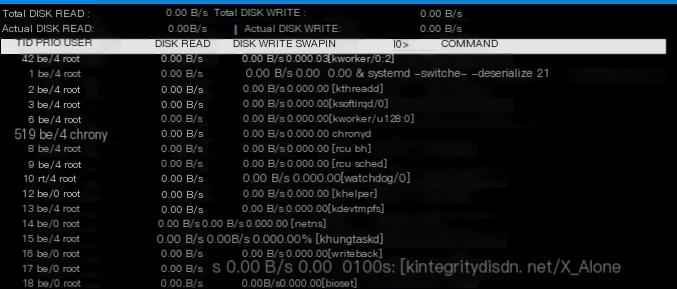
To see which processes are reading/writing disk IO, you can check which processes are making the disk IO busy (installation package: yum install -y iotop): iotop The more disk IO a process uses, the higher it ranks.
 >
>
“iostat Command”
View the total memory size of the current system and the usage of memory
Check the usage of memory and swap partitions: free //Displays in kb free -m //Displays in M free -h //Displays in appropriate units, including M, G (commonly used) Mem is the memory usage, including total size (total), used (used), free (free), shared (shared), buffer/cache (buffer/cache), and available memory size (available) Swap is the usage of swap partitions

Formula: total=used+free+buff/cache available includes the remaining part of free and buffer/cache
PS: 0000 (disk) —> memory (cache) –> CPU //The speed of reading data from the disk to the CPU is very slow, but if the data from the disk is placed in memory, the speed of reading from memory to the CPU is very fast. CPU (0000) —> memory (buffer)–> disk //The CPU runs very fast, but the disk is slow, so writing data to the disk is slow, and the CPU can’t wait, so the data processed by the CPU is first placed in memory and then into the disk.
View Processes: ps Command
The ps command is used to view system processes, listing the current process usage status statically and one-time.
Common command usage: ps aux
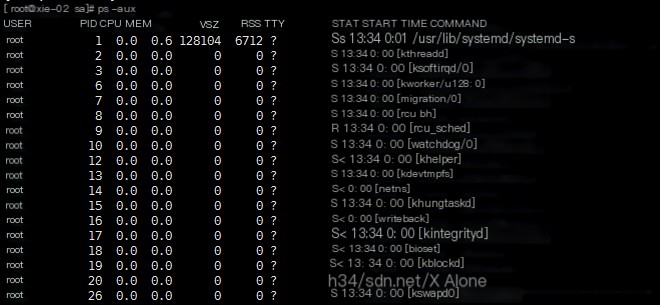
%MEM: Memory percentage. VSZ: Virtual memory. RSS: Physical memory. TTY: Control interrupt. START: When it started. TIME: How long it has been running. COMMAND: Command. STAT section explanation: D Uninterruptible process R Running process S Sleeping process T Stopped process Z Zombie process < High priority process N Low priority process L Memory locked in memory paging s Main process l Multithreaded process + Foreground process + ps -elf
View where the process started: ls -l /proc/processPID //Each process PID has a corresponding directory
PS: The relationship between threads and processes: Threads belong to processes, run within the process space, and threads generated by the same process share the same user memory space. When a process exits, the threads generated by that process are forcibly exited and cleared. Therefore, threads cannot execute independently; they must depend on a running application (i.e., a process), and a process requires at least one thread to execute its instructions. Processes manage resources (such as CPU, memory, files, etc.). Assigning threads to a CPU for execution The difference between threads and processes: After the operating system allocates resources to a process, multiple threads within the same process can share the memory resources of the process because threads do not have their own independent memory resources; they only have their own execution stack and local variables. Each process has its own complete set of variables, meaning each process has its own independent memory unit. This makes communication between multiple threads easier and more efficient than communication between multiple processes.
View Network Status
Command: netstat //View the communication status of TCP/IP
ss -an Similar to netstat, but does not display process names.
The meaning of each option in the command is as follows: -a Show all sockets, including those being listened to.
-c Refresh every second until interrupted by the user.
-i Show information for all network interfaces, formatted like “ifconfig -e”.
-n Display network IP addresses instead of names, showing network connection status.
-r Display the kernel routing table, formatted like “route -e”.
-t Show the connection status of the TCP protocol.
-u Show the connection status of the UDP protocol.
-v Show ongoing work.
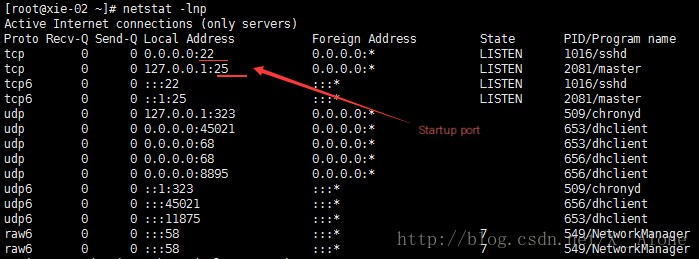
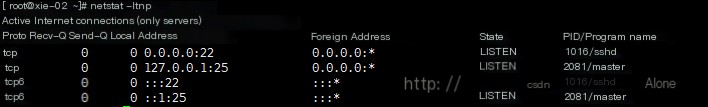
View listening ports, print which ports are started by the current system: netstat -lnp
netstat -ltnp //Only view TCP, no UDP or UNIX
netstat -ltunp //Only view TCP, UDP. No UNIX
View all network connection statuses of the system: netstat -an
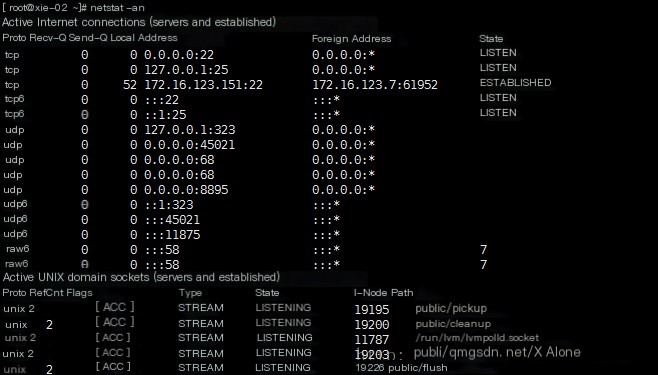
netstat -an parameter stat (status) meanings are as follows:
|
Parameter |
Meaning |
|---|---|
|
LISTEN |
Listening for incoming TCP port connection requests |
|
SYN-SENT |
Waiting for a matching connection request after sending a connection request |
|
SYN-RECEIVED |
Waiting for confirmation of a connection request after receiving and sending a connection request |
|
ESTABLISHED |
Represents an open connection, often used as the number of concurrent connections |
|
FIN_WAIT-1 |
Waiting for a remote TCP connection interrupt request, or confirmation of a previous connection interrupt request |
|
FIN_WAIT-2 |
Waiting for a connection interrupt request from remote TCP |
|
CLOSE-WAIT |
Waiting for a connection interrupt request from the local user |
|
CLOSING |
Waiting for confirmation of a connection interrupt from remote TCP |
|
TIME_WAIT |
Waiting long enough to ensure the remote TCP connection receives the interrupt request confirmation |
|
LAST_ACK |
Waiting for confirmation of a connection interrupt originally sent to remote TCP |
|
CLOSED |
No connection state |
– In daily work, we can use shell combination commands to view and summarize the TCP connection status of the server, as follows: netstat -an|awk ‘/^tcp/{++S[$NF]}END{for (a in S)print a,S[a]}’netstat -an | awk ‘/^tcp/ {++sta[$NF]} END {for(key in sta) print key,”\t”,sta[key]}’
Parameter explanation:
|
Parameter |
Explanation |
|---|---|
|
CLOSED |
No connection activity or ongoing |
|
LISTEN |
The server is waiting for incoming calls |
|
SYN_RECV |
A connection request has arrived, waiting for confirmation |
|
SYN_SENT |
The application has started, opening a connection |
|
ESTABLISHED |
Normal data transmission state, can be approximately understood as the current server’s concurrency; (if the value is large, it means the system is busy, within 1000 is acceptable) |
|
FIN_WAIT1 |
The application has completed |
|
FIN_WAIT2 |
The other side agrees to release |
|
ITMED_WAIT |
Waiting for all packets to die |
|
CLOSING |
Both sides are trying to close simultaneously |
|
TIME_WAIT |
The other side has initiated a release |
|
LAST_ACK |
Waiting for all packets to die |
– Count the number of TCP connections command: netstat -an |grep ‘ESTABLISHED’ |grep ‘tcp’ |wc -l
Packet Capture in Linux
Packet capture tool tcpdump Installation package: yum install -y tcpdump
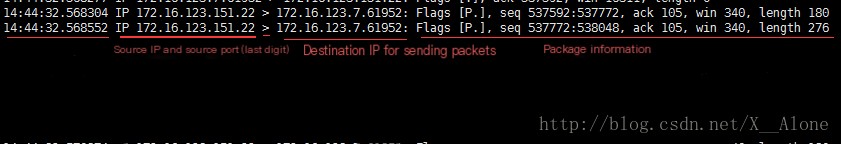
Usage: tcpdump -nn
- To view a specific network card, use parameter i: tcpdump -nn -i ens33
- View packets on a specific port: tcpdump -nn -i ens33 port 22
- Do not view packets on a certain port: tcpdump -nn -i ens33 not port 22 //View other ports except port 22
- Only view packets of a certain IP: tcpdump -nn -i ens33 not port 22 and host 113.105.125.150 //Only view packets of IP 113.105.125.150 on ports other than 22
- Set how many packets to capture (-w writes the file as data packets): tcpdump -nn -c 100 -w 1.cap //Capture only 100 packets and put them in file 1.cap. The content of the 1.cap file cannot be directly viewed with cat because this file is the data packet information captured from the network card, which is real communication data.
- View the contents of the packet capture data file (-r displays the information as data streams): tcpdump -r 1.cap
Command: tshark //A packet capture tool similar to tcpdump
Installation package command: yum install -y wireshark
View which IP accesses what link on our website: tshark -n -t a -R http.request -T fields -e “frame.time” -e “ip.src” -e “http.host” -e “http.request.method” -e “http.request.uri”
Extension: 1. Extend TCP three-way handshake and four-way wave http://www.doc88.com/p-9913773324388.html 2. Use tshark for packet capture:
- The following usage can display the domain name and URI of the HTTP request tshark -n -t a -R http.request -T fields -e “frame.time” -e “ip.src” -e “http.host” -e “http.request.method” -e “http.request.uri”
- The following can capture MySQL queries tshark -n -i eth1 -R ‘mysql.query’ -T fields -e “ip.src” -e “mysql.query” Another method: tshark -i eth1 port 3307 -d tcp.port==3307,mysql -z “proto,colinfo,mysql.query,mysql.query”
- The following can capture specified types of MySQL queries tshark -n -i eth1 -R ‘mysql matches “SELECT|INSERT|DELETE|UPDATE”’ -T fields -e “ip.src” -e “mysql.query”
- Statistics of HTTP status tshark -n -q -z http,stat, -z http,tree This command will display results until you press ctrl + c
- tshark adds a timestamp tshark -t adtshark -t a