

Received development feedback: TCP retransmission is severe. Host message retransmission is the most basic error recovery function of TCP, aimed at preventing message loss.
 />
/>
There are many possible factors for message loss.
- 1. Network device or line failure
Example: CRC data checksum errors frequently appearing on device interfaces
Characteristic: The issue persists continuously, affecting all data passing through the node, impacting a large number of servers. - 2. Traffic surge on the data path causing link congestion
Example: Severe packet loss due to a dedicated line being fully utilized
Characteristic: Extremely sudden, short duration. Often has periodicity. All data passing through this node are affected, impacting a large number of servers. - 3. Client server failure
Example: A server NIC failure or performance degradation
Characteristic: Fault persists for a long time, affecting only a single device. - 4. Server-side server failure
Example: A server NIC failure
Characteristic: Fault persists for a long time, affecting all requests to this node, impacting a large number of servers. - 5. Server-side performance degradation
Example: During operation activities, a massive amount of requests to the server leads to performance degradation
Characteristic: Sudden, if there’s a huge amount of requests to the server, there may be periodicity, potentially affecting all data to this device (cluster), impacting a large number of servers. - 6. Degradation of proxy node or VIP performance
Example: A failure or performance degradation in a load balancing cluster
Characteristic: Sudden, with periodicity. All data requests to this node are affected, impacting a large number of servers.
First, capture packets and generate a pcap file with tcpdump -i nsdb475e5d-86 -vvv -w tcp_retry.pcap, keeping the evidence is critical. Simultaneously, monitor the duty group and network emergency response group for similar feedback. If others report, promptly confirm the affected scope, and check if servers have commonalities, such as being concentrated in a specific data center, under a specific POD, or on a specific physical machine.
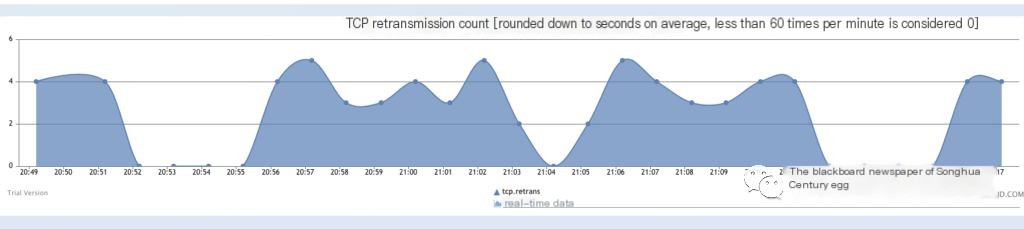
Use the following command to observe in real time the number of TCP retransmission packets per second in the system, it’s recommended to use Alibaba’s tsar-Taobao System Activity Reporter as an online monitoring tool.
nstat -z -t 1 | grep -e TcpExtTCPSynRetrans -e TcpRetransSegs -e TcpOutSegs -e TcpInSegs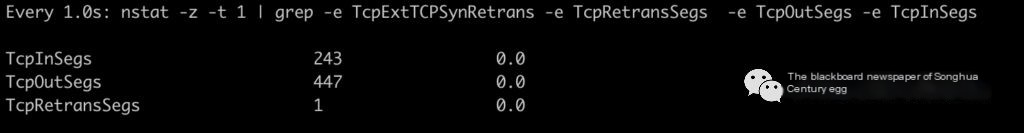 />
/>
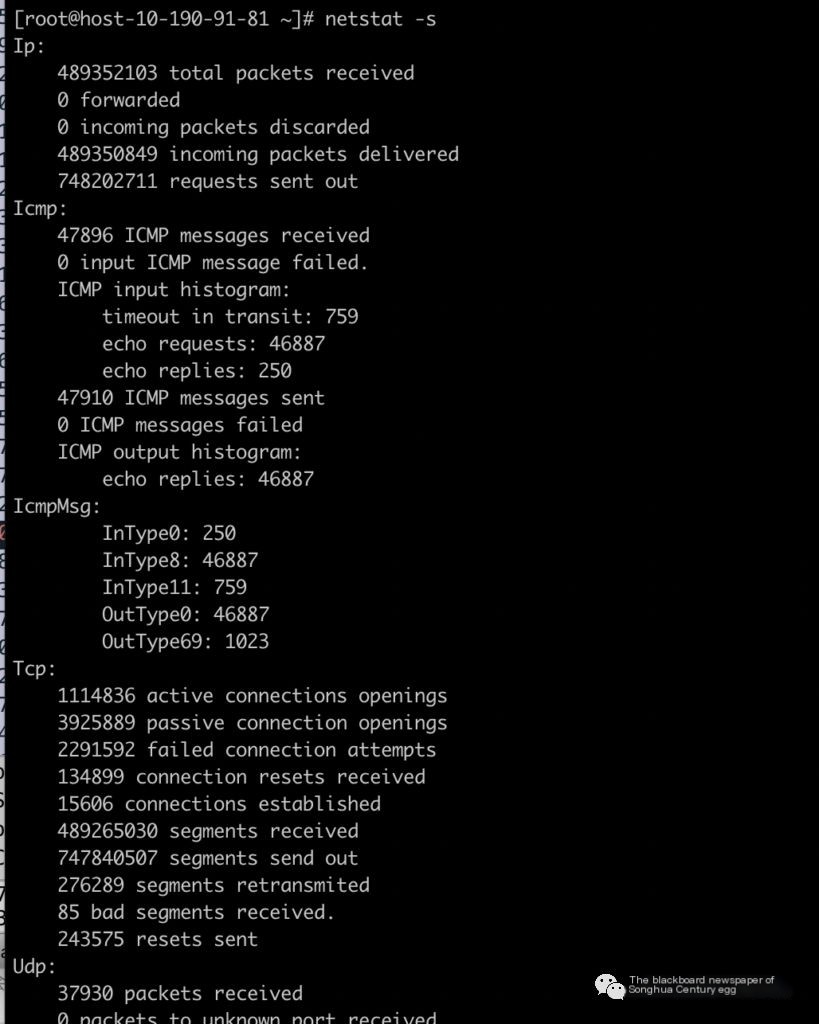
Use netstat -s to see the overall situation, statistics by each protocol are as follows
ss -anti |grep -B 1 retrans to view the retransmission statistics, specific to IP+port, conveniently demonstrated here using ss -tanl.
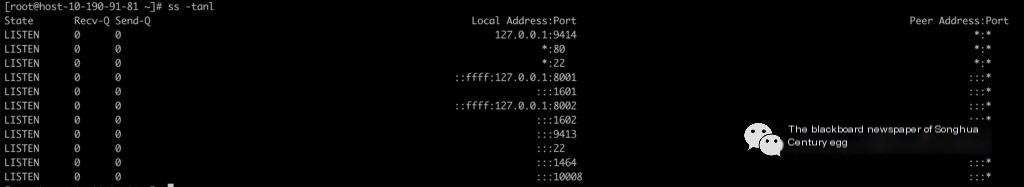
- 1. LISTEN state:
These two values represent the maximum listen backlog value, shown here as 0, but actually takes the value of the kernel parameter net.core.somaxconn.
- 2. Other states:
- (1) recv-Q: represents the network receive queue, indicating how much received data is in the local receive buffer and has not yet been taken by the process. If briefly non-zero, it might be in a half-connected state. If the receive queue Recv-Q remains blocked, it might be undergoing a denial-of-service attack.
- (2) send-Q: represents the network send queue, data not received or acknowledged by the other party, which is still in the local buffer. If the send queue Send-Q cannot quickly clear, there may be applications sending packets too fast or the other party not receiving packets quickly enough.
The non-LISTEN state is typically expected to be 0; if not, it may indicate a problem. Packets in both queues should not accumulate, and temporary non-zero states are acceptable.
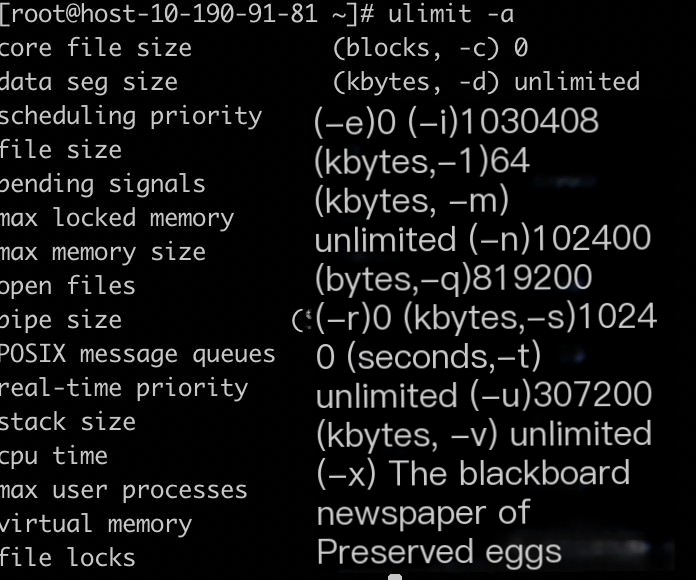
Use ulimit -a to check the limit on the number of file handles opened by services; 100,000 or more is generally sufficient.
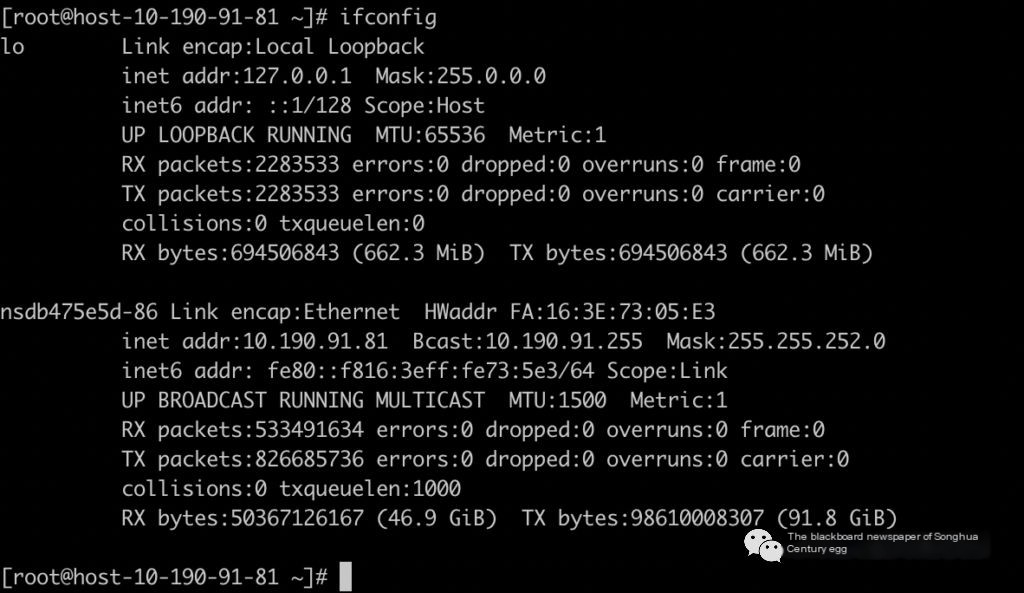
Use ifconfig to check if the NIC has persistent drop or error phenomena.
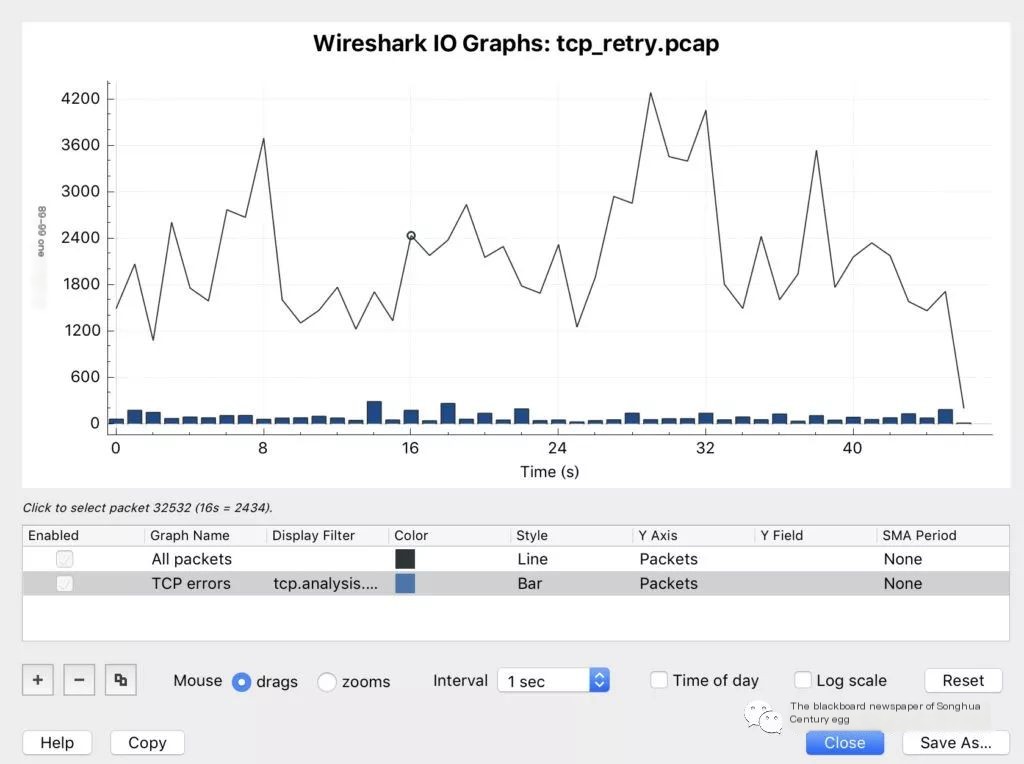
The container state is normal, starting to use Wireshark to analyze packet capture files.
View IO graph to ensure the link is not busy. An unbusy link IO will have many peaks and valleys, spikes, and idle gaps.
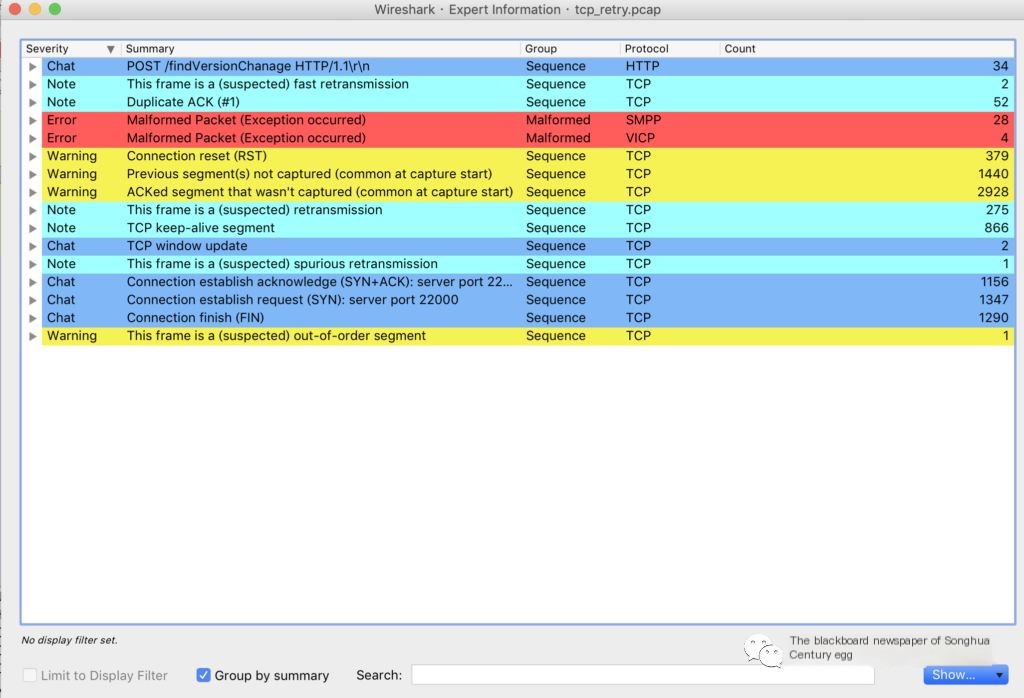
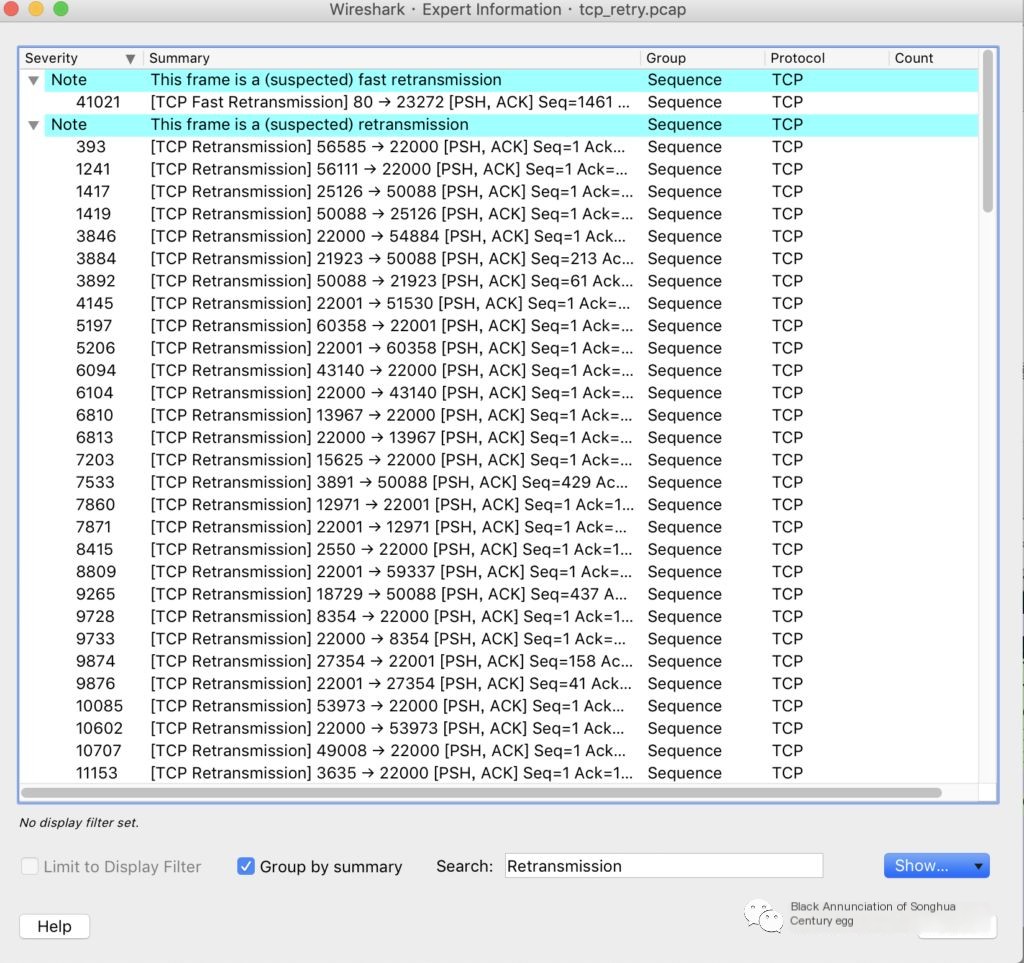
Enter Analyze–>Expert Info to view tip messages of different levels under different tags, such as retransmission statistics, connection establishment, and reset statistics.
Filter retransmissions, found concentrated on ports 22000 and 22001 in the internal network service framework JSF.
Suspect a service abnormality or communication anomaly at an upstream interface, click a note to view details or go back to the dashboard, input tcp.analysis.retransmission filter and click to view details.
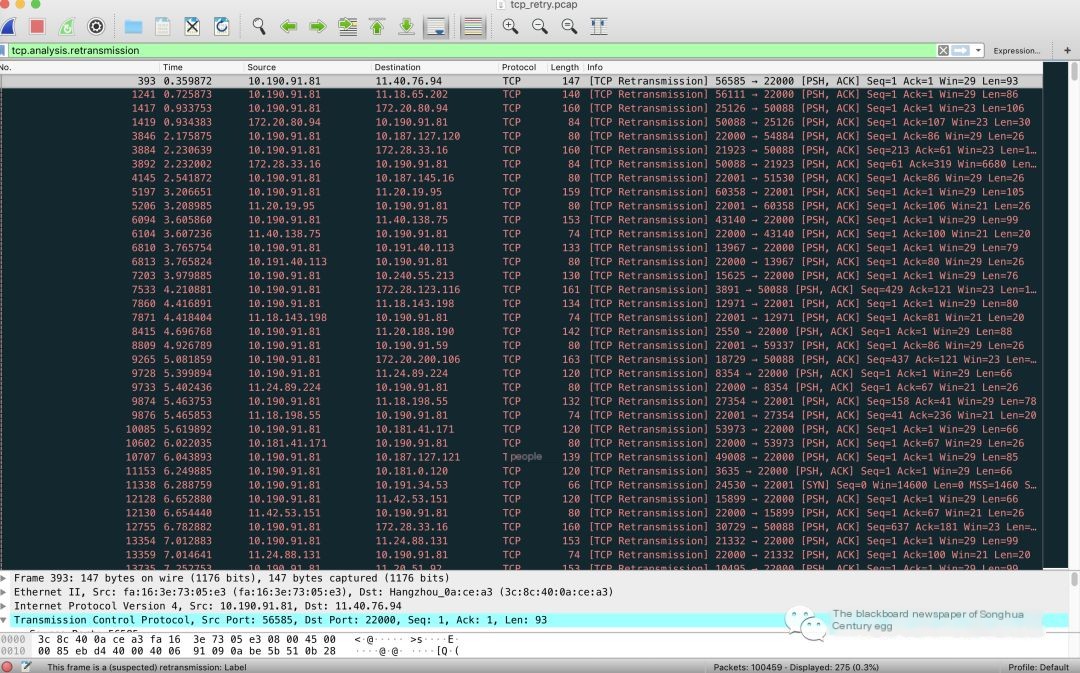
Most were retransmissions occurring during DATA data transmission, PSH ACK messages indicate the start of sending data to the server.
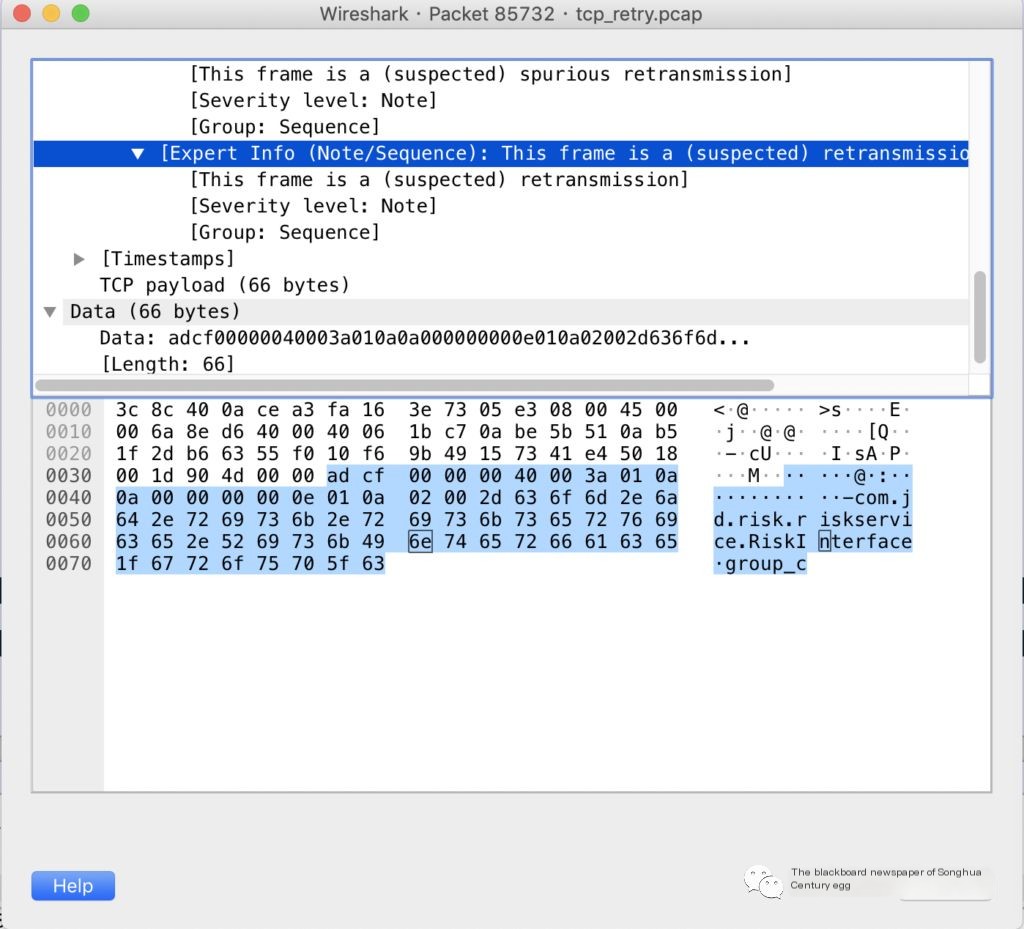
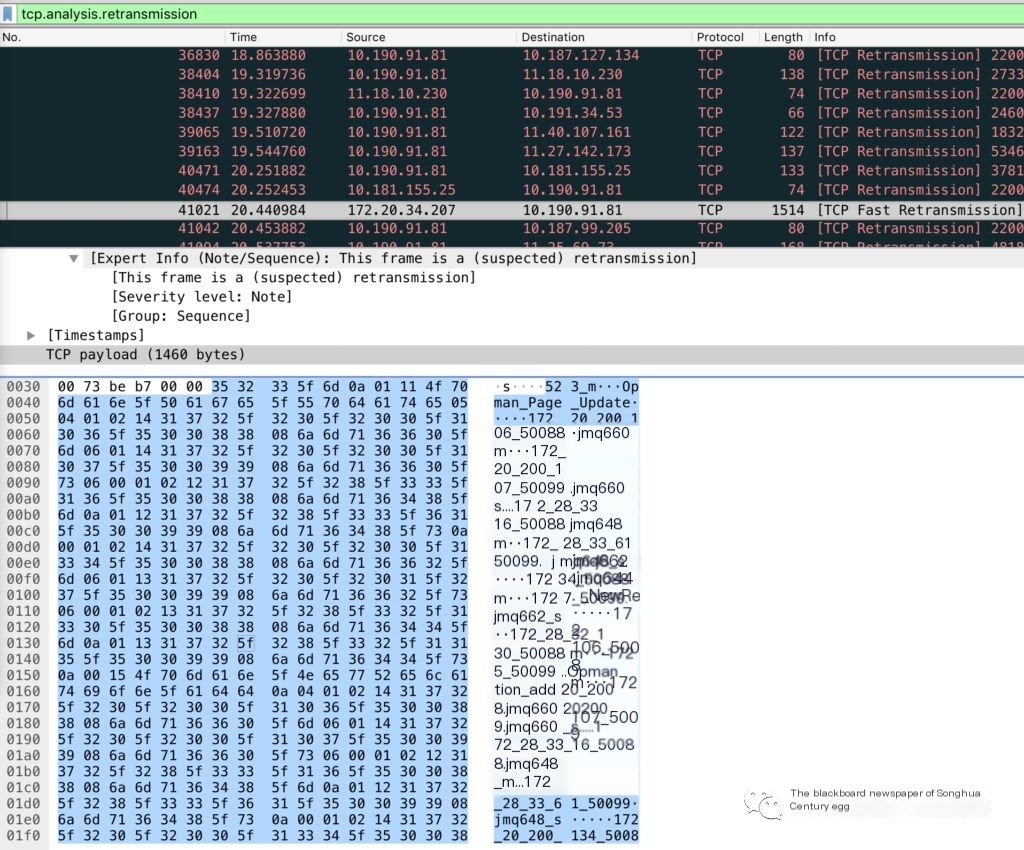
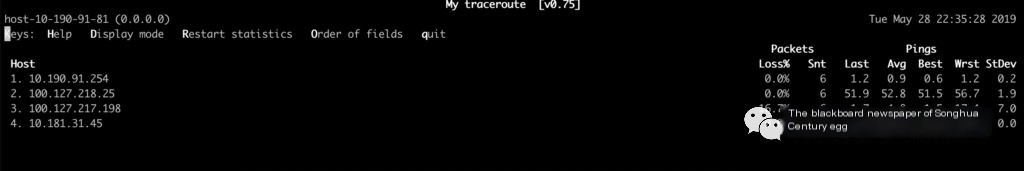
It’s visible that many upstream interfaces and different dependency types (such as JMQ) have retransmissions, indicating it’s not an issue with a specific interface but a network problem. Use mtr (integrating traceroute, ping, nslookup functions) to check the interconnect address delay and packet loss along the path, finding one hop with a 16.7% packet loss rate in the middle, then consult colleagues from the network group for verification.
Supplementary I: Common Operations in Wireshark
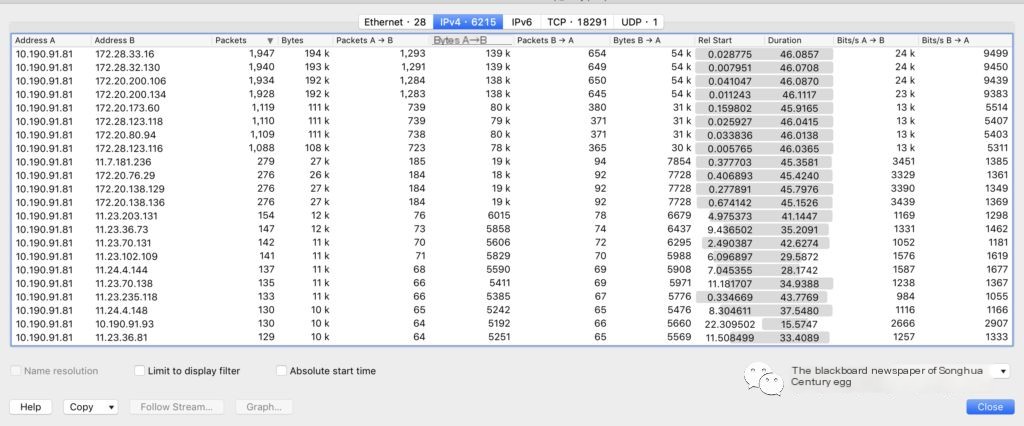
1. Statistics->Conversations session statistics function, which counts the number of packets and bytes received and sent between communication sessions, can be used to find out which sessions (IP addresses or port numbers) occupy the most bandwidth in the network, further forming a network strategy.
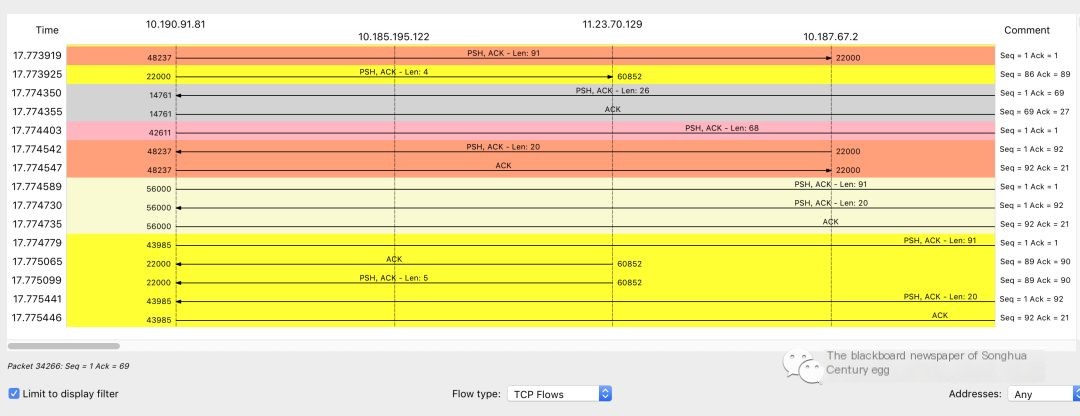
2. Statistics–>Flow graph session communication process graphical visualization, and whether there is TCP delay, including delayed acknowledgment (Delayed ACK), if the server has enabled the Nagle algorithm.
Supplementary II: Common Tips in Wireshark Info
- 1. Packet size limited during capture
Indicates the marked packet was not fully captured. Generally caused by capture methods, as some operating systems default to capturing only the first 96 bytes of each frame. - 2. TCP Previous segment not captured
If Wireshark finds that the next packet’s Seq is greater than Seq+Len, it knows a segment is missing, and if the missing segment cannot be found in the entire network packet (excluding disorder), it will prompt. - 3. TCP ACKed unseen segment
When Wireshark finds the acknowledged packet was not captured, it will prompt. - 4. TCP Out-of-Order
When Wireshark finds the next packet’s Seq number is less than the previous packet’s Seq+Len, it considers it is out of order and prompts. - 5. TCP Dup ACK
When disorder or packet loss occurs, the receiver will receive some packets where the Seq number is larger than expected. Each time one of these packets is received, the expected Seq value will be acknowledged once, reflecting on the sender. - 6. TCP Fast Retransmission
When the sender receives 3 or more TCP Dup ACKs, it realizes a previously sent packet may be lost and quickly retransmits it. - 7. TCP Retransmission
If a packet is truly lost, and no subsequent packet triggers a Dup Ack on the receiver, it will not be quickly retransmitted. In this case, the sender will have to wait for timeout before retransmission. - 8. TCP zerowindow
The win in the packet represents the size of the receiving window. When Wireshark finds win=0 in a packet, it will prompt. - 9. TCP window Full
This prompt indicates the sender of this packet has exhausted the receiving window declared by the other party. - 10. Time-to-live exceeded (Fragment reassembly time exceeded)