Log Module
Q1: In what file format does Suricata store logs?
Logs are divided into three categories: json, log, and pcap formats.
Q2: What levels are Suricata logs divided into?
The log levels are divided into: Emergency, Alert, Critical, Error, Warning, Notice, Info, Debug
Q3: What information does the Suricata log record, and in what format is it organized?
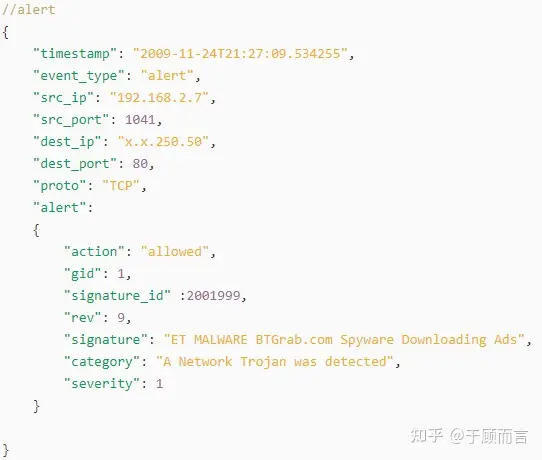
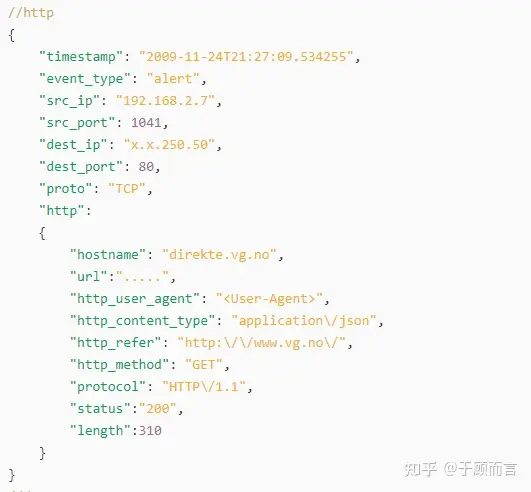
- eve.json
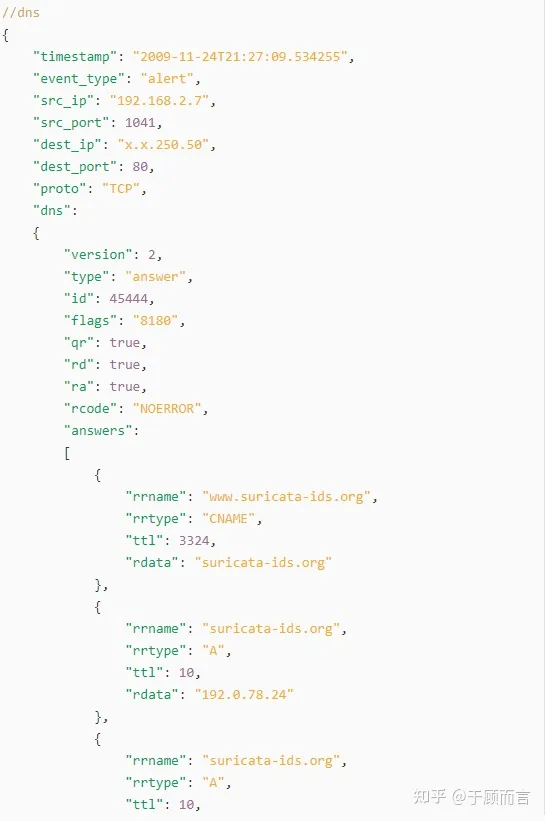
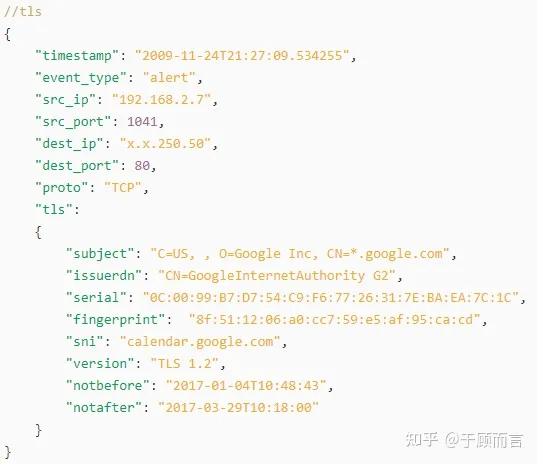
All alerts, metadata, file information, and specific protocol records in Suricata are recorded in eve.json. Event types include alert, http, dns, tls, drop.
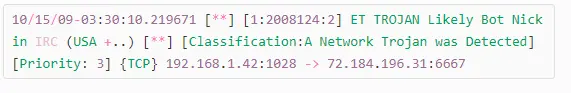
2. fast.log
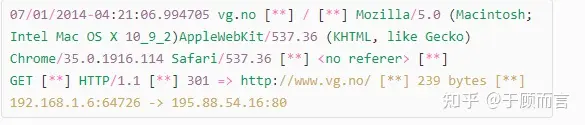
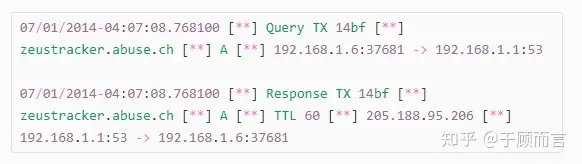
3. http.log
4. dns.log
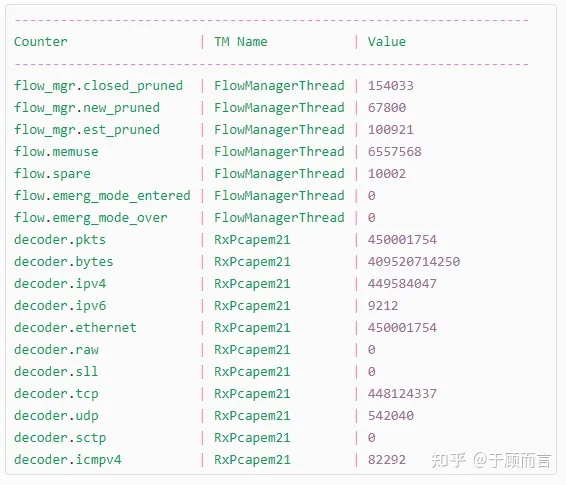
5. stats.log
6. drop.log
Collection of discarded packets
7. log.pcap.timestamp
Pcap packets
8. Custom log output
Using Lua scripts, by rewriting four functions: init(), setup(), log(), deinit()
you can customize the log output format.
Q4: What technology does Suricata use to record these logs?
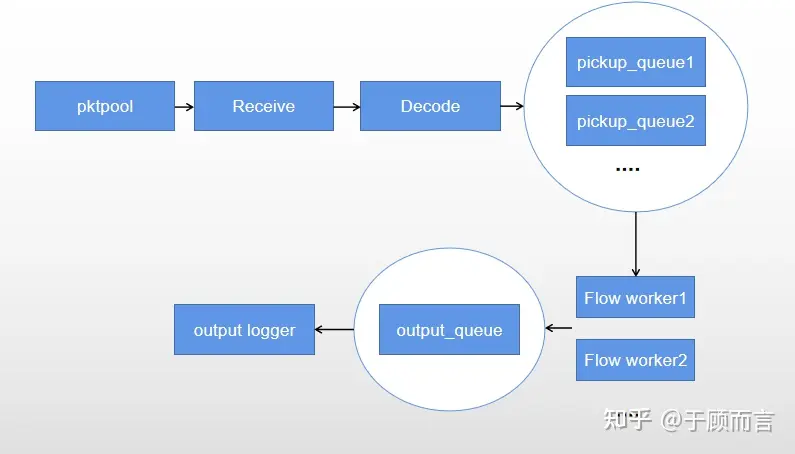
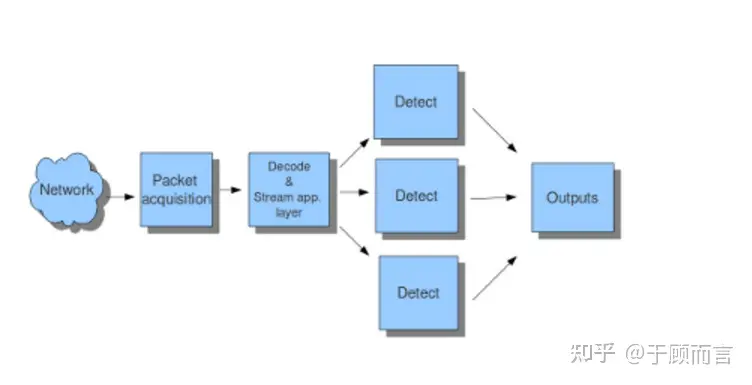
The default running mode used by Suricata is autofp (representing “automatic flow pinned load balancing mode”). In this mode, packets from each flow are assigned to a single detection thread.
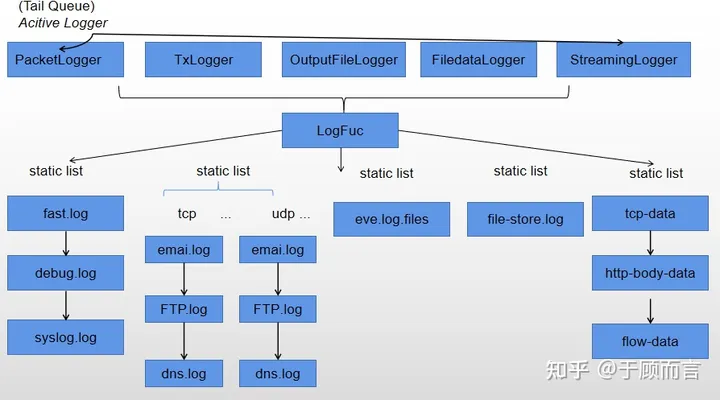
When Suricata is powered on, it links the output modules that need to be activated into a global variable list via a YAML configuration file. After the detection thread sends data to the output queue, the output thread checks the output_queue, where generic data is stored, and subsequently converts this data into different types of logs according to the active register, completing the log printing.
Q5: When does Suricata write to the disk?
In autofp mode, an outputs thread is generated. After the detection thread completes detection, it will call the output thread to notify it of new data, after which outputs will write the output_queue data to the disk.
Code Review
Log Implementation Principle
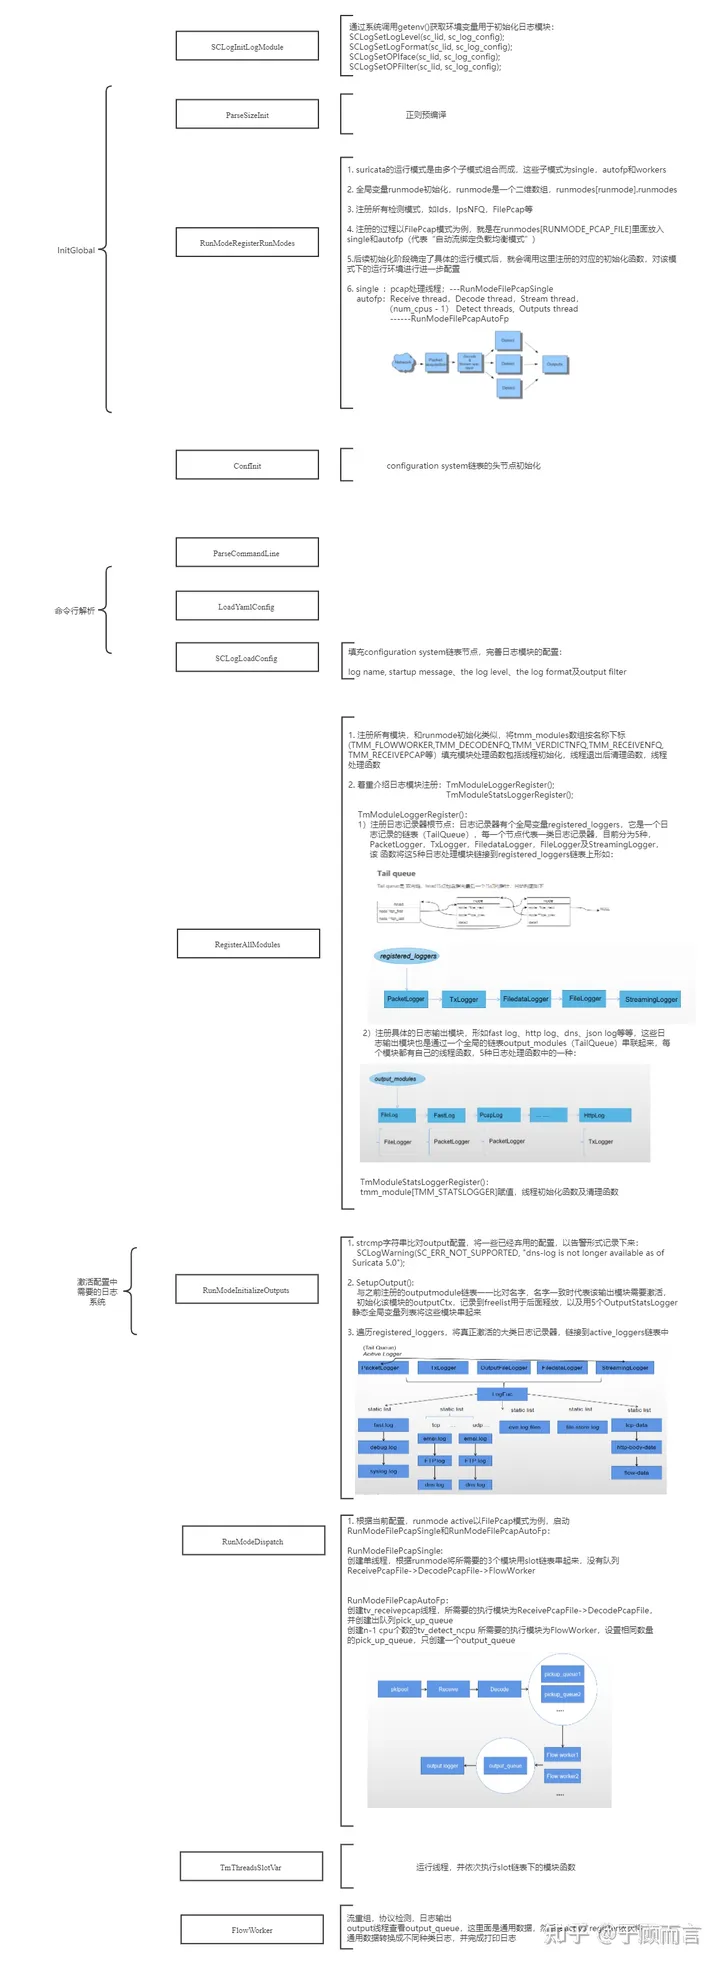
Log Data Flow